New Semester
Started
Get
50% OFF
Study Help!
--h --m --s
Claim Now
Question Answers
Textbooks
Find textbooks, questions and answers
Oops, something went wrong!
Change your search query and then try again
S
Books
FREE
Study Help
Expert Questions
Accounting
General Management
Mathematics
Finance
Organizational Behaviour
Law
Physics
Operating System
Management Leadership
Sociology
Programming
Marketing
Database
Computer Network
Economics
Textbooks Solutions
Accounting
Managerial Accounting
Management Leadership
Cost Accounting
Statistics
Business Law
Corporate Finance
Finance
Economics
Auditing
Tutors
Online Tutors
Find a Tutor
Hire a Tutor
Become a Tutor
AI Tutor
AI Study Planner
NEW
Sell Books
Search
Search
Sign In
Register
study help
business
macroeconomics
Macroeconomics 4th Edition Paul Krugman, Robin Wells - Solutions
In 2010, Tim Geithner, Treasury secretary at the time, published an article defending the administration’s policies. In it he said, “The recession that began in late 2007 was extraordinarily severe. But the actions we took at its height to stimulate the economy helped arrest the free fall,
In 2012, Hurricane Sandy caused massive destruction to the northeast United States. Tens of thousands of people lost their homes and possessions. Even those who weren’t directly affected by the destruction were hurt because businesses failed or contracted and jobs dried up. Using one of the
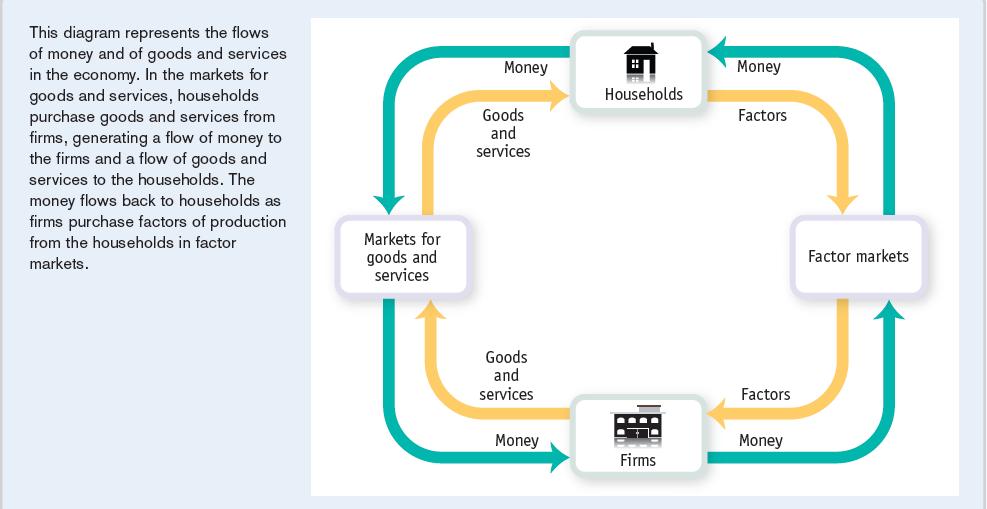
Use the circular-flow diagram to explain how an increase in the amount of money spent by households results in an increase in the number of jobs in the economy.Describe in words what the circular-flow diagram predicts.Circular flow diagram This diagram represents the flows of money and of goods and
A survey indicated that chocolate is the most popular flavor of ice cream in America. For each of the following, indicate the possible effects on demand, supply, or both as well as equilibrium price and quantity of chocolate ice cream.a. A severe drought in the Midwest causes dairy farmers to
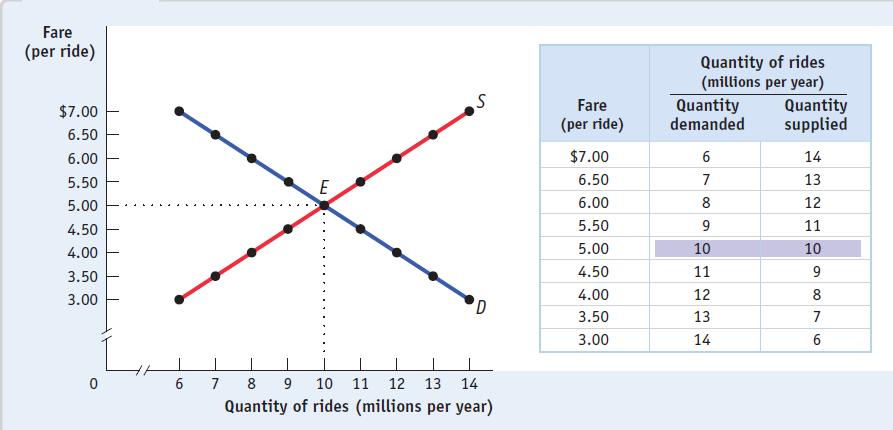
Assume that the quota limit is 8 million rides. Suppose demand decreases due to a decline in tourism. What is the smallest parallel leftward shift in demand that would result in the quota no longer having an effect on the market? Illustrate your answer using Figure 4-7.Figure 4-7 Fare (per ride)
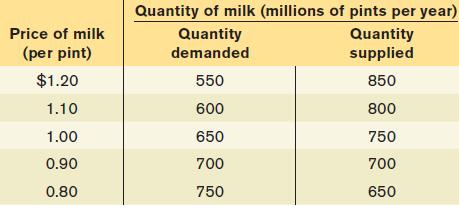
The accompanying table shows hypothetical demand and supply schedules for milk per year. The U.S. government decides that the incomes of dairy farmers should be maintained at a level that allows the traditional family dairy farm to survive. So it implements a price floor of $1 per pint by buying
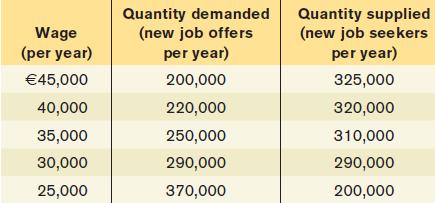
European governments tend to make greater use of price controls than does the U.S. government. For example, the French government sets minimum starting yearly wages for new hires who have completed le bac, certification roughly equivalent to a high school diploma.The demand schedule for new hires
In 2002 the United States imposed tariffs on steel imports, which are an input in a large number and variety of U.S. industries. Explain why political lobbying to eliminate these tariffs is more likely to be effective than political lobbying to eliminate tariffs on consumer goods such as sugar or
Over the years, the WTO has increasingly found itself adjudicating trade disputes that involve not just tariffs or quota restrictions but also restrictions based on quality, health, and environmental considerations. Why do you think this has occurred?What method would you, as a WTO official, use to
Since 2000, the value of U.S. imports of men’s and boy’s apparel from China has more than tripled. What prediction does the Heckscher-Ohlin model make about the wages received by labor in China?
Determine the amount of consumer surplus generated in each of the following situations.a. Leon goes to the clothing store to buy a new T-shirt, for which he is willing to pay up to $10. He picks out one he likes with a price tag of exactly $10. When he is paying for it, he learns that the T-shirt
Which of the following questions involve microeconomics, and which involve macroeconomics?In each case, explain your answer.a. Why did consumers switch to smaller cars in 2008?b. Why did overall consumer spending slow down in 2008?c. Why did the standard of living rise more rapidly in the first
Why do we talk about business cycles for the economy as a whole, rather than just talking about the ups and downs of particular industries? Describe who gets hurt in a recession, and how.
How do economists in the United States determine when a recession begins and when it ends? How do other countries determine whether or not a recession is occurring?
The U.S. Department of Labor reports statistics on employment and earnings that are used as key indicators by many economists to gauge the health of the economy. Figure 6-4 in the text plots historical data on the unemployment rate each month. Noticeably, the numbers were high during the recessions
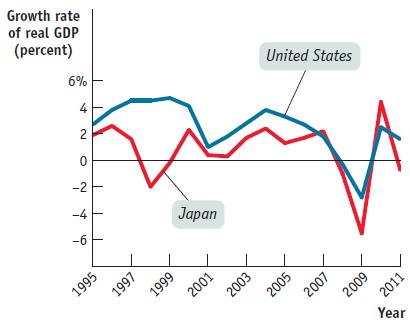
In the 1990s there were some dramatic economic events that came to be known as the Asian financial crisis. A decade later similar events came to be known as the global financial crisis. The accompanying figure shows the growth rate of real GDP in the United States and Japan from 1995 to 2011. Using
Why do we consider a business-cycle expansion different from long-run economic growth? Why do we care about the size of the long-run growth rate of real GDP relative to the size of the growth rate of the population?
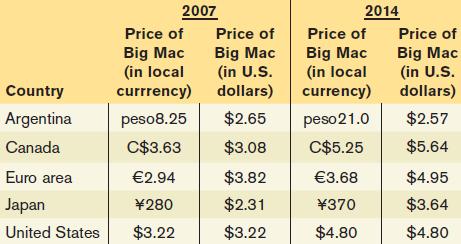
Each year, The Economist publishes data on the price of the Big Mac in different countries and exchange rates.The accompanying table shows some data from 2007 and 2014. Use this information to answer the following questions.a. Where was it cheapest to buy a Big Mac in U.S. dollars in 2007?b. Where
College tuition has risen significantly in the last few decades. From the 1981–1982 academic year to the 2011–2012 academic year, total tuition, room, and board paid by full-time undergraduate students went from $2,871 to $16,789 at public institutions and from $6,330 to $33,716 at private
Assume there are only two goods in the economy, french fries and onion rings. In 2013, 1,000,000 servings of french fries were sold at $0.40 each and 800,000 servings of onion rings at $0.60 each. From 2013 to 2014, the price of french fries rose by 25% and the servings sold fell by 10%; the price
From 2005 to 2010, the price of electronic equipment fell dramatically and the price of housing rose dramatically. What are the implications of this in deciding whether to use 2005 or 2010 as the base year in calculating 2013 real GDP?
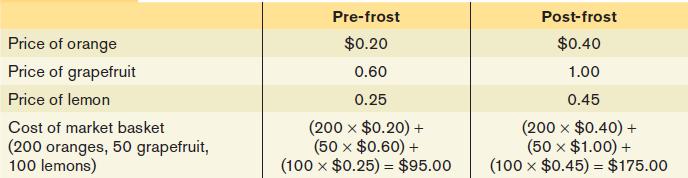
Consider Table 7-3 but suppose that the market basket is composed of 100 oranges, 50 grapefruit, and 200 lemons. How does this change the pre-frost and post-frost price indexes? Explain. Generalize your explanation to how the construction of the market basket affects the price index.Table 7-3 Price
For each of the following events, how would an economist using a 10-year-old market basket create a bias in measuring the change in the cost of living today?a. A typical family owns more cars than it would have a decade ago. Over that time, the average price of a car has increased more than the
The consumer price index in the United States (base period 1982–1984) was 226.229 in 2012 and 229.324 in 2013. Calculate the inflation rate from 2012 to 2013.
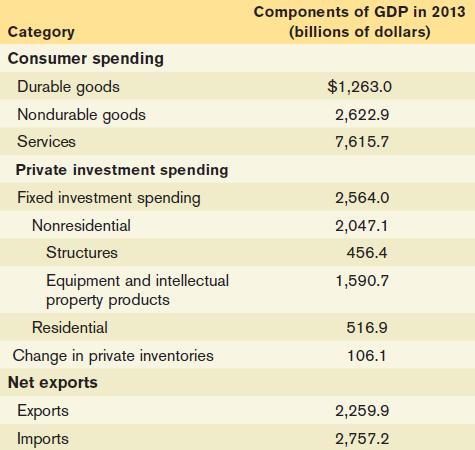
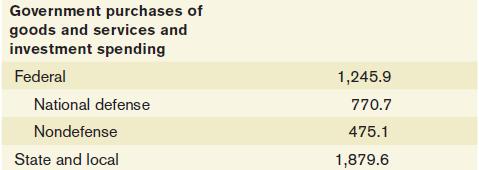
The components of GDP in the accompanying table were produced by the Bureau of Economic Analysis.a. Calculate 2013 consumer spending.b. Calculate 2013 private investment spending.c. Calculate 2013 net exports.d. Calculate 2013 government purchases of goods and services and government investment
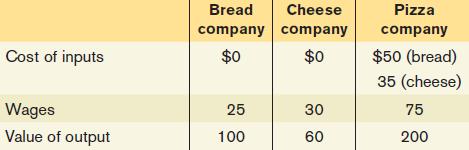
In the economy of Pizzania (from Problem 4), bread and cheese produced are sold both to the pizza company for inputs in the production of pizzas and to consumers as final goods. The accompanying table summarizes the activities of the three companies. Cost of inputs Wages Value of output Bread
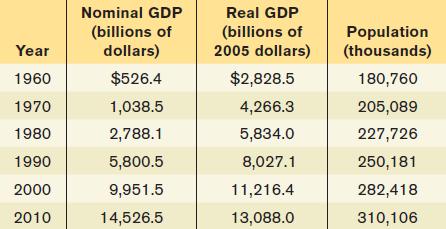
The accompanying table shows data on nominal GDP(in billions of dollars), real GDP (in billions of 2005 dollars), and population (in thousands) of the United States in 1960, 1970, 1980, 1990, 2000, and 2010. The U.S. price level rose consistently over the period 1960–2010.a. Why is real GDP
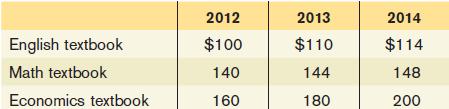
Eastland College is concerned about the rising price of textbooks that students must purchase. To better identify the increase in the price of textbooks, the dean asks you, the Economics Department’s star student, to create an index of textbook prices. The average student purchases three English,
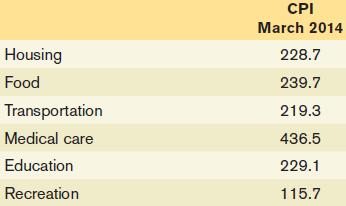
The consumer price index, or CPI, measures the cost of living for a typical urban household by multiplying the price for each category of expenditure (housing, food, and so on) times a measure of the importance of that expenditure in the average consumer’s market basket and summing over all
Go to the Bureau of Labor Statistics home page at www.bls.gov. Place the cursor over the “Economic Releases”tab and then click on “Major Economic Indicators”in the drop-down menu that appears. Once on the“Major Economic Indicators” page, click on “Consumer Price Index.” On that
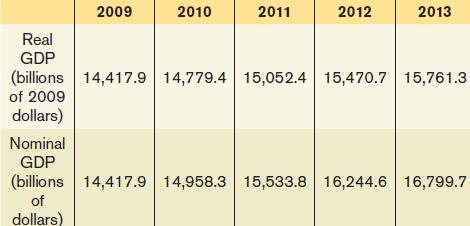
The accompanying table provides the annual real GDP(in billions of 2009 dollars) and nominal GDP (in billions of dollars) for the United States.a. Calculate the GDP deflator for each year.b. Use the GDP deflator to calculate the inflation rate for all years except 2009. 2009 Nominal GDP 2010 2011
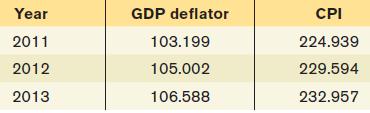
The accompanying table contains two price indexes for the years 2011, 2012, and 2013: the GDP deflator and the CPI. For each price index, calculate the inflation rate from 2011 to 2012 and from 2012 to 2013. Year 2011 2012 2013 GDP deflator 103.199 105.002 106.588 CPI 224.939 229.594 232.957
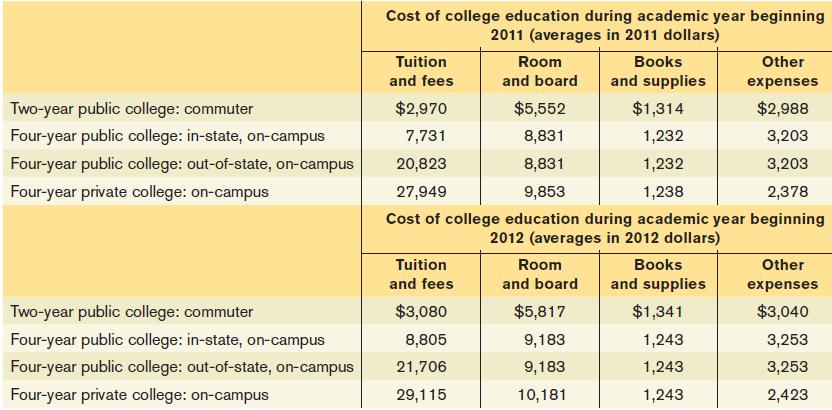
The cost of a college education in the United States is rising at a rate faster than inflation. The following table shows the average cost of a college education in the United States during the academic year that began in 2011 and the academic year that began in 2012 for public and private
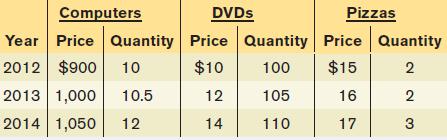
The economy of Britannica produces three goods:computers, DVDs, and pizza. The accompanying table shows the prices and output of the three goods for the years 2012, 2013, and 2014.a. What is the percent change in production of each of the goods from 2012 to 2013 and from 2013 to 2014?b. What is the
Suppose that the advent of employment websites enables job-seekers to find suitable jobs more quickly. What effect will this have on the unemployment rate over time? Also suppose that these websites encourage job-seekers who had given up their searches to begin looking again. What effect will this
Why does collective bargaining have the same general effect on unemployment as a minimum wage? Illustrate your answer with a diagram.
Each month, usually on the first Friday of the month, the Bureau of Labor Statistics releases the Employment Situation Summary for the previous month. Go to www.bls.gov and find the latest report. On the Bureau of Labor Statistics home page, at the top of the page, select the “Subjects” tab,
Part of the information released in the Employment Situation Summary concerns how long individuals have been unemployed. Go to www.bls.gov to find the latest report. Use the same technique as in Problem 1 to find the Employment Situation Summary. Near the end of the Employment Situation, click on
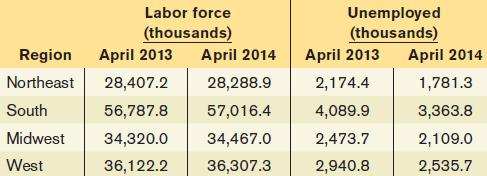
A country’s labor force is the sum of the number of employed and unemployed workers. The accompanying table provides data on the size of the labor force and the number of unemployed workers for different regions of the United States.a. Calculate the number of workers employed in each of the
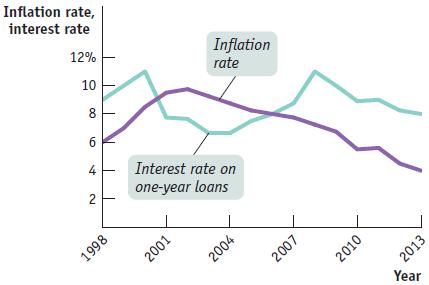
The accompanying diagram shows the interest rate on one-year loans and inflation during 1998–2013 in the economy of Albernia. When would one-year loans have been especially attractive and why? Inflation rate, interest rate 12% 10 8 6 4 2 1998 Inflation rate Interest rate on one-year loans 2001
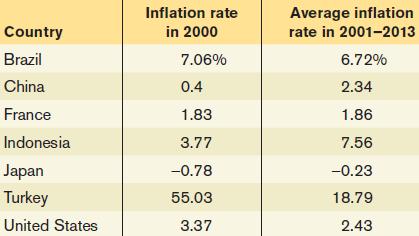
The accompanying table provides the inflation rate in the year 2000 and the average inflation rate over the period 2001–2013 for seven different countries.a. Given the expected relationship between average inflation and menu costs, rank the countries in descending order of menu costs using
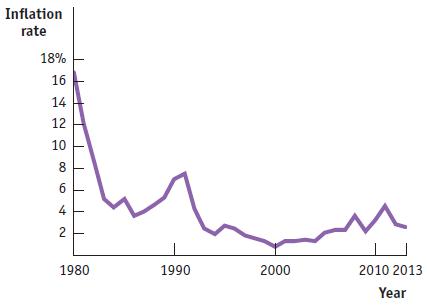
The accompanying diagram shows the inflation rate in WORK IT OUT the United Kingdom from 1980 to 2013.a. Between 1980 and 1985, policy makers in the United Kingdom worked to lower the inflation rate. What would you predict happened to unemployment between 1980 and 1985?b. Policy makers in the
Predict the effect of each of the following events on the growth rate of productivity.a. The amounts of physical and human capital per worker are unchanged, but there is significant technological progress.b. The amount of physical capital per worker grows at a steady pace, but the level of human
Output in the economy of Erewhon has grown 3% per year over the past 30 years.The labor force has grown at 1% per year, and the quantity of physical capital has grown at 4% per year. The average education level hasn’t changed. Estimates by economists say that each 1% increase in physical capital
Multinomics, Inc., is a large company with many offices around the country. It has just adopted a new computer system that will affect virtually every function performed within the company. Why might a period of time pass before employees’productivity is improved by the new computer system? Why
Explain the link between a country’s growth rate, its investment spending as a percent of GDP, and its domestic savings.
U.S. centers of academic biotechnology research have closer connections with private biotechnology companies than do their European counterparts. What effect might this have on the pace of creation and development of new drugs in the United States versus Europe?
During the 1990s in the former Soviet Union a lot of property was seized and controlled by those in power. How might this have affected the country’s growth rate at that time? Explain.
Some economists think the high rates of growth of productivity achieved by many Asian economies cannot be sustained. Why might they be right? What would have to happen for them to be wrong?
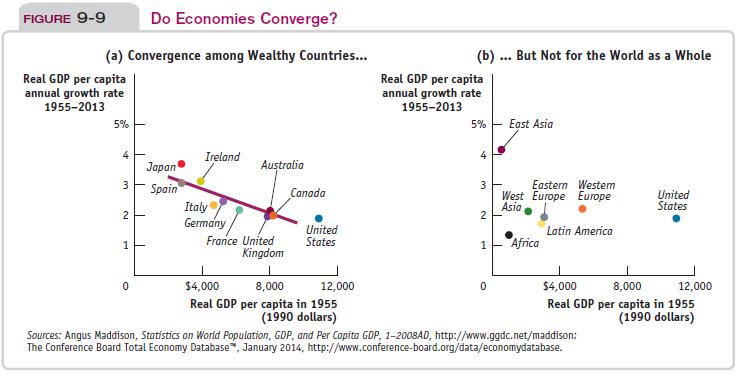
Consider Figure 9-9, panel (b). Based on the data there, which regions support the convergence hypothesis? Which do not? Explain. FIGURE 9-9 Do Economies Converge? (b) But Not for the World as a Whole (a) Convergence among Wealthy Countries... Real GDP per capita annual growth rate 1955-2013 Real
Some economists think the best way to help African countries is for wealthier countries to provide more funds for basic infrastructure. Others think this policy will have no long-run effect unless African countries have the financial and political means to maintain this infrastructure. What
Are economists typically more concerned about the limits to growth imposed by environmental degradation or those imposed by resource scarcity? Explain, noting the role of negative externalities in your answer.
What is the link between greenhouse gas emissions and growth? What is the expected effect on growth from emissions reduction? Why is international burden sharing of greenhouse gas emissions reduction a contentious problem?
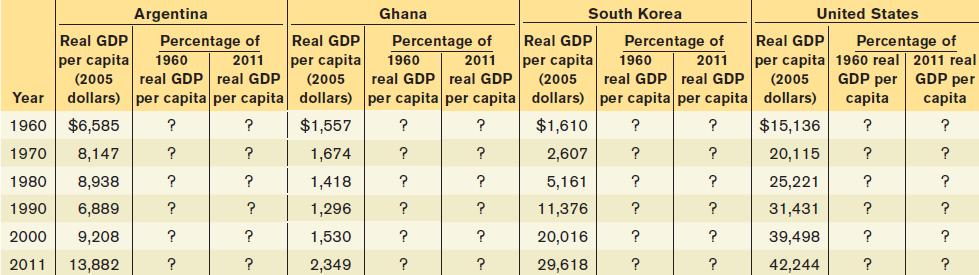
The accompanying table shows data from the Penn World Table, Version 8.0, for real GDP per capita in 2005 U.S. dollars for Argentina, Ghana, South Korea, and the United States for 1960, 1970, 1980, 1990, 2000, and 2011.a. Complete the table by expressing each year’s real GDP per capita as a
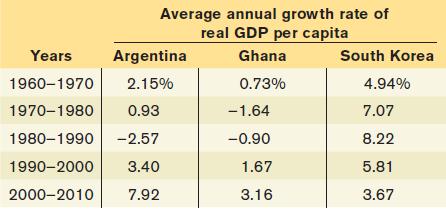
The accompanying table shows the average annual growth rate in real GDP per capita for Argentina, Ghana, and South Korea using data from the Penn World Table, Version 8.0, for the past few decades.a. For each decade and for each country, use the Rule of 70 where possible to calculate how long it
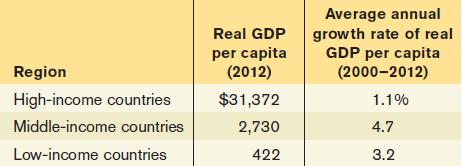
The accompanying table provides approximate statistics on per capita income levels and growth rates for regions defined by income levels. According to the Rule of 70, starting in 2012 the high-income countries are projected to double their per capita GDP in approximately 78 years, in 2088.
The Bureau of Labor Statistics regularly releases the“Productivity and Costs” report for the previous month.Go to www.bls.gov and find the latest report. (On the Bureau of Labor Statistics home page, from the tab “Subjects,” select the link to “Productivity: Labor Productivity & Costs”;
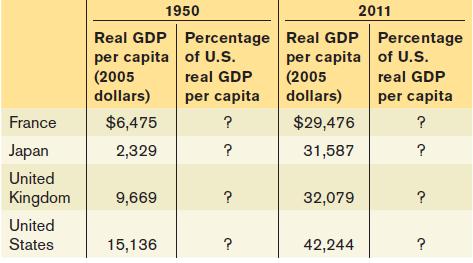
The accompanying table shows data from the Penn World Table, Version 8.0, for real GDP per capita (2005 U.S. dollars) in France, Japan, the United Kingdom, and the United States in 1950 and 2011. Complete the table.Have these countries converged economically? France Japan United Kingdom United
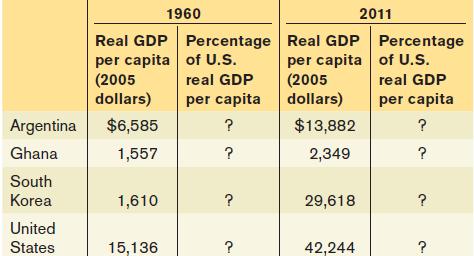
The accompanying table shows data from the Penn World Table, Version 8.0, for real GDP per capita (2005 U.S. dollars) for Argentina, Ghana, South Korea, and the United States in 1960 and 2011. Complete the table.Have these countries converged economically? Argentina Ghana South Korea United States
Why would you expect real GDP per capita in California and Pennsylvania to exhibit convergence but not in California and Baja California, a state of Mexico that borders the United States? What changes would allow California and Baja California to converge?
According to the Oil & Gas Journal, the proven oil reserves existing in the world in 2012 consisted of 1,525 billion barrels. In that year, the U.S. Energy Information Administration reported that the world daily oil production was 75.58 million barrels a day.a. At this rate, for how many years
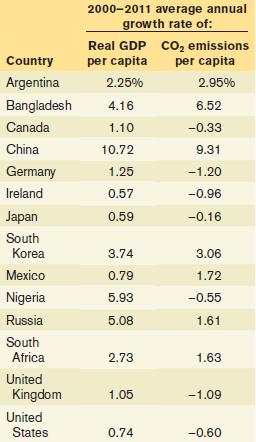
The accompanying table shows the annual growth rate for the years 2000–2011 in per capita emissions of carbon dioxide (CO2) and the annual growth rate in real GDP per capita for selected countries. Country Argentina Bangladesh Canada China Germany Ireland Japan South Korea Mexico Nigeria Russia
Use a diagram of the loanable funds market to illustrate the effect of the following events on the equilibrium interest rate and investment spending.a. An economy is opened to international movements of capital, and a net capital inflow occurs.b. Retired people generally save less than working
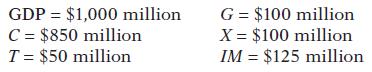
Given the following information about the open economy of Regalia, what is the level of investment spending and private savings, and what are the budget balance and net capital inflow? What is the relationship among the four? There are no government transfers. GDP = $1,000 million C = $850 million
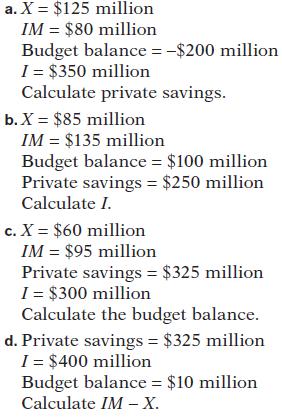
Assume the economy is open to capital inflows and outflows and therefore net capital inflow equals imports(IM) minus exports (X). Answer each of the following questions. a. X = $125 million IM = $80 million Budget balance = -$200 million I = $350 million Calculate private savings. b. X = $85
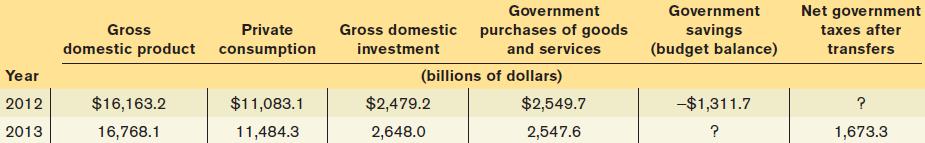
The accompanying table, taken from the National Income and Product Accounts Tables, shows the various components of U.S. GDP in 2012 and 2013 in billions of dollars.a. Complete the table by filling in the missing figures.b. For each year, calculate taxes (after transfers) as a percentage of GDP.c.
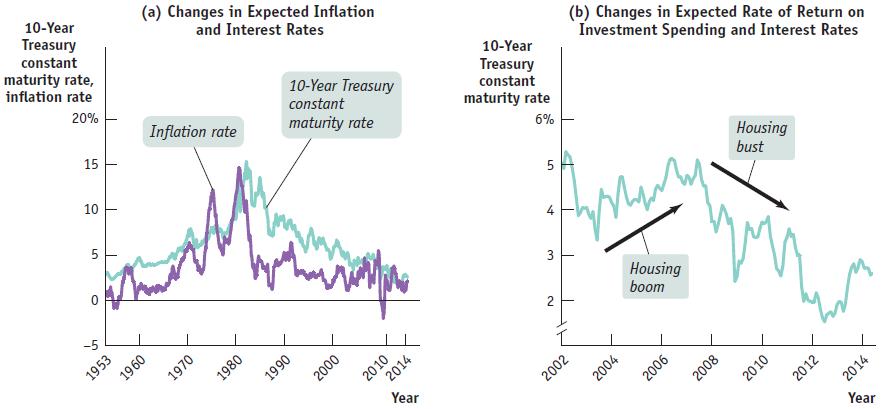
The accompanying diagram shows data for the interest rate on 10-year euro area government bonds and inflation rate for the euro area for 1996 through mid-2014, as reported by the European Central Bank. How would you describe the relationship between the two? How does the pattern compare to that of
Sallie Mae is a quasi-governmental agency that packages individual student loans into pools of loans and sells shares of these pools to investors as Sallie Mae bonds.a. What is this process called? What effect will it have on investors compared to situations in which they could only buy and sell
Assuming that the aggregate price level is constant, the interest rate is fixed, and there are no taxes and no foreign trade, what will be the change in GDP if the following events occur?a. There is an autonomous increase in consumer spending of $25 billion; the marginal propensity to consume is
The Bureau of Economic Analysis reported that, in real terms, overall consumer spending increased by$66.2 billion during the second quarter of 2014.a. If the marginal propensity to consume is 0.52, by how much will real GDP change in response?b. If there are no other changes to autonomous spending
During the early 2000s, the Case–Shiller U.S. Home Price Index, a measure of average home prices, rose continuously until it peaked in March 2006. From March 2006 to May 2009, the index lost 32% of its value.Meanwhile, the stock market experienced similar ups and downs. From March 2003 to October
How will planned investment spending change as the following events occur?a. The interest rate falls as a result of Federal Reserve policy.b. The U.S. Environmental Protection Agency decrees that corporations must upgrade or replace their machinery in order to reduce their emissions of sulfur
Explain how each of the following actions will affect the level of planned investment spending and unplanned inventory investment. Assume the economy is initially in income–expenditure equilibrium.a. The Federal Reserve raises the interest rate.b. There is a rise in the expected growth rate of
The U.S. economy slowed significantly in early 2008, and policy makers were extremely concerned about growth. To boost the economy, Congress passed several relief packages (the Economic Stimulus Act of 2008 and the American Recovery and Reinvestment Act of 2009) that combined would deliver about
Describe the short-run effects of each of the following shocks on the aggregate price level and on aggregate output.a. The government sharply increases the minimum wage, raising the wages of many workers.b. Solar energy firms launch a major program of investment spending.c. Congress raises taxes
A rise in productivity increases potential output, but some worry that demand for the additional output will be insufficient even in the long run. How would you respond?
A fall in the value of the dollar against other currencies makes U.S. final goods and services cheaper to foreigners even though the U.S. aggregate price level stays the same. As a result, foreigners demand more American aggregate output. Your study partner says that this represents a movement down
The Conference Board publishes the Consumer Confidence Index (CCI) every month based on a survey of 5,000 representative U.S. households. It is used by many economists to track the state of the economy.A press release by the Board on June 28, 2011, stated:“The Conference Board Consumer Confidence
There were two major shocks to the U.S. economy in 2007, leading to the severe recession of 2007–2009. One shock was related to oil prices; the other was the slump in the housing market. This question analyzes the effect of these two shocks on GDP using the AD–AS framework.a. Draw typical
The late 1990s in the United States were characterized by substantial economic growth with low inflation;that is, real GDP increased with little, if any, increase in the aggregate price level. Explain this experience using aggregate demand and aggregate supply curves.Illustrate with a diagram.
In each of the following cases, in the short run, determine whether the events cause a shift of a curve or a movement along a curve. Determine which curve is involved and the direction of the change.a. As a result of an increase in the value of the dollar in relation to other currencies, American
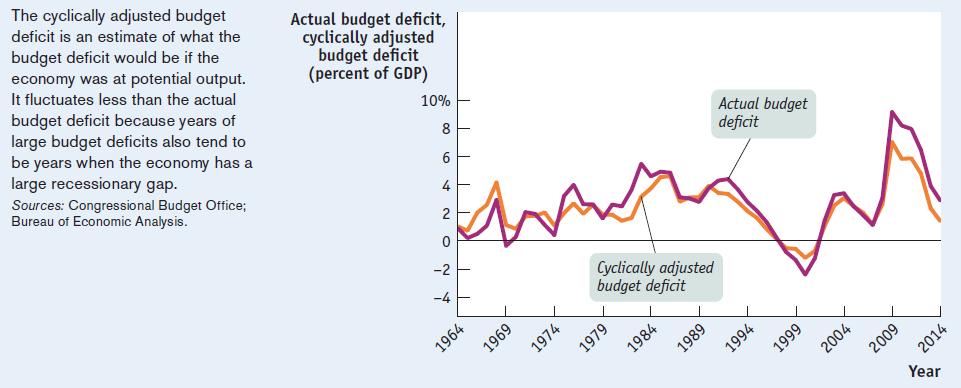
Figure 13-10 shows the actual budget deficit and the cyclically adjusted budget deficit as a percentage of GDP in the United States from 1970 to 2014. Assuming that potential output was unchanged, use this figure to determine which of the years from 1990 to 2013 the government used expansionary
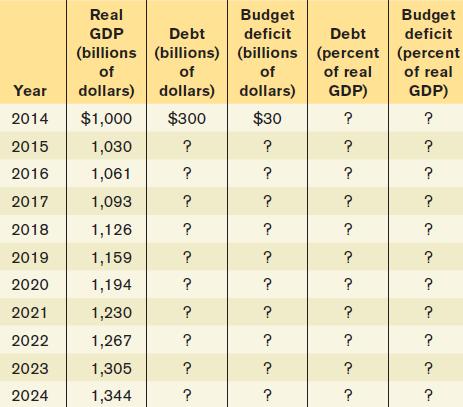
In 2014, the policy makers of the economy of Eastlandia projected the debt–GDP ratio and the ratio of the budget deficit to GDP for the economy for the next 10 years under different scenarios for growth in the government’s deficit. Real GDP is currently $1,000 billion per year and is expected
How did or would the following affect the current public debt and implicit liabilities of the U.S. government?a. In 2003, Congress passed and President Bush signed the Medicare Modernization Act, which provides seniors and individuals with disabilities with a prescription drug benefit. Some of the
Unlike households, governments are often able to sustain large debts. For example, in 2013, the U.S. government’s total debt reached $17.3 trillion, approximately equal to 101.6% of GDP. At the time, according to the U.S. Treasury, the average interest rate paid by the government on its debt was
Assume that total reserves are equal to $200 and total checkable bank deposits are equal to $1,000. Also assume that the public does not hold any currency. Now suppose that the required reserve ratio falls from 20% to 10%. Trace out how this leads to an expansion in bank deposits.
Take the example of Silas depositing his $1,000 in cash into First Street Bank and assume that the required reserve ratio is 10%. But now assume that each time someone receives a bank loan, he or she keeps half the loan in cash. Trace out the resulting expansion in the money supply.
Assume that any money lent by a bank is always deposited back in the banking system as a checkable deposit and that the reserve ratio is 10%. Trace out the effects of a $100 million open-market purchase of U.S. Treasury bills by the Fed on the value of checkable bank deposits. What is the size of
What are the similarities between the Panic of 1907, the S&L crisis, and the crisis of 2008?
Why did the creation of the Federal Reserve fail to prevent the bank runs of the Great Depression? What measures stopped the bank runs?
Describe the balance sheet effect. Describe the vicious cycle of deleveraging. Why is it necessary for the government to step in to halt a vicious cycle of deleveraging?
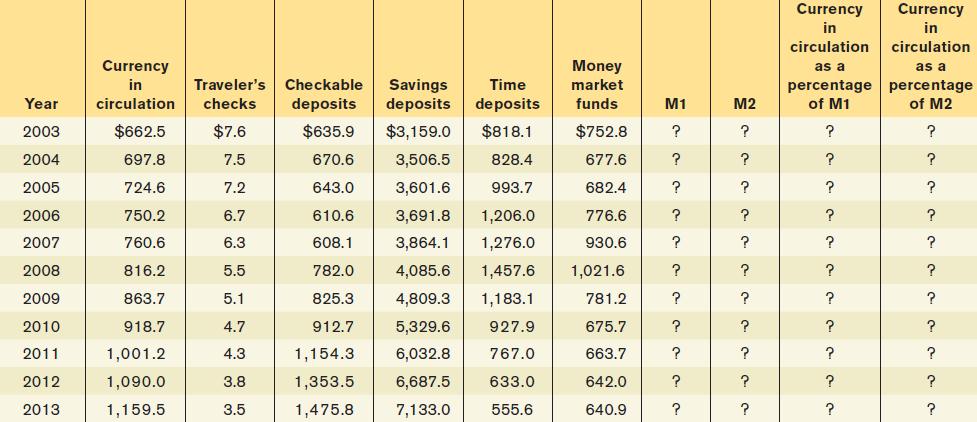
The following table shows the components of M1 and M2 in billions of dollars for the month of December in the years 2003 to 2013 reported by the Federal Reserve Bank of St. Louis. Complete the table by calculating M1, M2, currency in circulation as a percentage of M1, and currency in circulation as
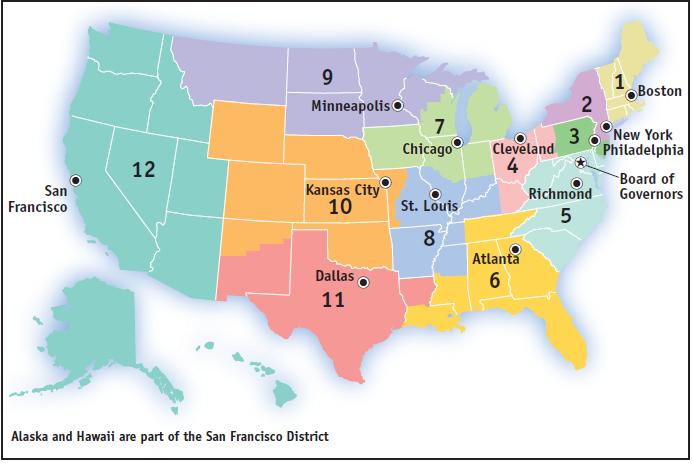
Using Figure 14-6, find the Federal Reserve district in which you live. Go to www.federalreserve.gov/bios/pres.htm and click on your district to identify the president of the Federal Reserve Bank in your district. Go to www.federalreserve.gov/fomc/ and determine if the president of the regional
The Congressional Research Service estimates that at least $45 million of counterfeit U.S. $100 notes produced by the North Korean government are in circulation.a. Why do U.S. taxpayers lose because of North Korea’s counterfeiting?b. As of December 2014, the interest rate earned on one-year U.S.
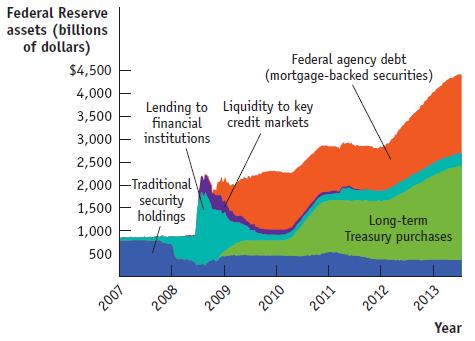
As shown in Figure 14-9, the portion of the Federal Reserve’s assets made up of U.S. Treasury bills has declined since 2007. Go to www.federalreserve.gov.Under “Select Statistical Releases,” click on “View All.”Under the heading “Money Stock and Reserve Balances,”click on “Factors
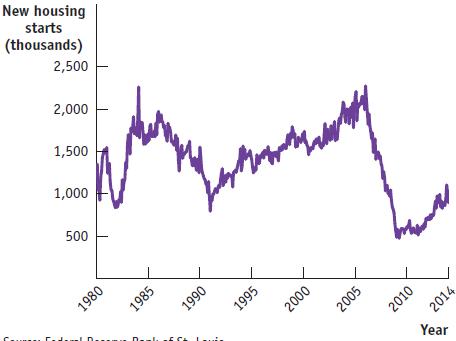
The accompanying figure shows new U.S. housing starts, in thousands of units per month, between January 1980 and January 2014. The graph shows a large drop in new housing starts in 1984–1991 and 2006–2009. New housing starts are related to the availability of mortgages.a. What caused the drop
Show the changes to the T-accounts for the Federal Reserve and for commercial banks when the Federal Reserve buys $50 million in U.S. Treasury bills. If the public holds a fixed amount of currency (so that all loans create an equal amount of deposits in the banking system), the minimum reserve
Explain how each of the following would affect the quantity of money demanded.Does the change cause a movement along the money demand curve or a shift of the money demand curve?a. Short-term interest rates rise from 5% to 30%.b. All prices fall by 10%.c. New wireless technology automatically
Which of the following will increase the opportunity cost of holding cash? Reduce it? Have no effect? Explain.a. Merchants charge a 1% fee on debit/credit card transactions for purchases of less than $50.b. To attract more deposits, banks raise the interest paid on six-month CDs.c. It’s the
Assume that there is an increase in the demand for money at every interest rate.Using a diagram, show what effect this will have on the equilibrium interest rate for a given money supply.
Showing 5700 - 5800
of 7318
First
51
52
53
54
55
56
57
58
59
60
61
62
63
64
65
Last
Step by Step Answers