New Semester
Started
Get
50% OFF
Study Help!
--h --m --s
Claim Now
Question Answers
Textbooks
Find textbooks, questions and answers
Oops, something went wrong!
Change your search query and then try again
S
Books
FREE
Study Help
Expert Questions
Accounting
General Management
Mathematics
Finance
Organizational Behaviour
Law
Physics
Operating System
Management Leadership
Sociology
Programming
Marketing
Database
Computer Network
Economics
Textbooks Solutions
Accounting
Managerial Accounting
Management Leadership
Cost Accounting
Statistics
Business Law
Corporate Finance
Finance
Economics
Auditing
Tutors
Online Tutors
Find a Tutor
Hire a Tutor
Become a Tutor
AI Tutor
AI Study Planner
NEW
Sell Books
Search
Search
Sign In
Register
study help
business
macroeconomics
Macroeconomics Policy And Practice 2nd Edition Frederic Mishkin - Solutions
Go to the St. Louis Federal Reserve FRED database, and find data on the monthly U.S. dollar exchange rates to the Chinese yuan, Canadian dollar, and South Korean won. Download the data onto a spreadsheet.a) Over the most recent five-year period of data available, use the average, max, min, and
Why is a theory of consumption also a theory of saving?
What is the logic behind the intertemporal budget constraint? On what assumptions is it based, and how is its slope interpreted?
What do indifference curves show about current and future consumption? Why do they slope downward? Why are they convex?
Explain how the intertemporal budget constraint and indifference curves are used to derive a consumer’s optimal choice of current and future consumption.
What can shift the intertemporal budget line, IBL? What happens to current and future consumption when IBL shifts occur?
How do changes in the real interest rate affect the IBL and current and future consumption?
How do binding borrowing constraints affect the IBL and current and future consumption?
On what assumptions did Keynes base his theory of consumption? How does his theory relate to intertemporal choice?
What is the permanent income hypothesis? How does its consumption function relate to intertemporal choice?
Describe the life-cycle hypothesis and how it relates to intertemporal choice.
What modifications to the intertemporal choice theory have been suggested by the random walk hypothesis and behavioral economics?
Suppose Prakash has an income today of $30,000, an expected income in period 2 of $35,000, and initial wealth of $5,000. Prakash faces an interest rate of 5%.a) Graph Prakash’s intertemporal budget line. Denote the values of C1 and C2 at the intersection points with the horizontal and vertical
Assume that Maria does not have a preference for smooth consumption. In particular, the average of two consumption points on the same indifference curve yields the same utility to Maria as either point (i.e., the average consumption point is on the same indifference curve as the other two
Describe the effect of an increase in next period’s income on the intertemporal budget constraint. If next year’s income increases by $3,000 and the interest rate is 5%, by how much does the intertemporal budget line shift?
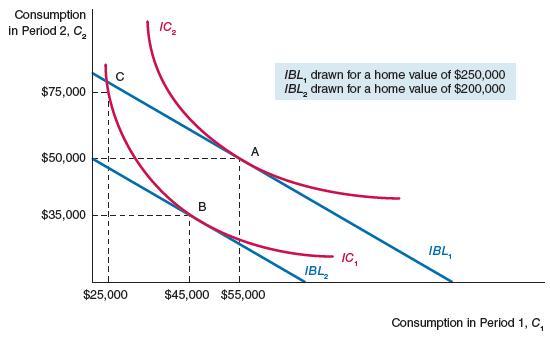
The following figure represents the optimization problem for a homeowner whose home is currently valued at $250,000.a) Identify the optimum consumption point (i.e., what are the values of C1 and C2 at which this individual’s happiness is maximized?).b) If the value of the home decreases to
Describe the effects of a decrease in the interest rate on present and next period’s consumption if the individual is a net lender (i.e., has savings) after period 1 and the substitution effect is larger than the income effect. Show your answer graphically.
Suppose Nicole’s yearly income is $5,000 when she is fifteen, $35,000 when she is twenty-five, and $70,000 when she is fifty (these are all present value measures of future income). Assume that Nicole’s autonomous consumption expenditure is $20,000 and that her marginal propensity to consume is
What does the Keynesian consumption function imply about the average propensity to consume of a rich versus a poor country? Which country should have a higher average propensity to consume?How can you explain the relatively low levels of saving of rich countries?
In May 2010, the size of Greece’s budget deficit increased its probability of default and triggered a crisis across the Eurozone. To decrease the budget deficit, the Greek government proposed many measures. A few of them involved decreasing pension and/or benefits payments to retirees. Use the
For each of the following situations, explain how current consumption will change according to the random walk hypothesis:a) The government increases taxes to close the budget deficit, but the size of the tax increase is smaller than expected.b) You receive your BS degree and find a job that
Previous policies to increase saving in the United States have included fiscal policy measures to exempt a part of individuals’ savings from income taxes (e.g., the creation of IRAs).According to the precepts of behavioral economics, do you think these measures could have a significant impact on
Go to the St. Louis Federal Reserve FRED database, and find data on real personal consumption expenditures (PCECCA) and a measure of real interest rates, the 10-year treasury inflation-indexed security (FII10). Convert the TIIS rate to “Annual” using the frequency setting. Download the data
Go to the St. Louis Federal Reserve FRED database, and find data on disposable personal income (DPI), personal saving (PSAVE), and personal consumption expenditures (PCEC). Download the data onto a spreadsheet.For each quarter, calculate the average propensity to consume, APC, and the average
Go to the St. Louis Federal Reserve FRED database, and find data on the civilian population (CNP16OV) and the civilian population 55 years old and over (LNU00024230). Convert the two population series to “Quarterly” using the frequency setting, and download the data. Create a series and
Go to the St. Louis Federal Reserve FRED database, and find data on the University of Michigan’s consumer sentiment index (UMCSENT) and real personal consumption expenditures (PCECC96). Convert the consumer sentiment index to “Quarterly” using the frequency setting, and download the
Identify and give examples of the three components of investment spending.
What is the user cost of capital? What variables determine this cost, and how does a change in each variable affect it?
Explain how the user cost of capital and the expected marginal product of capital together determine the desired level of capital.
According to the neoclassical theory of investment, how do firms determine their optimal amount of investment spending once they have identified their desired level of capital?
Explain how the desired levels of capital and investment are affected by changes in the expected marginal product of capital, the user cost of capital, and taxes.
Why do firms hold inventories, and why is their inventory investment a matter of interest to macroeconomists?
What is Tobin’s q? How does it provide a theory of investment spending?
How are Tobin’s q theory and the neoclassical theory of investment related?
What kinds of policies has the U.S. government pursued to encourage home ownership, and how do they achieve this goal?
Assume that Luke is considering investing in new equipment and computers for his construction company. The real interest rate is 5%, construction equipment is valued at $600,000, and computers are valued at $20,000. Neither type of capital is expected to change its price during the next year.a)
Using the expression for the expected marginal product of capital, MPKe = 3.6/Kt+1, plot the MPKe curve and determine the desired level of capital for the next period (measured in trillions)if the user cost equals 0.30 (assume the price of capital is normalized to 1.0).
Explain the consequences of each of the following events on the desired level of capital stock for the next period according to the neoclassical theory of investment:a) An autonomous easing of monetary policyb) Increase in the depreciation rate of capitalc) An increase in productivity
Discuss the effect of the investment tax credit implemented in the United States after the global financial crisis. What does empirical evidence suggest about the link between taxes and investment?
One common feature of developing countries is their relatively less-developed financial systems. What are the implications of a less efficient financial system for the level of investment in developing countries?
Oil leaks from offshore drilling platforms in the Gulf of Mexico have resulted in stricter regulations on this type of oil extraction.a) Discuss the effects of such regulations on the user cost of capital.b) Explain the effect of such regulations on the future desired level of capital stock and
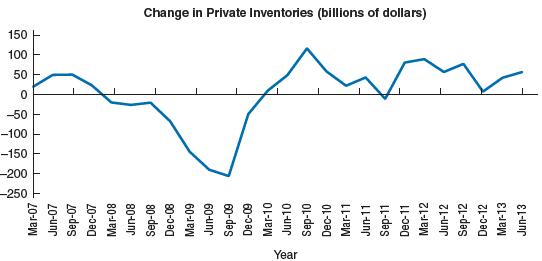
The following graph shows the quarterly change in private inventories in the United States from 2007 to 2010. (Figures are billions of 2005 dollars.) Explain the changes in private inventories during this period. Year Mar-07 Jun-07 Sep-07 Dec-07 Mar-08 Jun-08 Sep-08 Dec-08 Mar-09 Jun-09 Sep-09
From 2009 to 2013, stock prices doubled in the United States. What was the likely effect of this stock market rise on business investment in the United States? Explain using Tobin’s q theory.
A relatively recent trend in most developed countries, including the United States, is the creation of single-person households. Discuss the short- and long-run consequences of this trend on residential investment.
The Federal Reserve has promised that at some future date, it will raise interest rates as part of its “exit strategy” from the expansionary monetary policy it pursued in the aftermath of the global financial crisis. What will be the impact of this “exit strategy” on residential investment?
Go to the St. Louis Federal Reserve FRED database, and find data on real private domestic investment (GPDIC96), real residential investment (PRFIC96), and real non-residential (business) fixed investment (PNFIC96).a) Using these data, calculate inventory investment for the most recent quarter of
Go to the St. Louis Federal Reserve FRED database, and find data on net domestic investment (A557RC1Q027SBEA) and gross domestic investment (W170RC1Q027SBEA).a) For each series, report the values for the most recent quarter of data available. Why are the values not equal?Comment on the relative
Go to the St. Louis Federal Reserve FRED database, and find data on the 30-year mortgage rate (MORTG), private residential fixed investment (PRFI), and the net percentage of bankers tightening credit standards on mortgages (DRTSPM). For the mortgage rate series, convert the data to “Quarterly”
What is the employment ratio? What notable trends in this ratio have occurred over the past fifty years?
Why is the quantity of labor demanded inversely related to the real wage rate?
Is the quantity of labor supplied inversely related to the real wage rate? Why or why not?
Identify three things that can change labor demand or supply and reduce employment.How would each of these affect real wages?
What are the three categories of employment status? What movement between categories results from the existence of discouraged workers?
What is frictional unemployment? Why can it be beneficial for workers, firms, and the economy?
Why does structural unemployment occur?
Why does real wage rigidity contribute to unemployment? What are its causes?
What is the natural rate of unemployment? What has caused the natural rate to change over time?
Assume that the marginal product of labor is MPL = 0.65 × $13/L, where output is measured in trillions and L is the number of workers(in millions).a) Draw the MPL curve.b) Find the quantity of workers demanded if the real wage is $50,000 per worker.
Anthony currently earns $25 an hour and works forty hours a week. When his boss offers to pay him $28 per hour, Anthony decides to accept the offer and also decides to keep working forty hours. What is the effect of Anthony’s decision on the labor supply curve?
Using a graph, analyze the effect of technological advances that have increased workers’productivity in the last few decades (e.g., the Internet) on the labor market. What will be the effect on the real wage and employment if the supply curve does not shift?
Using a graph, analyze the effect of a recession and an increase in day care costs on the real wage and employment.
For each of the following situations, explain how the labor force and the unemployment rate change.a) An individual quits his or her job and does not look for a job anymore.b) An individual who was not in the labor force now decides to look for a job.
During recessions, it becomes increasingly difficult to find a job. How do you think the number of “discouraged workers” would be affected by a recession?
Discuss the effects of the Internet on frictional unemployment. How do you think websites that allow employees to search for job opportunities more efficiently impact frictional unemployment?
Suppose a country is rapidly making the transition from an agricultural-based economy to an economy in which most of GDP comes from manufacturing.a) How do you think structural unemployment will be affected?b) Can you think of any measure the government might undertake to affect structural
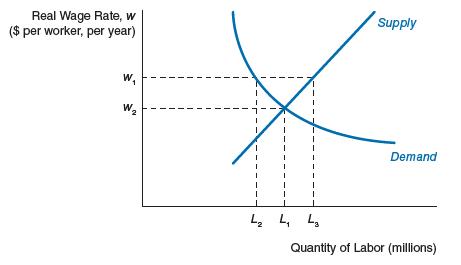
The following graph represents the labor market of a given country. Assuming the prevailing real wage is w1,a) measure unemployment using the graph.b) list three factors that might prevent this market from clearing. Real Wage Rate, w ($ per worker, per year) W W 2 T 1 L L L Supply Demand Quantity
The natural rate of unemployment is higher in France than in the United States. Suppose you are a recent college graduate and you are eager to find a job. Which country’s labor market seems more promising to you? Can you identify the trade-off between a higher natural rate of unemployment and a
Go to the St. Louis Federal Reserve FRED database, and find data on civilian employment (CE16OV) and a measure of real wages in the non-farm business sector (COMPRNFB). Convert the employment measure to “Quarterly” using the frequency setting, and download the data.a) Calculate the percentage
Go to the St. Louis Federal Reserve FRED database, and find data on civilian employment (CE16OV), unemployed (UNEMPLOY), and not in the labor force (LNS15000000).a) Using the most recent data available, calculate the labor force, the working-age population, and the labor force participation rate.b)
Go to the St. Louis Federal Reserve FRED database, and find data on labor force participation and the unemployment rate for the groups listed below. For each pair of demographic groups, calculate the difference in labor force participation and the difference in the unemployment rate between the two
Go to the St. Louis Federal Reserve FRED database, and find data on the civilian unemployment rate (UNRATE) and a measure of the natural rate of unemployment (NROU).a) Calculate the cyclical unemployment rate for the most recent month available, and for one and two years prior.b) Given the changes
How does the theory of rational expectations differ from that of adaptive expectations?
What is the significance of the Lucas critique of econometric policy evaluation?
What is the time-inconsistency problem, and what role does it play in the debate between advocates of discretion and advocates of rules in policy making?
What are the arguments for and against rules?
What benefits does a credible nominal anchor provide?
What has been the general experience of countries that have adopted inflation targeting?
What are the arguments for and against central bank independence?
Suppose that during the last ten years, Nicole tried to forecast future inflation rates to negotiate her salary. Every year, she used all available information and even incorporated news about the conduct of monetary policy. However, her forecasts were sometimes above and sometimes below the actual
Consider two individuals forming expectations about mortgage rates. Mark forms adaptive expectations, and looks only at past mortgage rates to form expectations about future rates. Gloria forms rational expectations.Suppose an individual who is well known for caring a lot more about unemployment
Immediately after the central bank of New Zealand adopted inflation targeting in 1989, economic growth was low and unemployment increased for some time (until 1992), but later, economic growth resumed and unemployment decreased. Comment on the relationship between inflation targeting and economic
Comment on the impact on the Fed’s credibility of the appointment of a majority of governors who are reluctant to increase interest rates to fight inflation for fears of causing too much unemployment in the short run.
Go to the St. Louis Federal Reserve FRED database, and find data on the personal consumption expenditure price index (PCECTPI). Download the data, then calculate a series for inflation. For each quarter, take the percentage change in the price index from the previous quarter. Multiply by 100 to
Go to the St. Louis Federal Reserve FRED database, and find data on the personal consumption expenditure price index (PCECTPI). Convert the Units setting to “Percent Change from Year Ago” and download the data. Beginning in January 2012, the Fed formally announced a 2% inflation goal over the
Go to the St. Louis Federal Reserve FRED database, and find data on the GDP deflator (GDPDEF) and the price of a barrel of oil (OILPRICE). For the GDP deflator, convert the Units setting to “Percent Change from Year Ago” and download the data.a) Calculate the average percent change in the price
What are the key ideas of the real business cycle model? How does it explain business cycle fluctuations?
How does the real business cycle model explain fluctuations in employment and unemployment?
What objections to the real business cycle model have been raised?
How do new Keynesian ideas about price setting and inflation expectations affect the shortrun aggregate supply curve?
How do new Keynesian ideas about expectations affect the IS and aggregate demand curves?
In the new Keynesian model, what shocks cause business cycle fluctuations? Does it matter whether these shocks are anticipated or unanticipated? Explain.
Compare the traditional Keynesian, new Keynesian, and real business cycle models in terms of expectations, price flexibility, and potential sources of business cycle fluctuations.
How do the traditional Keynesian, new Keynesian, and real business cycle models differ in their analysis of the effects of expansionary policy?
How do the traditional Keynesian, new Keynesian, and real business cycle models differ in their analysis of the effects of antiinflation policy?
How do the traditional, new Keynesian, and real business cycle models differ in their views about the efficacy of discretionary policy?
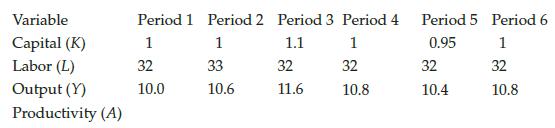
Assume the following production function: Yt = AKt0.4Lt0.6. The capital stock and output are measured in trillions of dollars, and the labor stock is measured in millions of people.a) Using the value of output and the capital and labor stocks, calculate the Solow residual (productivity, A) and its
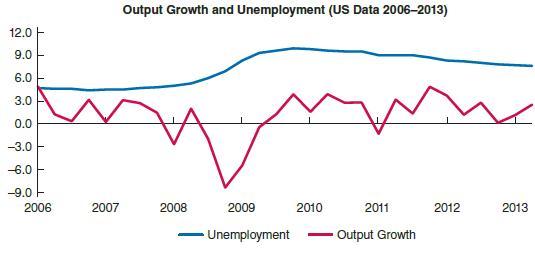
The graph shown below is based on quarterly data on unemployment and real output growth in the United States between 2006 (q1) and 2013 (q2). Are these data consistent with the real business cycle theory hypothesis regarding the relationship between output and unemployment? 12.0 9.0 6.0 3.0 0.0
The Bureau of Labor Statistics (BLS) tracks the numbers of workers who are employed part-time for economic reasons. The number typically increases sharply at the beginnings of recessions and gradually declines at the ends of recessions. Is this behavior consistent with the real business cycle
Using a graphical representation of the new Keynesian model, describe the effects of an unanticipated negative demand shock (label this equilibrium as point 2). Compare these effects to those of an anticipated negative demand shock (label this equilibrium as point 3).
Suppose consumer confidence surges, making consumers more willing to spend. Use the New Keynesian model to describe the effects on output and inflation depending on whether the surge in consumers’ confidence was anticipated or unanticipated.
Showing 6100 - 6200
of 7318
First
55
56
57
58
59
60
61
62
63
64
65
66
67
68
69
Last
Step by Step Answers