New Semester
Started
Get
50% OFF
Study Help!
--h --m --s
Claim Now
Question Answers
Textbooks
Find textbooks, questions and answers
Oops, something went wrong!
Change your search query and then try again
S
Books
FREE
Study Help
Expert Questions
Accounting
General Management
Mathematics
Finance
Organizational Behaviour
Law
Physics
Operating System
Management Leadership
Sociology
Programming
Marketing
Database
Computer Network
Economics
Textbooks Solutions
Accounting
Managerial Accounting
Management Leadership
Cost Accounting
Statistics
Business Law
Corporate Finance
Finance
Economics
Auditing
Tutors
Online Tutors
Find a Tutor
Hire a Tutor
Become a Tutor
AI Tutor
AI Study Planner
NEW
Sell Books
Search
Search
Sign In
Register
study help
business
macroeconomics principles
Principles of Macroeconomics 12th edition Karl E. Case, Ray C. Fair, Sharon E. Oster - Solutions
Canada is the largest trading partner for the United States. In 2014, U.S. exports to Canada were more than $312 billion and imports from Canada totaled more than $347 billion. On January 1, 2014, the exchange rate between the Canadian dollar and the U.S. dollar was 1.06 Canadian dollars = 1 U.S.
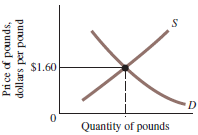
Suppose the exchange rate between the British pound and the U.S. dollar is £1 = $1.50.a. Draw a graph showing the demand and supply of pounds for dollars.b. If the Bank of England implements a contractionary monetary policy, explain what will happen to the exchange rate between the pound and the
Suppose the exchange rate between the Danish krone and the U.S. dollar is 7 DKK = $1 and the exchange rate between the Chilean peso and the U.S. dollar is 650 CLP = $1. a. Express both of these exchange rates in terms of dollars per unit of the foreign currency.b. What should the exchange
The United States is the second-largest oil importer in the world (just recently surpassed by China), importing an average of 5 million barrels of crude oil per day in 2014. Go to www.inflationdata.com to look up crude oil prices for the past 5 years; then go to www.bea.gov to look up the U.S. net
Suppose the following graph shows what prevailed on the foreign exchange market in 2015 with floating exchange rates.a. Name three phenomena that might shift the demand curve to the right.b. Which, if any, of these three phenomena might cause a simultaneous shift of the supply curve to the
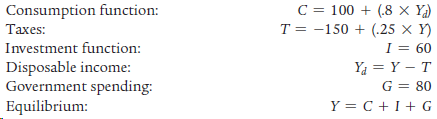
You are given the following model that describes the economy of Hypothetica. (1) Consumption function: C = 80 + 0.75Yd(2) Planned investment: I = 49(3) Government spending: G = 60(4) Exports: EX = 20(5) Imports: IM = 0.05Yd(6) Disposable income: Yd = Y - T(7) Taxes: T = 20(8) Planned aggregate
What effect will each of the following events have on the current account balance and the exchange rate if the exchange rate is fixed? if the exchange rate is floating? a. The U.S. government cuts taxes and income rises.b. The U.S. inflation rate increases, and prices in the United States
The exchange rate between the U.S. dollar and the Japanese yen is floating freely—both governments do not intervene in the market for each currency. Suppose a large trade deficit with Japan prompts the United States to impose quotas on certain Japanese products imported into the United States
Obtain a recent issue of The Economist. Turn to the section titled “Financial Indicators.” Look at the table titled “Trade, exchange rates and budgets.” Which country had the largest trade deficit over the last year and during the last month? Which country had the largest trade surplus over
Evaluate the following statement: If lower exchange rates increase a nation’s exports, the government should do everything in its power to ensure that the exchange rate for its currency is as low as possible.
The nation of Pixley has an absolute advantage in everything it produces compared to the nation of Hooterville. Could these two nations still benefit by trading with each other? Explain.
In 2015, the United States and Cuba re-established diplomatic relations, reopening embassies in each other’s capitals for the first time since 1961. Since the early 1960s, the United States has had an embargo in place on Cuba, virtually eliminating all trade between the two countries. With
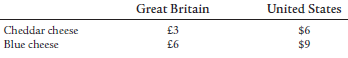
Great Britain and the United States produce cheddar cheese and blue cheese. Current domestic prices per pound for each type of cheese are given in the following table:Suppose the exchange rate is £1 = $1.a. If the price ratios within each country reflect resource use, which country has a
Refer to the previous problem. Assume the market is opened to trade and Indonesia still enters the market by pricing coal at $40 per ton. But as a response to complaints from domestic coal producers, instead of imposing a $10 per ton tariff, the government imposes an import quota of 90 million tons
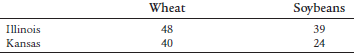
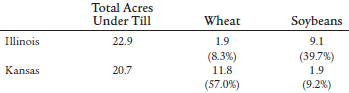
The following table gives recent figures for yield per acre in Illinois and Kansas:a. If we assume that farmers in Illinois and Kansas use the same amount of labor, capital, and fertilizer, which state has an absolute advantage in wheat production? soybean production?b. If we transfer land out of
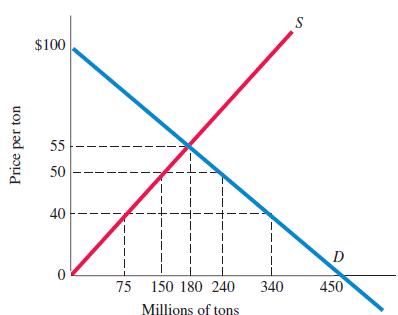
The following graph represents the domestic supply and demand for coal.a. In the absence of trade, what is the equilibrium price and equilibrium quantity?b. The government opens the market to free trade, and Indonesia enters the market, pricing coal at $40 per ton. What will happen to the domestic
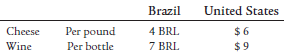
The United States and Brazil each produce only cheese and wine. Domestic prices are given in the following table:On April 1, the London exchange listed an exchange rate of $1 = 1BRL.a. Which country has an absolute advantage in the production of cheese? wine?b. Which country has a comparative
When a president presents a trade agreement for ratification to Congress, many domestic industries fight the ratification. In 2005, the United States was negotiating the Central America-Dominican Republic Free Trade Agreement (CAFTA-DR). Write a brief essay on the U.S. political opposition to
As is stated in the text, NAFTA was ratified by the U.S. Congress in 1993 and went into effect on January 1, 1994, and aside from a few tariffs, all of NAFTA’s commitments werefully implemented by 2003. Go to http://www.usa.gov and do a search for “NAFTA: A Decade of Success” to find a
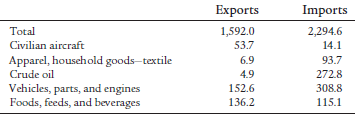
The following table shows imports and exports of goods during 2013 for the United States:What, if anything, can you conclude about the comparative advantage that the United States has relative to its trading partners in the production of goods? What stories can you tell about the wide disparities
Suppose Latvia and Estonia each produce only two goods, tractors and bobsleds. Both are produced using labor alone. Assuming both countries are at full employment, you are given the following information: Latvia: 12 units of labor required to produce 1 tractor 4 units of labor required to
In terms of value of imports and exports, the top five trading partners for the United States are Canada, China, Mexico, Japan, and Germany. Go to www.bea.gov and search for “U.S. Trade in Goods and Services by Selected Countries and Areas.” Find the total value of exports, imports, and the
Assume people and firms have rational expectations. Explain how each of the following events will affect aggregate output and the price level.a. The Fed announces it will increase the required reserve ratio.b. Congress unexpectedly passes a bill that will immediately decrease taxes.c. The Fed
If households and firms have rational expectations, is it possible for the unemployment rate to exceed the natural rate of unemployment? Explain.
The economy of Borealis is represented by the following Lucas supply function: Y = 750 + 50(P - Pe). The current price level in Borealis is 1.45, and the expected price level is 1.70.a. What will be the new level of real output if inflation expectations are correct?b. What will be the new level of
In a hypothetical economy, there is a simple proportional tax on wages imposed at a rate t. There are plenty of jobs around, so if people enter the labor force, they can find work. We define total government receipts from the tax as T = t × W × LWhere t = the tax
In the nation of Lower Vicuna, the velocity of money is fairly constant, and in the nation of Upper Vicuna, the velocity of money fluctuates greatly. For which nation would the quantity theory of money better explain changes in nominal GDP? Explain.
In an economy with reasonably flexible prices and wages, full employment is almost always maintained. Explain why that statement is true.
During the 1980 presidential campaign, Ronald Reagan promised to cut taxes, increase expenditures on national defense, and balance the budget. During the New Hampshire primary of 1980, George Bush called this policy “voodoo economics.” The two men were arguing about the relative merits of
The following is data from 2015 for the tiny island nation of Coco Loco: money supply = $800 million; price level = 3.2; velocity of money = 3. Use the quantity theory of money to answer the following questions. a. What is the value of real output (income) in 2015?b. What is the value of
You are a monetarist given the following information:The money supply is $1 million. The velocity of money is 4. What is nominal income? real income? What happens to nominal income if the money supply is doubled? What happens to real income?
The following data is for the small, recently independent island nation of Hibiscus:Tax rate: 10% flat tax on all citizens since its independence in 2010Labor supply: 200 workers in 2010, and has grown by 3 percent each successive yearInflation rate: Has fluctuated between 2 percent and 3 percent
Suppose you are thinking about where to live after you finish your degree. You discover that an apartment building near your new job has identical units—one is for rent and the other for sale as a condominium. Given your salary, both are affordable and you like them. Would you buy or rent? How
In 2000, a well-known economist was heard to say, “The problem with supply-side economics is that when you cut taxes, they have both supply and demand side effects and you cannot separate the effects.” Explain this comment. Be specific and use the 1997 tax cuts or the Reagan tax cuts of 1981 as
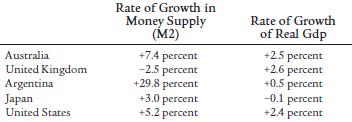
The table gives estimates of the rate of the M2 money supply growth and the rate of real GDP growth for five countries in 2014:a. If you were a monetarist, what would you predict about the rate of inflation across the five countries?b. If you were a Keynesian and assuming activist central banks,
Use aggregate supply and aggregate demand curves to show the predictions of Keynesian economic theory of the likely effects of a major tax cut when the economy is not operating at capacity and the Fed accommodates by increasing the money supply. Explain what happens to the level of real GDP and to
One source of long-run economic growth is an increase in the quality of labor, or human capital, of which education plays a major role. Go to www.bls.gov and look up the current unemployment rate. Compare this to the current unemployment rates for those without a high school diploma, those with
How do each of the following relate to the rates of productivity and growth in an economy?a. Spending on research and developmentb. Government regulationc. Changes in human capitald. Output per worker houre. Embodied technical changef. Disembodied technical change
According to the Bureau of Labor Statistics, during the first quarter of 2015 nonfarm business productivity in the United States fell 3.1 percent and manufacturing productivity fell 1.0 percent compared to the first quarter of 2014. During this same time, real GDP in the United States increased by
Why can growth lead to a more unequal distribution of income? By assuming this is true, how is it possible for the poor to benefit from economic growth?
Economists generally agree that high budget deficits today will reduce the growth rate of the economy in the future. Why? Do the reasons for the high budget deficit matter? In other words, does it matter whether the deficit is caused by lower taxes, increased defense spending, more job-training
In a March 2013 press release, the World Bank announced its support to assist Indonesia in accelerating its economic growth through the Research and Innovation in Science and Technology Project (RISET). This project is designed to boost research and innovation in Indonesia and assist the country in
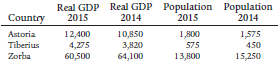
Use the data in the following table to explain what happened with respect to economic growth and the standard of living in each of the three countries. Real GDP Real GDP Population Population 2014 1,575 450 15,250 2015 2014 10,850 3,820 64,100 2015 1,800 575 13,800 Country Astoria Tiberius 12,400
In the fall of 2005, the president’s tax reform commission issued a final report. The commission called for a general cut in marginal tax rates; lower tax rates on dividends, capital gains, and interest income; and, more importantly, the expensing of investment in capital equipment. These
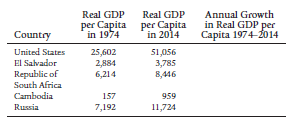
The data in the following table represents real GDP per capita in 1974 and 2014 for five countries. Fill in the table by calculating the annual growth rate in real GDP per capita from 1974 to 2014. Is the data in the completed table consistent with convergence theory? Explain.Convergence theory,
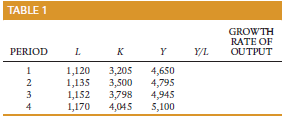
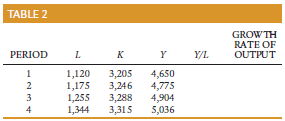
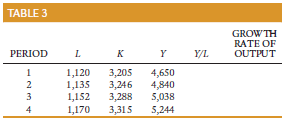
Tables 1, 2, and 3 that follow present some data on three hypothetical economies. Complete the tables by figuring the measured productivity of labor and the rate of output growth. What do the data tell you about the causes of economic growth? (How fast are L and K growing?) TABLE 1 GROWTH RATE OF
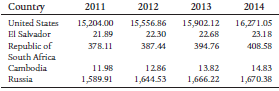
The data in the following table represents real GDP from 2011€“2014 for five countries.a. Calculate the growth rate in real GDP for all five countries from 2011€“2012. Which country experienced the highest rate of economic growth from 2011€“2012?b. Calculate the growth
From 2005 through 2014, Mexico’s per-capita real GDP increased from $8,966 to $9,938 as measured in 2010 U.S. dollars, yet despite this increase in the standard of living, environmental issues such as air and water pollution continue to be major concerns for the country. In 2012, the U.S.
One way that less developed countries catch up with the growth of the more developed countries is by adopting the technology of the developed countries. On average, however, developed countries are capital-rich and laborshort relative to the developing nations. Think of the kinds of technology that
Explain why a household’s consumption and labor supply decisions are interdependent. What impact does this interdependence have on the way in which consumption and income are related?
From March 2007 to May 2009, the price of houses decreased dramatically in many parts of the country.a. What impact would you expect decreases and increases in home values to have on the consumption behavior of home owners? Explain.b. In what ways might events in the housing market have influenced
Graph the following two consumption functions:(1) C = 500 + 0.8 Y(2) C = 0.8 Ya. For each function, calculate and graph the average propensity to consume (APC) when income is $200, $500, and $1,000.b. For each function, what happens to the APC as income rises?c. For each function, what is the
In the short run, the percentage increase in output tends to correspond to a smaller percentage decrease in the unemployment rate as a result of “slippages.” Explain the three slippages between changes in output and changes in the unemployment rate.
On January 1, 2014, the top federal income tax bracket in the United States went from 35 percent to 39.6 percent.Many republicans claimed that lowering the rewards for working (the net after-tax wage rate) would lead to less work effort and a lower labor supply. Proponents of the tax increase
The Bureau of Labor Statistics reported that in June 2010, the unemployment rate in the United States was 9.4 percent. In June 2015, the BLS reported an unemployment rate of 5.3 percent.a. According to Okun’s Law, by how much would GDP need to increase for the unemployment rate to decrease from
Between December 2012 and December 2013, real GDP in the United States increased by 3.18 percent, whereas nonfarm payroll jobs increased by only 1.77 percent. How is it possible for output to increase without a proportional increase in the number of workers?
During 2015, the Federal Reserve Bank discussed the probability of raising interest rates by the end of the year, the first time in over 7 years they will have raised rates.a. What direct effects do higher interest rates have on household and firm behavior? b. One of the consequences of higher
Explain the effect that each of the following situations will have on the size of the multiplier.a. Firms have excess inventories as the economy begins to recover from a recession.b. Expansionary policy causes the price level to increase.c. People expect a $500 tax rebate to be a one-time
If the government implements a spending and tax policy in which it promises to neither increase nor decrease spending and taxes, is it still possible for the budget deficit to increase or decrease? Explain.
Suppose the government decides to decrease spending and increase taxes in an attempt to decrease its deficit. Is it possible for the Fed to ease the macroeconomic effects of the spending and tax changes? Explain.
The Economics in Practice states that since recessions can be hard to forecast, the recognition lag can be long, as was the case with the recession of 2008–2009. Assuming that the recognition lag with regards to this recession was the same for both federal government and Federal
You are given the following information about the economy in 2015 (all in billions of dollars):a. Find equilibrium income. Show that the government budget deficit (the difference between government spending and tax revenues) is $5 billion. b. Congress passes the Foghorn-Leghorn (F-L)
Explain why stabilization policy may be difficult to carry out. How is it possible that stabilization policies can actually be destabilizing?
During 1997, stock markets in Asia collapsed. Hong Kong’s was down nearly 30 percent, Thailand’s was down 62 percent, and Malaysia’s was down 60 percent. Japan and Korea experienced big drops as well. What impacts would these events have on the economies of the countries themselves? Explain
Explain why the government deficit rises as the economy contracts and why the government deficit falls when the economy expands.
Some states are required to balance their budgets. Is this measure stabilizing or destabilizing? Suppose all states were committed to a balanced-budget philosophy and the economy moved into a recession. What effects would this philosophy have on the size of the federal deficit?
In July 2009, the S&P 500 index was at 1,000.What is the S&P 500 index?
How might social, or implicit, contracts result in sticky wages? Use a labor market graph to show the effect of social contracts on wages and on unemployment if the economy enters a recession.
Suppose the inflation–unemployment relationship depicted by the Phillips Curve was stable. Do you think the U.S. trade-off and the Japanese trade-off would be identical? If not, what kinds of factors might make the trade-offs dissimilar?
In which if the following situations will you be best off, and in which will you be worst off, in terms of your real wage? Explain your answer.a. You are offered a 5 percent wage increase and the inflation rate for the year turns out to be 7 percent. b. You are offered a 1 percent wage
How will the following affect labor force participation rates, labor supply, and unemployment? a. In an attempt to get a handle on increasing Social Security shortfalls, Congress and the president decide to raise the Social Security tax on individuals and to cut Social Security payments to
In June 2015, the U.S. unemployment rate dropped to 5.3 percent, its lowest level in more than 7 years. At the same time, inflation remained at a very low level by historical standards. Can you offer an explanation for what seems to be an improved trade-off between inflation and unemployment? What
In 2015, the country of Sorbet was suffering from a period of high unemployment. The new president, Gelato, appointed Sherrie Sherbert as his chief economist. Ms. Sherbert and her staff estimated these supply and demand curves for labor from data obtained from the secretary of labor, Jerry
Using a supply and demand graph for the labor market, explain the classical view that the economy will remain at full employment, even with a decrease in the demand for labor. How will this labor market graph change in the absence of sticky wages?
The following policies have at times been advocated for coping with unemployment. Briefly explain how each might work and explain which type or types of unemployment(frictional, structural, or cyclical) each policy is designed to alter.a. A computer list of job openings and a service that matches
In country A, all wage contracts are indexed to inflation. That is, each month wages are adjusted to reflect increases in the cost of living as reflected in changes in the price level. In country B, there are no cost-of-living adjustments to wages, but the workforce is completely unionized. Unions
By using aggregate supply and aggregate demand curves to illustrate your points, discuss the impacts of the following events on the price level and on equilibrium GDP (Y) in the short run:a. An increase in the money supply with the economy operating at near full capacity b. A decrease in taxes
In Japan during the first half of 2000, the Bank of Japan kept interest rates at a near zero level in an attempt to stimulate demand. In addition, the government passed a substantial increase in government expenditure and cut taxes. Slowly, Japanese GDP began to grow with absolutely no sign of an
Explain the effect, if any, that each of the following occurrences should have on the aggregate demand curve.a. The Fed raises the discount rate.b. The price level increases.c. The federal government decreases federal income tax rates in an effort to stimulate the economy.d. Optimistic firms
Contractionary policies are designed to slow the economy and reduce inflation by decreasing aggregate demand and aggregate output. Explain why contractionary fiscal policy and contractionary monetary policy have opposite effects on the interest rate despite having the same goal of decreasing
Describe what will happen to the interest rate and aggregate output with the implementation of the following policy mixes:a. Expansionary fiscal policy and expansionary monetary policyb. Expansionary fiscal policy and contractionary monetary policyc. Contractionary fiscal policy and expansionary
Use aggregate supply and aggregate demand curves to illustrate the effect the mild monsoon season had on the rice crop in India. Explain what affect this had on the levels of aggregate output and inflation in India.
By late summer 2010, the target federal funds rate was between zero and 0.25 percent. At the same time, “animal spirits” were dormant and there was excess capacity in most industries. That is, businesses were in no mood to build new plant and equipment because many were not using their already
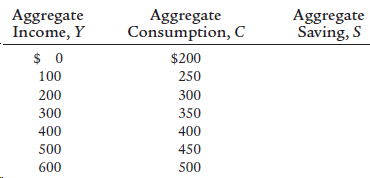
Fill in the aggregate saving column in the following table. Use the data in the table to calculate the consumption function and the saving function, and plot these functions as well as the 45-degree line on a graph. What are the values for the MPC and the MPS? Aggregate Income, Y Aggregate
Evaluate the following statement: In the short run, if an economy experiences inflation of 10 percent, the cause of the inflation is unimportant. Whatever the cause, the only important issue the government needs to be concerned with is the 10 percent increase in the price level.
By using aggregate supply and aggregate demand curves to illustrate your points, discuss the impacts of the following events on the price level and on equilibrium GDP (Y) in the short run:a. A tax cut holding government purchases constant with the economy operating well below full capacityb. An
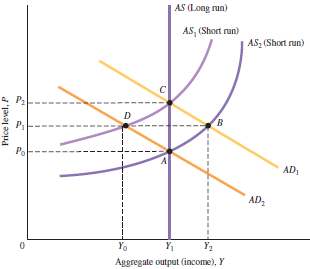
From the following graph, identify the initial equilibrium, the short-run equilibrium, and the long-run equilibrium based on the scenarios below. Explain your answers and identify what happened to the price level and aggregate output.Scenario 1. The economy is initially in long-run equilibrium at
For each of the following scenarios, tell a story and predict the effects on the equilibrium level of aggregate output (Y) and the interest rate (r): a. During 2009, the Federal Reserve was easing monetary policy in an attempt to boost the economy. That same year, Congress passed the American
During the third quarter of 1997, Japanese GDP was falling at a rate of over 11 percent. Many blamed the big increase in Japan’s taxes in the spring of 1997, which was designed to balance the budget. Explain how an increase in taxes with the economy growing slowly could precipitate a recession.
From May 2014 to March 2015, the price of oil dropped sharply on world markets. What impact would you expect there to be on the aggregate price level and on real GDP? Illustrate your answer with aggregate demand and aggregate supply curves. What would you expect to be the effect on interest rates
The Federal Reserve Bank of St. Louis publishes PCE price index data on its Website at: https://research .stlouisfed.org/fred2/categories/9. Go to this Web site and look at the 1-, 5-, and 10-year graphs for both “Personal Consumption Expenditures: Chain-type Price Index” and “Personal
In the first few chapters of this book, we introduced the notion of supply and demand. One of the first things we did was to derive the relationship between the price of a product and the quantity demanded per time period by an individual household. Now we have derived what is called the aggregate
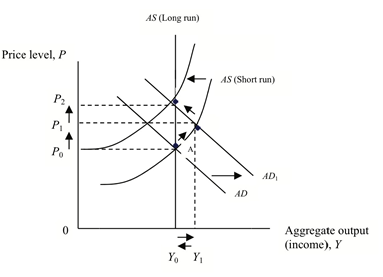
The Economics in Practice describes the simple Keynesian AS curve as one in which there is a maximum level of output given the constraints of a fixed capital stock and a fixed supply of labor. The presumption is that increases in demand when firms are operating below capacity will result in output
The AD curve slopes downward because when the price level is lower, people can afford to buy more and aggregate demand rises. When prices rise, people can afford to buy less and aggregate demand falls. Is this a good explanation of the shape of the AD curve? Why or why not?
Using AS and AD curves to illustrate, describe the effects of the following events on the price level and on equilibrium GDP in the long run assuming that input prices fully adjust to output prices after some lag:a. An increase occurs in the money supply above potential GDPb. GDP is above potential
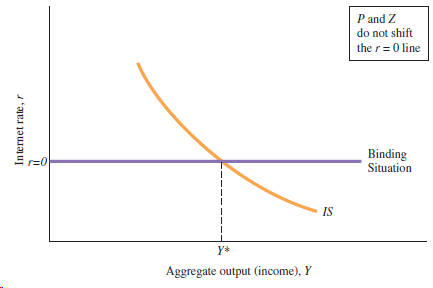
Illustrate each of the following situations with a graph showing the IS curve and the Fed rule, and explain what happens to the equilibrium values of the interest rate and output:a. A decrease in G with the money supply held constant by the Fedb. A decrease in G with the Fed changing Ms by enough
During 1999 and 2000, a debate raged over whether the United States was at or above potential GDP. Some economists feared the economy was operating at a level of output above potential GDP and inflationary pressures were building. They urged the Fed to tighten monetary policy and increase interest
Describe the Fed’s tendency to “lean against the wind.” Do the Fed’s policies tend to stabilize or destabilize the economy?
Two separate capacity constraints are discussed in this chapter: (1) the actual physical capacity of existing plants and equipment, shown as the vertical portion of the short-run AS curve, and (2) potential GDP, leading to a vertical long-run AS curve. Explain the difference between the two. Which
Some economists argue that the €œanimal spirits€ of investors are so important in determining the level of investment in the economy that interest rates do not matter at all. Suppose that this were true, that investment in no way depends on interest rates. a. How would
Showing 5500 - 5600
of 6280
First
49
50
51
52
53
54
55
56
57
58
59
60
61
62
63
Step by Step Answers