New Semester
Started
Get
50% OFF
Study Help!
--h --m --s
Claim Now
Question Answers
Textbooks
Find textbooks, questions and answers
Oops, something went wrong!
Change your search query and then try again
S
Books
FREE
Study Help
Expert Questions
Accounting
General Management
Mathematics
Finance
Organizational Behaviour
Law
Physics
Operating System
Management Leadership
Sociology
Programming
Marketing
Database
Computer Network
Economics
Textbooks Solutions
Accounting
Managerial Accounting
Management Leadership
Cost Accounting
Statistics
Business Law
Corporate Finance
Finance
Economics
Auditing
Tutors
Online Tutors
Find a Tutor
Hire a Tutor
Become a Tutor
AI Tutor
AI Study Planner
NEW
Sell Books
Search
Search
Sign In
Register
study help
business
macroeconomics principles
Macroeconomics 3rd Canadian edition Paul Krugman, Robin Wells, Iris Au, Jack Parkinson - Solutions
Explain the effect on a company’s stock price today of each of the following events, other things held constant.a. The interest rate on bonds falls.b. Several companies in the same sector announce surprisingly higher sales.c. A change in the tax law passed last year reduces this year’s
What are the important types of financial intermediaries in the Canadian economy? What are the primary assets of these intermediaries, and how do they facilitate investment spending and saving?
Suppose that a major city’s main thoroughfare, which is also an interstate highway, will be completely closed to traffic for two years, from January 2014 to December 2015, for reconstruction at a cost of $535 million. If the construction company were to keep the highway open for traffic during
Why would you expect real GDP per capita in Alberta and Saskatchewan to exhibit convergence but not in Alberta and Nova Scotia? What changes would allow Alberta and Nova Scotia to converge?
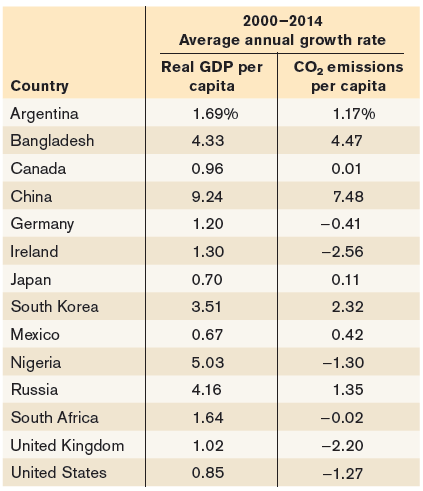
The accompanying table shows the annual growth rate for the years 2000€“2014 in per capita emissions of carbon dioxide (CO2) and the annual growth rate in real GDP per capita for selected countries.Data from: Energy Information Administration; World Bank.a. Rank the countries in terms of
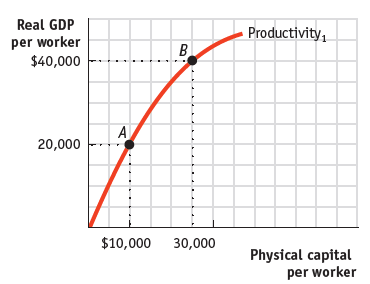
You are hired as an economic consultant to the countries of Albernia and Brittania. Each country€™s current relationship between physical capital per worker and output per worker is given by the curve labeled €œProductivity1€ in the accompanying diagram. Albernia is
Given the following information about the closed economy of Brittania, what is the level of investment spending and private savings, and what is the budget balance? What is the relationship among the three? Is national savings equal to investment spending? There are no government transfers.GDP =
You have won the provincial lottery. There are two ways in which you can receive your prize. You can either have $1 million in cash now, or you can have $1.2 million that is paid out as follows: $300,000 now, $300,000 in one year’s time, $300,000 in two years’ time, and $300,000 in three
Given the following information about the open economy of Regalia, what is the level of investment spending and private savings, and what are the budget balance and net capital inflow? What is the relationship among the four? There are no government transfers. Net capital inflow equals the value of
The drug company Pfizer Canada is considering whether to invest in the development of a new cancer drug. Development will require an initial investment of $10 million now; beginning one year from now, the drug will generate annual profits of $4 million for three years.a. If the interest rate is
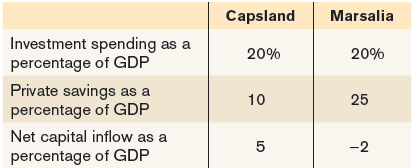
The accompanying table shows the percentage of GDP accounted for by private savings, investment spending, and net capital inflow in the economies of Capsland and Marsalia. Capsland is currently experiencing a positive net capital inflow and Marsalia, a negative net capital inflow. What is the
Suppose CIBC were to package individual car loans into pools of loans and then sell shares of these pools to investors as CIBC car loan bonds. a. What is this process called? What effect will it have on investors compared to situations in which they could only buy and sell individual car
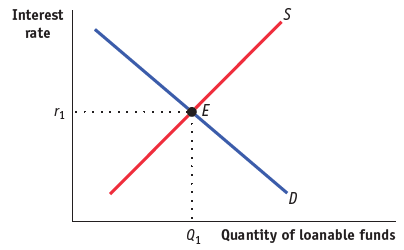
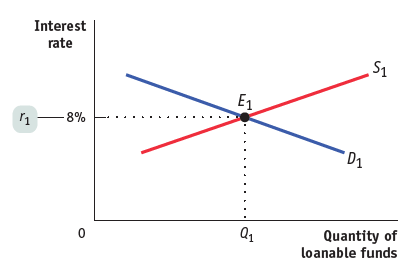
Use the market for loanable funds shown in the accompanying diagram to explain what happens to private savings, private investment spending, and the interest rate if each of the following events occur. Assume that there are no capital inflows or outflows.a. The government reduces the size of its
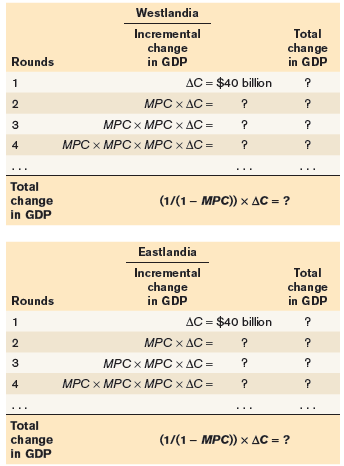
Due to an increase in consumer wealth, there is a $40 billion autonomous increase in consumer spending in the economies of Westlandia and Eastlandia. Assuming that the aggregate price level is constant, the interest rate is fixed in both countries, and there are no taxes and no foreign trade,
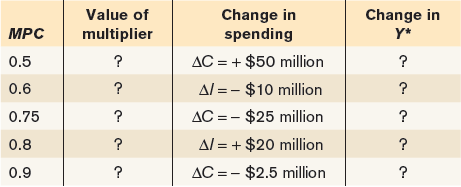
Complete the following table by calculating the value of the multiplier and identifying the change in Y* due to the change in autonomous spending. How does the value of the multiplier change with the marginal propensity to consume? Value of Change in spending Change in MPC multiplier Y* AC = + $50
Statistics Canada reported that in real terms, overall consumer spending increased by $11.3 billion in the first quarter of 2017.a. If the marginal propensity to consume is 0.50, by how much will real GDP change in response?b. If there are no other changes to autonomous spending other than the
Explain how each of the following actions will affect the level of planned investment spending and unplanned inventory investment. Assume the economy is initially in income–expenditure equilibrium.a. The Bank of Canada raises the interest rate.b. There is a rise in the expected growth rate of
In an economy with no government and no foreign sectors, autonomous consumer spending is $250 billion, planned investment spending is $350 billion, and the marginal propensity to consume is 2/3.a. Plot the aggregate consumption function and planned aggregate spending.b. What is unplanned inventory
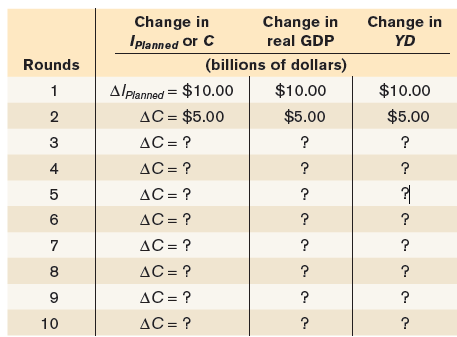
An economy has a marginal propensity to consume of 0.5, and Y*, income€“expenditure equilibrium GDP, equals $500 billion. Given an autonomous increase in planned investment of $10 billion, show the rounds of increased spending that take place by completing the accompanying table. The
Although Ontario has the highest GDP by province in Canada, it also has one of the largest provincial debt in Canada. We often hear that the problem is the province’s low savings rate. Suppose policy makers attempt to rectify this by encouraging greater savings in the economy. What effect will
The Canadian economy slowed significantly in 2008, and policy-makers were extremely concerned about lack of growth. To boost the economy, the House of Commons adopted the Economic Action Plan in January 2009. This plan delivered about $64 billion in additional government spending into the economy.
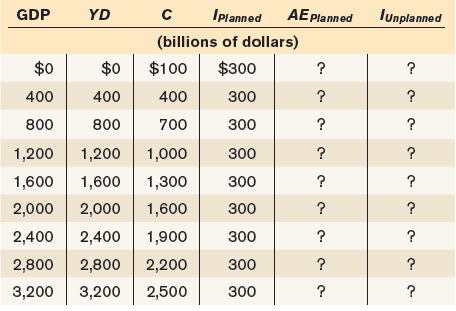
a. The accompanying table shows gross domestic product (GDP), disposable income (YD), consumer spending (C), and planned investment spending (IPlanned) in an economy. Assume there is no government or foreign sector in this economy. Complete the table by calculating planned aggregate spending
A fall in the value of the Canadian dollar against other currencies makes Canadian final goods and services cheaper to foreigners even though the Canadian aggregate price level stays the same. As a result, foreigners demand more Canadian aggregate output. Your study partner says that this
Your study partner is confused by the upward-sloping short-run aggregate supply curve and the vertical long-run aggregate supply curve. How would you explain this?
Suppose that in Wageland all workers sign annual wage contracts each year on January 1. No matter what happens to prices of final goods and services during the year, all workers earn the wage specified in their annual contract. This year, prices of final goods and services fall unexpectedly after
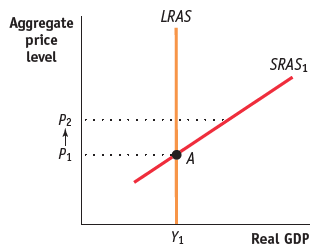
The economy is at point A in the accompanying diagram. Suppose that the aggregate price level rises from P1to P2. How will aggregate supply adjust in the short run and in the long run to the increase in the aggregate price level? Illustrate with a diagram. LRAS Aggregate price level SRAS, P2 P1 Y1
Suppose that all households hold all their wealth in assets that automatically rise in value when the aggregate price level rises (an example of this is what is called an “inflation-indexed bond”—a bond whose interest rate, among other things, changes one-for-one with the inflation rate).
Suppose that the economy is currently at potential output. Also suppose that you are an economic policy maker and that a college economics student asks you to rank, if possible, your most preferred to least preferred type of shock: positive demand shock, negative demand shock, positive supply
Explain whether the following government policies affect the aggregate demand curve or the short-run aggregate supply curve and how.a. The government reduces the minimum nominal wage.b. The government increases the size of payments for the Child Care Benefit (CCB), government transfers to families
In Wageland, all workers sign an annual wage contract each year on January 1. In late January, a new computer operating system is introduced that increases labor productivity dramatically. Explain how Wageland will move from one short-run macroeconomic equilibrium to another. Illustrate with a
The Conference Board of Canada publishes the Index of Consumer Confidence every month based on a survey posed to a sample of Canadian households. Many economists use it to track the state of the economy. A press release by the Board on May 30, 2017, stated: “The Conference Board of Canada’s
The Canadian economy suffered two major shocks in 2008, leading to the severe recession of 2008–2009. One shock was related to oil prices; the other was the slump in the housing market. This question analyzes the effect of these two shocks on GDP using the AD–AS framework.a. Draw typical
Using aggregate demand, short-run aggregate supply, and long-run aggregate supply curves, explain the process by which each of the following economic events will move the economy from one long-run macroeconomic equilibrium to another. Illustrate with diagrams. In each case, what are the short-run
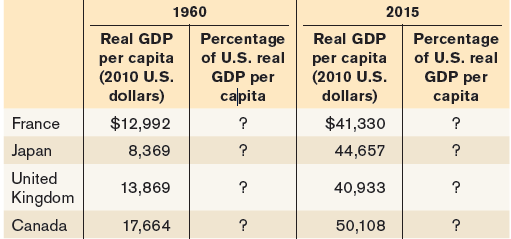
The accompanying table shows data from the World Bank, World Development Indicators, for real GDP per capita (2010 U.S. dollars) in France, Japan, the United Kingdom, and Canada in 1960 and 2015. Complete the table. Have these countries converged economically? 1960 2015 Real GDP Percentage Real GDP
Over the next 100 years, real GDP per capita in Groland is expected to grow at an average annual rate of 2.0%. In Sloland, however, growth is expected to be somewhat slower, at an average annual growth rate of 1.5%. If both countries have a real GDP per capita today of $20,000, how will their real
How have Canadian policies and institutions influenced the country’s long-run economic growth?
What roles do physical capital, human capital, technology, and natural resources play in influencing long-run economic growth of aggregate output per capita?
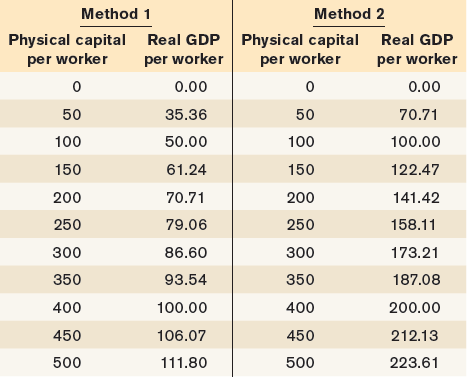
The country of Androde is currently using Method 1 for its production function. By chance, scientists stumble onto a technological breakthrough that will enhance Androde€™s productivity. This technological breakthrough is reflected in another production function, Method 2. The
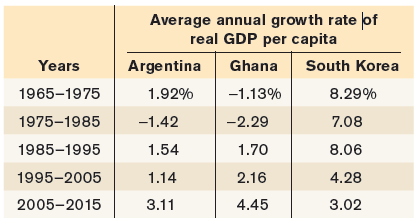
The following table shows the average annual growth rate in real GDP per capita for Argentina, Ghana, and South Korea using data from the World Bank, World Development Indicators, for the past few decades.a. For each 10-year period and for each country, use the Rule of 70 where possible to
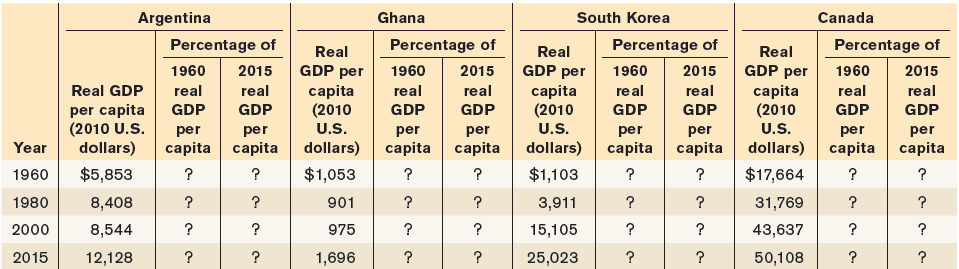
The accompanying table shows data from the World Bank, World Development Indicators, for real GDP per capita (in 2010 U.S. dollars) for Argentina, Ghana, South Korea, and Canada for 1960, 1980, 2000, and 2015.a. Complete the table by expressing each year€™s real GDP per capita as a
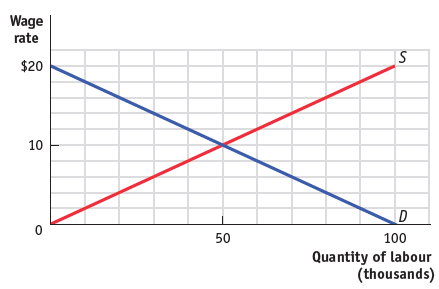
There is only one labour market in Profunctia. All workers have the same skills, and all firms hire workers with these skills. Use the accompanying diagram, which shows the supply of and demand for labour, to answer the following questions. Illustrate each answer with a diagram.a. What is the
In 1991, the Bank of Canada adopted an inflation-control target. The current target rate of inflation is 2%, with a target range of 1 to 3%. Many Canadians welcome the adoption of the inflation-control target as it allows them to make better economic decisions. Explain how both creditors and
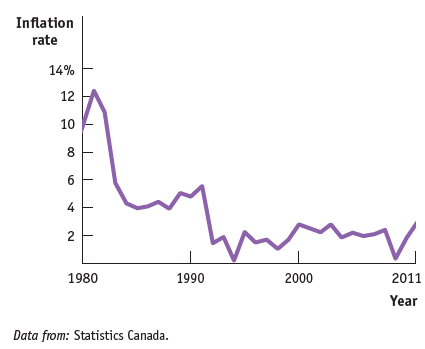
The accompanying diagram shows the inflation rate in Canada from 1980 to 2017.a. From 1980 to 2017, Canada experienced two periods of disinflation€”the first between 1980 and 1985 and the second between 1991 and 1994. How would you have expected the unemployment rate to behave during
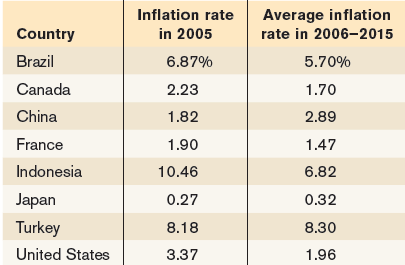
The accompanying table provides the inflation rate in the year 2005 and the average inflation rate over the period 2006€“2015 for eight different countries.a. Given the expected relationship between average inflation and menu costs, rank the countries in descending order of menu costs
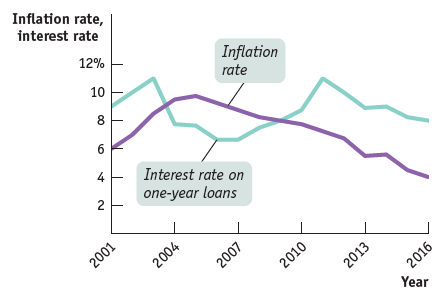
The accompanying diagram shows the interest rate on one-year loans and inflation during 2001€“2016 in the economy of Albernia. When would one-year loans have been especially attractive and why? Inflation rate, interest rate 12% Inflation rate 10 6. 4 Interest rate on one-year loans 2001
In the following examples, is inflation creating winners and losers at no net cost to the economy or is inflation imposing a net cost on the economy? If a net cost is being imposed, which type of cost is involved?a. When inflation is expected to be high, workers get paid more frequently and make
With its tradition of a job for life for most citizens, Japan once had a much lower unemployment rate than that of Canada; from 1960 to 1995, the unemployment rate in Japan exceeded 3% only once. However, since the crash of its stock market in 1989 and slow economic growth in the 1990s, the
How will the following changes affect the natural rate of unemployment?a. The government reduces the time during which a worker can receive employment insurance.b. More teenagers focus on their studies and do not look for jobs until after college or university.c. Greater access to the Internet
In which of the following cases is it more likely for efficiency wages to exist? Why?a. Jane and her boss work as a team selling ice cream.b. Jane sells ice cream without any direct supervision by her boss.c. Jane speaks Korean and sells ice cream in a neighbourhood in which Korean is the primary
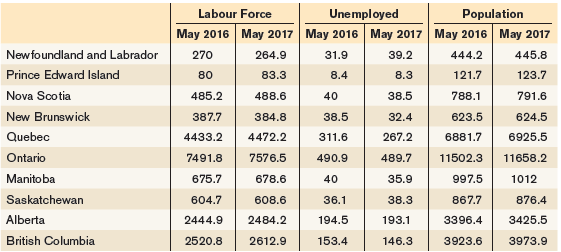
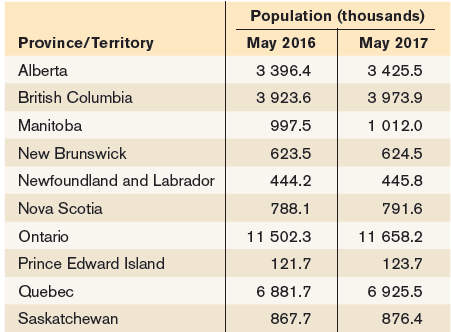
The accompanying table provides data on the size of the labour force and the number of unemployed workers for the provinces and territories of Canada.a. Calculate the number of workers employed in each province and territory in May 2016 and in May 2017. Use your answer to calculate the change in
Part of the information collected in the Labour Force Survey concerns how long individuals have been unemployed. Go to www.statcan.gc.ca to find the latest report. Click on the link on this main page labelled “CANSIM.” This will direct you to another page for CANSIM. Then in the “Search
In each of the following situations, what type of unemployment is Melanie facing?a. After completing a complex programming project, Melanie is laid off. Her prospects for a new job requiring similar skills are good, and she has signed up with a programmer placement service. She has passed up offers
In general, how do changes in the unemployment rate vary with changes in real GDP? After several quarters of a severe recession, explain why we might observe a decrease in the official unemployment rate. Explain why we could see an increase in the official unemployment rate after several quarters
What difference do you notice between the variability in the inflation rate before and after 1985? Provide an explanation for this phenomenon.
Suppose that you had the special power to travel in time and to carry out any experiment you wanted on the economy. If you could turn back the clock to the time of the Great Depression, what experiment would you like to run on the U.S. economy? Why?
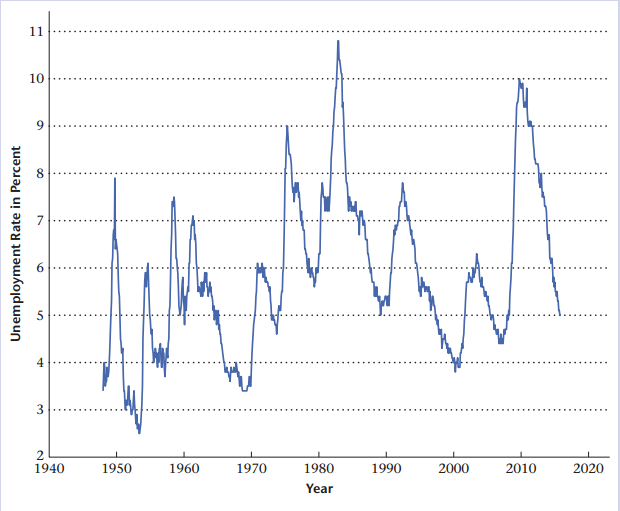
In Figure 1.6, does unemployment change more rapidly when it is increasing, or when it is decreasing? Speculate on why this regularity might be observed in the data.Figure 1.6: 11 10 4 1940 1950 1960 1970 1980 1990 2000 2010 2020 Year Unemployment Rate in Percent
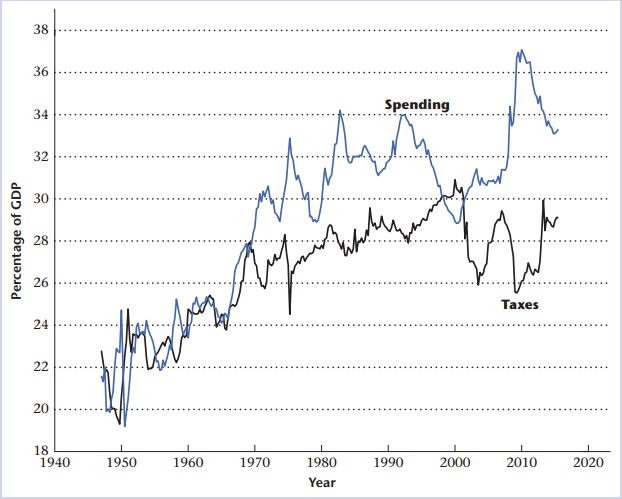
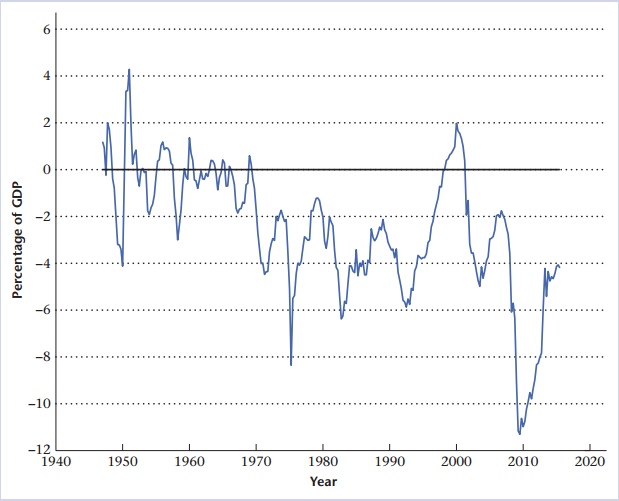
Use Figures 1.8 and 1.9 to determine why the total government deficit was large during the 2008€“2009 recession. Was the deficit large because taxes fell, because spending rose, or both?Figure 1.8:Figure 1.9: 38 36 Spending 34 32 30 28 26 Taxes 24 22 20 18 1940 1950 1960 1970 1980 1990
Assume the economy is open to capital inflows and outflows and therefore net capital inflow equals imports (IM) minus exports (X). Answer each of the following questions.a. X = $125 millionIM = $80 millionBudget balance = −$200 millionI = $350 millionCalculate private savings.b. X = $85 millionIM
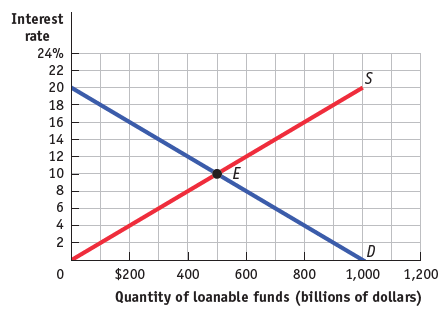
The government is running a budget balance of zero when it decides to increase education spending by $200 billion and finance the spending by selling bonds. The accompanying diagram shows the market for loanable funds before the government sells the bonds. Assume that there are no capital inflows
Suppose a national early childhood education program for all preschool-aged children has been proposed. The federal government estimates that the program would cost $15 billion to implement. Assume this program would be paid for by the government borrowing, which decreases the supply of loanable
Explain why equilibrium in the loanable funds market maximizes efficiency.
How would you respond to a friend who claims that the government should eliminate all purchases that are financed by borrowing because such borrowing crowds out private investment spending?
Boris Borrower and Lynn Lender agree that Lynn will lend Boris $10,000 and that Boris will repay the $10,000 with interest in one year. They agree to a nominal interest rate of 8%, reflecting a real interest rate of 3% on the loan and a commonly shared expected inflation rate of 5% over the next
Using the accompanying diagram, explain what will happen to the market for loanable funds when there is a fall of 2 percentage points in the expected future inflation rate. How will the change in the expected future inflation rate affect the equilibrium quantity of loanable funds?
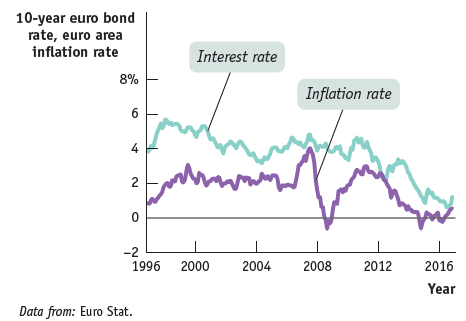
The accompanying diagram shows data for the interest rate on 10-year euro area government bonds and inflation for the euro area for 1996 through mid-2016, as reported by the European Central Bank. How would you describe the relationship between the two? How does the pattern compare to that of the
For each of the following, is it an example of investment spending, investing in financial assets, or investing in physical assets?a. Rupert Moneybucks buys 100 shares of existing Coca-Cola stock.b. Rhonda Moviestar spends $10 million to buy a mansion built in the 1970s.c. Ronald Basketballstar
Explain how a well-functioning financial system increases savings and investment spending, holding the budget balance and any capital flows fixed.
Each month, usually on the first Friday of the month, Statistics Canada releases the Labour Force Survey for the previous month. Go to StatCan’s home page at www.statcan.gc.ca. Pick English or French. Click on the “Unemployment rate” link under the “Latest Indicators” heading. This will
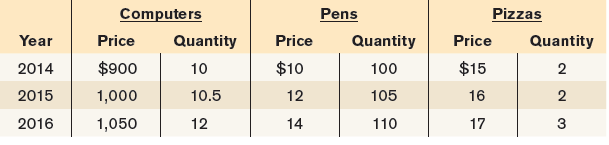
The economy of Britannica produces three goods: computers, pens, and pizza. The accompanying table shows the prices and output of the three goods for the years 2014, 2015, and 2016.a. What is the percent change in production of each of the goods from 2014 to 2015 and from 2015 to 2016?b. What is
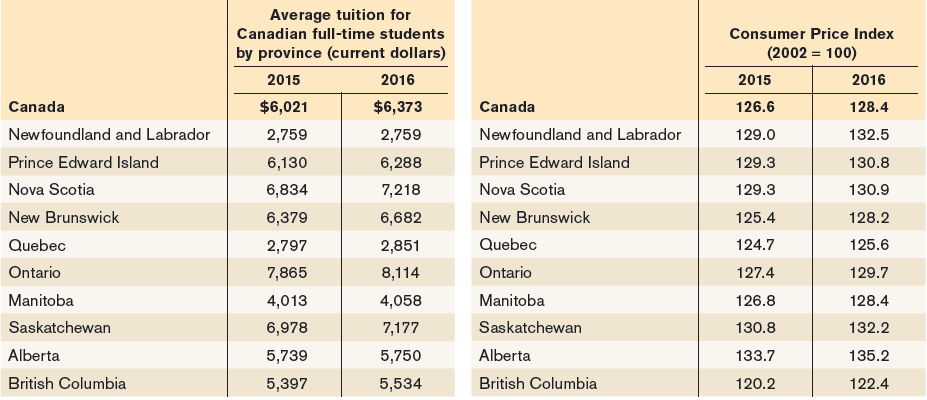
The cost of undergraduate (university) education in Canada has risen in recent years. These tables show the average cost of tuition for Canadian full-time students for the academic years that began in 2015 and 2016, measured in current dollars, and the consumer price index (CPI) in 2010 and 2011.a.
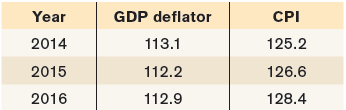
The accompanying table contains two price indexes for the years 2014, 2015, and 2016: the GDP deflator and the CPI. For each price index, calculate the inflation rate from 2014 to 2015 and from 2015 to 2016. (Note: The GDP deflator has a base year of 2007 and the CPI has a base year of 2002.) GDP
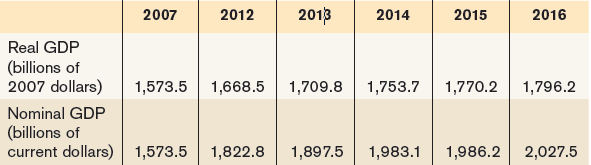
The accompanying table provides the annual real GDP (in billions of 2002 dollars) and nominal GDP (in billions of dollars) for Canada.a. Calculate the GDP deflator for each year.b. Use the GDP deflator to calculate the inflation rate for all years except 2007. 2013 2014 2007 2015 2012 2016 Real GDP
The consumer price index, or CPI, measures the cost of living for a typical urban household by multiplying the price for each category of expenditure (housing, food, and so on) times a measure of the importance of that expenditure in the average consumer’s market basket and summing over all
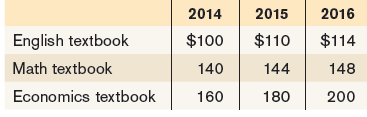
East land College is concerned about the rising price of textbooks that students must purchase. To better identify the increase in the price of textbooks, the dean asks you, the Economics Department€™s star student, to create an index of textbook prices. The average student purchases
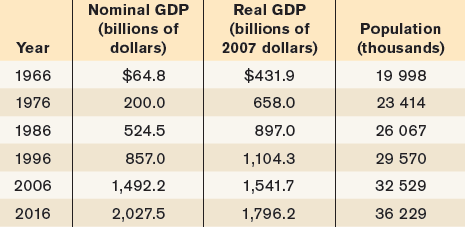
The accompanying table shows data on nominal GDP (in billions of dollars), real GDP (in billions of 2007 dollars), and population (in thousands) of Canada in 1966, 1976, 1986, 1996, 2006, and 2016. The Canadian price level rose consistently over the period 1966€“2016.a. Why is real GDP
Which of the following transactions should be included in GDP for Canada?a. Coca-Cola builds a new bottling plant in the Canada.b. Air Canada sells one of its existing airplanes to Korean Air.c. Ms. Moneybags buys an existing share of Telus Corporation stock.d. A softwood lumber firm in British
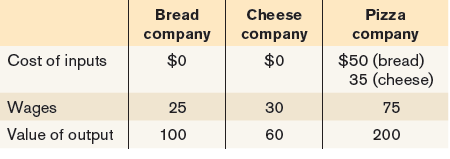
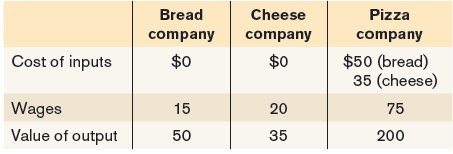
In the economy of Pizzania (from Problem 4), bread and cheese produced are sold both to the pizza company for inputs in the production of pizzas and to consumers as final goods. The accompanying table summarizes the activities of the three companies.a. Calculate GDP as the value added in
The small economy of Pizzania produces three goods (bread, cheese, and pizza), each produced by a separate company. The bread and cheese companies produce all the inputs they need to make bread and cheese, respectively. The pizza company uses the bread and cheese from the other companies to make
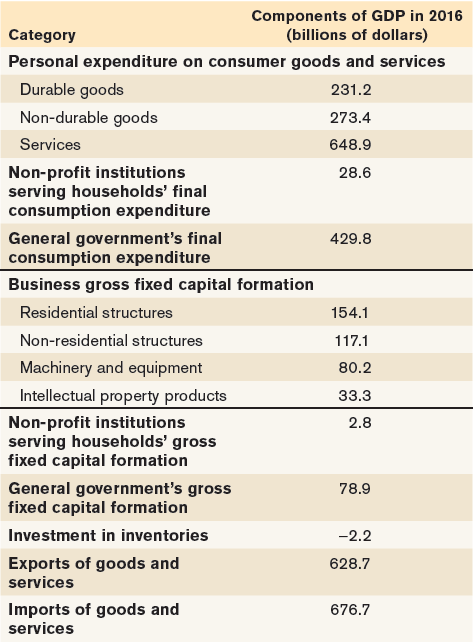
Consider the following table for Canada€™s GDP in 2016.a. Calculate 2016 consumer spending.b. Calculate 2016 private investment spending.c. Calculate 2016 net exports.d. Calculate 2016 government purchases of goods and services and government investment spending.e. Calculate 2016 gross
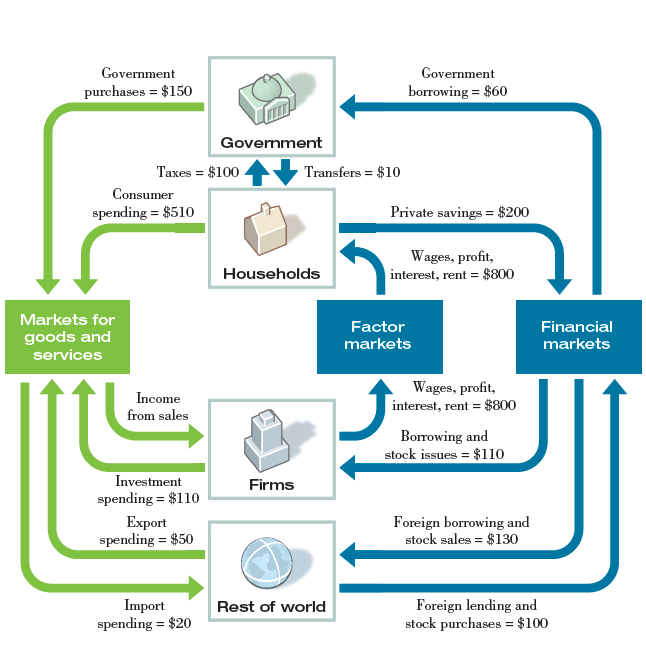
A more complex circular-flow diagram for the economy of Macronia is shown below.a. What is the value of GDP in Macronia?b. What is the value of net exports?c. What is the value of disposable income?d. Does the total flow of money out of households€”the sum of taxes paid, consumer
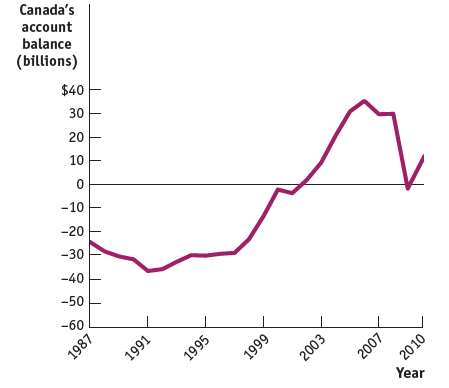
The accompanying figure illustrates the current account balance for Canada from 1987 to 2016. A positive balance represents a trade surplus, while a negative one represents a trade deficit. While Canada often ran a trade surplus over this time period, it has also been running a growing trade
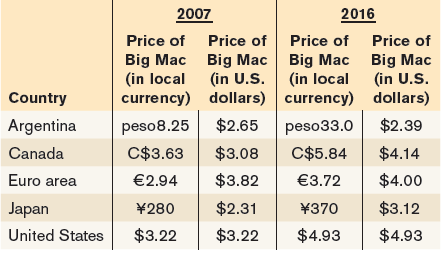
Each year, The Economist publishes data on the price of the Big Mac in different countries and exchange rates. The accompanying table shows some data used for the index from 2007 and 2016. Use this information to answer the following questions.a. Where was it cheapest to buy a Big Mac in U.S.
In 1798, Thomas Malthus’s Essay on the Principle of Population was published. In it, he wrote: “Population, when unchecked, increases in a geometrical ratio. Subsistence increases only in an arithmetical ratio. . . . This implies a strong and constantly operating check on population from the
Why do we consider a business-cycle expansion different from long-run economic growth? Why do we care about the size of the long-run growth rate of real GDP versus the size of the growth rate of the population?
a. What three measures of the economy tend to move together during the business cycle? Which way do they move during an upturn? During a downturn?b. Who in the economy is hurt during a recession? How?c. How did Milton Friedman alter the consensus that had developed in the aftermath of the Great
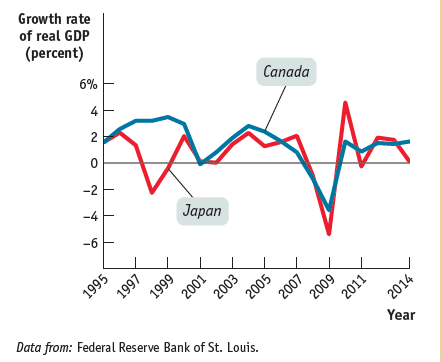
In the 1990s there were some dramatic economic events that came to be known as the Asian financial crisis. A decade later similar events came to be known as the global financial crisis. The accompanying figure shows the growth rate of real GDP in Canada and Japan from 1995 to 2014. Using the graph,
Statistics Canada reports statistics on employment and earnings that are used as key indicators by many economists to gauge the health of the economy. Figure 6-4 plots historical data on the unemployment rate each month. Noticeably, the numbers were high during the recession in the early 1990s,
How do economists in Canada determine when a recession begins and when it ends? How do other countries determine whether or not a recession is occurring?
Before the Great Depression, the conventional wisdom among economists and policy makers was that the economy is largely self-regulating. a. Is this view consistent or inconsistent with Keynesian economics? Explain.b. What effect did the Great Depression have on conventional wisdom?c. Contrast
When one person saves more, that person’s wealth is increased, meaning that he or she can consume more in the future. But when everyone saves more, everyone’s income falls, meaning that everyone must consume less today. Explain this seeming contradiction.
Which of the following questions are relevant for the study of macroeconomics and which for microeconomics?a. How will Ms. Martin’s tips change when a large manufacturing plant near the restaurant where she works closes?b. What will happen to spending by consumers when the economy enters a
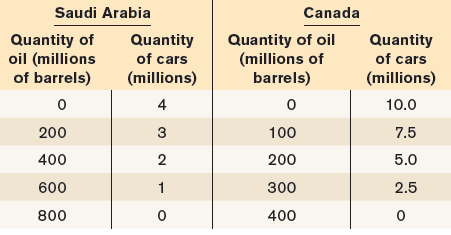
Assume Saudi Arabia and Canada face the production possibilities for oil and cars shown in the accompanying table.a. What is the opportunity cost of producing a car in Saudi Arabia? In Canada? What is the opportunity cost of producing a barrel of oil in Saudi Arabia? In Canada?b. Which country
Producers in import-competing industries often make the following argument: “Other countries have an advantage in production of certain goods purely because workers abroad are paid lower wages. In fact, North American workers are much more productive than foreign workers. So import-competing
Canada is highly protective of its agricultural (food) industry, imposing import tariffs, and sometimes quotas, on imports of agricultural goods. This chapter presented three arguments for trade protection. For each argument, discuss whether it is a valid justification for trade protection of
As Canada has opened up to trade, it has lost many of its low-skill manufacturing jobs, but it has gained jobs in high-skill industries, such as the software industry. Explain whether Canada as a whole has been made better off by trade.
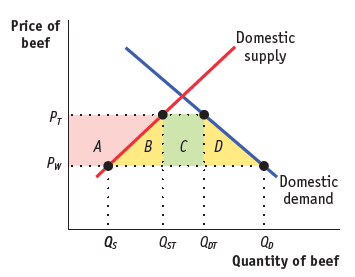
The accompanying diagram illustrates the Canadian domestic demand curve and domestic supply curve for beef.The world price of beef is PW. Canada currently imposes an import tariff on beef, so the price of beef is PT. Parliament decides to eliminate the tariff. In terms of the areas marked in the
In Canada, producers of milk, poultry, and eggs are protected by government-imposed supply management rules. This supply management system is made up of a combination of import controls, production planning quotas, and minimum prices for these products.a. Suppose the goal of the government is to
Once again, using the OEC website from Problems 10 and 11, identify which country has a comparative advantage for each of the following goods. For each good, include the country’s share of global exports and the total dollar value of that share.a. Computersb. Maple syrupc. Soybeansd. Cocoa
Comparative advantage creates an opportunity for less productive economies like Bangladesh to trade with more productive economies like Canada. Using the OEC website from Problem 10, how much did Bangladesh export to Canada? What was its largest export to Canada? In general, what type of goods did
The Observatory of Economic Complexity (OEC) is a data visualization that models international trade data among countries. Go to the website at atlas.media.mit.edu to answer the following questions.a. Start by selecting “Countries” and enter “Canada” in the search bar. In 2014, what was the
Showing 5900 - 6000
of 6280
First
49
50
51
52
53
54
55
56
57
58
59
60
61
62
63
Step by Step Answers