New Semester
Started
Get
50% OFF
Study Help!
--h --m --s
Claim Now
Question Answers
Textbooks
Find textbooks, questions and answers
Oops, something went wrong!
Change your search query and then try again
S
Books
FREE
Study Help
Expert Questions
Accounting
General Management
Mathematics
Finance
Organizational Behaviour
Law
Physics
Operating System
Management Leadership
Sociology
Programming
Marketing
Database
Computer Network
Economics
Textbooks Solutions
Accounting
Managerial Accounting
Management Leadership
Cost Accounting
Statistics
Business Law
Corporate Finance
Finance
Economics
Auditing
Tutors
Online Tutors
Find a Tutor
Hire a Tutor
Become a Tutor
AI Tutor
AI Study Planner
NEW
Sell Books
Search
Search
Sign In
Register
study help
business
megaproject management
Project Management For Engineering Business And Technology 5th Edition John M. Nicholas, Herman Steyn - Solutions
The actual start dates for tasks A and B are August 2 and August 1, respectively. At the end of August 4, Task A is assessed to be 20 percent completed and Task B, 30 percent completed. What is the expected early start time for Task C?
After 4 days of work the supervisor estimates that the task is 25 percent completed. If the work rate stays the same, what is the forecast date of completion?b. Task C has two immediate predecessors, tasks A and B. Task A is planned to take 5 days to complete; Task B is planned to take 10 days. The
Assume for the following problems that work continues during weekends.a. A task is planned to start on April 30 and takes 20 days to complete. The actual start date is May
Interpret the results.b. Compute ETC and EAC. Estimate the revised completion date and sketch the lines for forecast AC and forecast EV.
Using the status chart in Figure 11.23:a. Estimate SV, CV, and TV, and compute SPI and CPI for Week
In the LOGON project suppose the status of the project as of Week 22 is as follows (note usage of the longer acronyms; some project management software packages use these and not the shorter acronyms PV, AC, and EV).BCWS = $628,000 ACWP = $640,000 BCWP = $590,000 Answer the following questions:a.
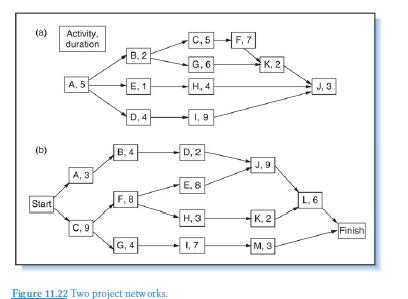
Use the networks in Figure 11.22 to determine ES, LS, EF, and LF for all activities (number in activity box is duration in days). Apply the buffer concept to the critical path. For Network (a) use a 3-week time buffer for the critical path, a 1-week time buffer for every path that feeds into the
What should a change control system do? Describe procedures that minimize unnecessary changes.
Discuss reasons why the project manager tries to resist project changes.
Explain TPM, its purpose, and how it is conducted.
What does it signify if cost or schedule index figures are less than 1.00?
Explain PV, AC, and EV, and how they are used to determine the variances AV, SV, CV, and TV. Explain the meaning of these variances.
Refer to Example 11.3.a. Suppose in Week 28 the team discovers a procedural error that negated all work done so far on Task R. What are the revised values for percent CC completed and percent buffer consumed for Week 28? Where in the fever chart is the project?b. Recompute percent CC completed and
What are the principal causes of project schedule overruns? Discuss at least four practices that may be used to reduce schedule variability and keep projects on schedule.
Discuss quality control as applied to projects.
Why is scope change control an important part of the project control process?
Discuss different ways of measuring ongoing work progress.
Describe the process of collecting data about the cost, schedule, and work accomplished.
Describe the process of work authorization. What does a work order usually include?
If a cost or schedule variance is noticed at the project level, how is it traced to the source of the variance?
How are overhead expenses allocated in work packages?
Explain the differences between internal and external project controls.
What are the three phases of the project monitoring and control process?
What is contract administration?
What is the distinction between the project end-item and project sideitems?What role does the project manager have regarding each?
What happens during the production/build stage? How is work planned and coordinated? Who oversees the work?
What does the plan for production/build include?
What is the role of interaction design in product design and development?
What happens during the design stage? Who is involved? What do they do? What is the role of the project manager? How are design changes monitored and controlled?
What is the practice of “fast-tracking” or “design/build?” What are the associated potential benefits and dangers?
Frank Wesley, project manager for the LOGON project, is concerned about the development time for the robotic transporter. Although the subcontractor, Creative Robotics, has promised a delivery time of 6 weeks, Frank knows that the actual delivery time will be a function of the number of other
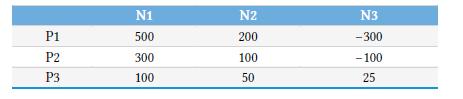
Iron Butterfly, Inc. submits proposals in response to RFPs and faces three possible outcomes: N1, Iron Butterfly gets a full contract; N2, it gets a partial contract (job is shared with other contractors); N3, it gets no contract. The company is currently assessing three RFPs, coded P1, P2, and P3.
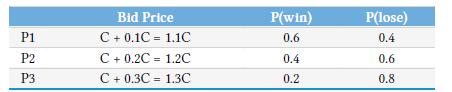
Corecast Contractors has been requested by a municipality to submit a proposal bid for a parking garage contract. In the past the cost of preparing bids has been about 2 percent of the cost of the job. Corecast project manager Bradford Pitts is considering three possible bids: cost plus 10 percent,
Softside Systems has a $100,000 fixed price contract for installation of a new application system. The project is expected to take 5 weeks and cost$50,000. Experience with similar projects suggests a 0.30 likelihood that the project will encounter problems that could delay it by as much as 3 weeks
The geographical location of the Largesse Hydro Project threatens it with weather-associated delays and costs. The bad weather likelihood is estimated at 0.30 with a potential impact of delaying work by 10 weeks and increasing the cost by $20,000.a. Ignoring the time and cost risks in Problem 23,
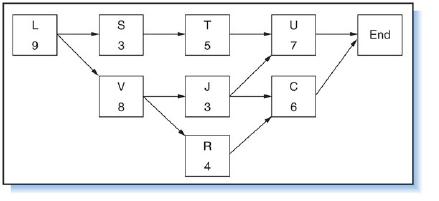
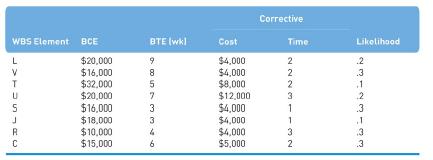
Figure 10.8 below is the network for the Largesse Hydro Project:The table below gives the baseline cost and time estimates (BCE and BTE), the cost and time estimates to correct for failure, and the likelihood of failure for each work package.a. Determine the risk time and risk cost for all the WBS
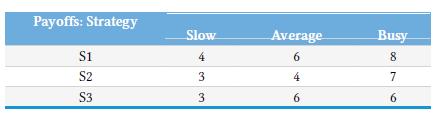
Where would the maximax, maximin, and minimax regret criteria be used during the project life cycle to manage project risk?
How and where are risk time and risk cost considerations used in project planning?
Can risk be eliminated from projects? Should management try to eliminate it?
Risk management includes being prepared for the unexpected. Explain.
How does risk planning serve to increase risk-taking behavior?
List and review the principles of risk management.
One requirement of a power-generating system states that it must provide 500 kwh minimum output. The system has three powergenerating subsystems, X, Y, and Z. Constraints on physical size indicate that the output capacity of the overall system will be split among the three subsystems in the
What is a design margin? How does its application reduce risk?
Think of a project you are familiar with and problems it encountered.List some ways the problems could have been avoided, and explain each of them.
Discuss briefly each of the following ways to handle risk: transfer risk, avoid risk, reduce risk, contingency plan, and accept risk.
Do equations (10.1), (10.2), and (10.3) present good ways for rating the overall likelihood, impact, and consequences of risk? Discuss pros and cons of using these equations.
Tables 10.3 and 10.4 are for illustration purposes. Discuss the general applicability of these tables to rating risks in projects. Would you use these tables to assess the risk likelihood and impact in a project of your choice? Why or why not?
What is an influence diagram? How is it used to identify and analyze risk sources and to assign priorities to those sources?
A project involves developing a system with state-of-the-art hardware and software, both complex, and where system performance depends on another, external system that is being developed concurrently. Based on Table 10.3, and assuming all risk factors are independent and equally weighted, what is
Describe a cause-and-effect diagram. Pick a problem (effect) of your own choice and use a cause-and-effect diagram to illustrate it.
Briefly describe the following risk identification techniques: analogy, checklists, WBS analysis, process flowcharts, and brainstorming.
Describe each of the following sources of technical risk: maturity, complexity, quality, and concurrency or dependency.
Discuss the difference between internal risk and external risk. List sources of risk in each of these categories.
What factors make a project high-risk?
What is meant by risk of failure?
How does a person’s risk tolerance affect whether he rates a risk high, medium, or low?
Should risks that have low likelihood be ignored? Explain.
What risks materialized during the project and how were they handled?
Discuss the use of contingency plans and budget and schedule reserves to cover risks.
How were risks dealt with (through risk transfer, acceptance, avoidance, reduction, etc.)?
How were risks identified?
Was there a risk officer? Discuss her duties and role in the project.
Was a formal risk management plan created? Discuss the plan.
Was formal risk analysis performed? When was it done (in initiation, feasibility, etc.)?
In your own judgment, was this a risky project? Why or why not?
What did managers and stakeholders believe were the major risks in the project?
Comment on the contribution that inspection and audits could have played.
Comment on the relationship between project quality management and project risk management. How could risk management have prevented the accident? How does project quality management relate to project cost management?
What would the implications have been if the engineer who signed off on a specific design was an engineer-in-training instead of a registered engineer?
Explain how someone within B/PB would be accountable regardless of the findings of a forensic investigation. Would B/PB be off the hook if a subcontractor were found guilty?
What role could modeling/prototyping, laboratory tests, checklists, and training have played?
Explain the role that configuration management should have played in preventing the accident.
Propose guidelines for a process to ensure that the epoxy would provide sufficient bonding to the concrete ceiling.
List the characteristics that should have been classified as critical.
With 20-20 hindsight, draw a CE (fishbone, Ishikawa) diagram to illustrate possible causes and effects. Include the possible causes mentioned in the case. The diagram should have been developed before construction, therefore also indicate other possible failure modes and other causes you can think
Compile a list of “lessons learned” for the project and indicate how these lessons could contribute to more successful future projects.
Draw a CE diagram and a Pareto diagram to illustrate a project management problem that you have experienced in your study project.
Identify project budget items that aim to reduce the cost of external failures.
Discuss how the quality plan is (would be) integrated with the schedule, budget, risk management plan, and, if applicable, with the procurement plan.
Describe the quality plan for the investigation project. If there was none, develop one. Include all aspects discussed in the section on the Project Quality Management Plan that are relevant to the specific project.
In which ways would you be able to uncover customer expectations that have not been articulated explicitly?
Describe the pros and cons of CE diagrams.
How does the information on the x-axis of a Pareto diagram used in project control differ from the information on the x-axis of a Pareto diagram used to analyze defects in a mass production environment?
How would you expect the bars of a Pareto diagram to change as the result of an improvement program?
How do customer tests for acceptance differ from tests used to obtain design information?
Perform an FMEA analysis on an electric kettle with cord and plug.
Describe how FMEA in this chapter resembles the risk management approach described in Chapter 10.
Discuss the relationship between project quality management and project risk management.
Explain how classification of characteristics differs from classification of defects.
Explain how a narrow tolerance on a manufacturing drawing differs from classifying the characteristic as critical or major.
Discuss how design reviews contribute to the approach of concurrent engineering.
Describe the differences between design reviews and audits.
Indicate for each of the following whether to apply for a modification, a deviation, or a waiver:(a) The supplier of oil filters to an automobile manufacturer says it plans to terminate production of a filter to be used on a car that is under development.(b) An inspector discovered a kink in
The schedule indicating lectures, exams etc. for a college course can be considered a CI. Explain why there should be only one master copy.How does the same principle apply to an engineering drawing?
How does the role of the quality manager (a functional manager)regarding quality planning differ from that of the project manager?
Explain the difference between quality and grade.
What is the difference between satisfying requirements and fitness for purpose? Explain.
How does compliance to specification differ from satisfying requirements?
A Rolls Royce is considered a high-quality vehicle. Is this always true?Consider different users and uses.
Showing 3400 - 3500
of 6087
First
28
29
30
31
32
33
34
35
36
37
38
39
40
41
42
Last
Step by Step Answers