New Semester
Started
Get
50% OFF
Study Help!
--h --m --s
Claim Now
Question Answers
Textbooks
Find textbooks, questions and answers
Oops, something went wrong!
Change your search query and then try again
S
Books
FREE
Study Help
Expert Questions
Accounting
General Management
Mathematics
Finance
Organizational Behaviour
Law
Physics
Operating System
Management Leadership
Sociology
Programming
Marketing
Database
Computer Network
Economics
Textbooks Solutions
Accounting
Managerial Accounting
Management Leadership
Cost Accounting
Statistics
Business Law
Corporate Finance
Finance
Economics
Auditing
Tutors
Online Tutors
Find a Tutor
Hire a Tutor
Become a Tutor
AI Tutor
AI Study Planner
NEW
Sell Books
Search
Search
Sign In
Register
study help
business
megaproject management
Project Management For Engineering Business And Technology 5th Edition John M. Nicholas, Herman Steyn - Solutions
Describe your understanding of “quality.”
Were life cycle costs a consideration in the project? Explain.
Did the PCAS produce time-phased cost schedules and forecasts? Show some examples. How were they used by the project manager?
What kinds of costs summaries were prepared? Who were they sent to?How were they used? Show some examples.
Was the project budget broken down into control accounts? If so,a. How were they related to the work packages and WBS?b. How were they tied into the PCAS?
How were management and supervisory costs handled in the budget?
Describe the process of creating the project budget. Show a sample budget (or portion thereof).
What kind of project cost accounting system (PCAS) was used? Was it manual or computerized? Describe the system and its inputs and outputs. Who maintained the system? How was it used during the project?
How were estimates tallied to arrive at a total project cost estimate?Who did this?
How were overhead costs determined? What basis was used for establishing overhead cost rates?
How often and when were cost estimates revised during the project?
Was a life cycle cost analysis performed? If so, who did it, when, and using what methods? How did the analysis affect the design, development, and production of the project deliverables or main enditem?
What, if any, were the principle causes of cost escalation in the project?
When did estimating take place? How were estimates checked and accumulated? How were they related to the WBS?
How were project costs estimated? Who was involved? Describe the process.
Explain retention money and performance guarantee.
Using the data in problem 30, repeat Steps b and c using late start times.Then identify the feasible budget region using the cumulative curves.
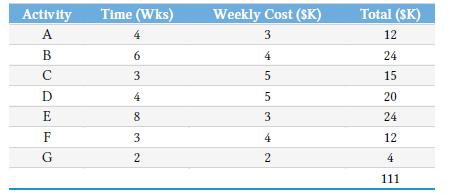
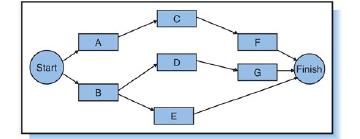
Use the table below and the network in Figure 8.20 to answer questions about the ARGOT project:a. Compute the ESs and LSs for the project. Assume Ts is the same as the earliest project completion date.b. Construct a time-based network for the project such as Figure 8.14 (use early start times).c.
Chapter 7 discussed the impact of crashing activities and the relationship of schedules to cost. The CPM method assumes that as activity duration is decreased, the direct cost increases owing to the increases in direct labor rates from overtime. Overhead rates also may vary, although the overhead
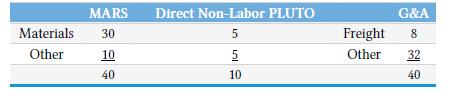
The example in Table 8.2 shows three possible ways of apportioning total direct costs. Using the same example, suppose the direct non-labor(DNL) cost and G&A are broken down as follows:Assuming all remaining costs shown in Table 8.2 are unchanged, compute the project costs for MARS and PLUTO
The project manager Sean Shawn employed the analogy with adjustment method to estimate the cost of constructing a three-car garage.Specifically, he started with the cost of an average two-car garage,$43,000, and increased it by 50 percent to $64,500. Comment on the likely accuracy of the three-car
Refer to Case 5.1, the Barrage Construction Company, in Chapter
What might happen if top management submitted a bid for a project without consulting the business unit or department to be involved in the project?
What are the reasons for investigating the influence of schedules on project costs? What is the feasible budget region?
How are time-based forecasts prepared and how are they used?
How are control accounts aggregated horizontally and vertically? Why are they aggregated like this?
What is a control account and what kinds of information does it contain? How does a control account fit into the structure of the PCAS?
How is the overhead rate determined?
What expenses are included under direct non-labor?
How are direct labor expenses determined?
What are six cost elements shared by most estimates and budgets?
Distinguish recurring costs from nonrecurring costs.
What is a time-phased budget? What is the difference between a budget and a cost estimate?
Describe the PCAS. What is its purpose and how is it used in project planning?
Describe the different kinds of contingency amounts and the purposes each serves.
What is the role of the functional units and subcontractors in cost estimating?
Describe the process of using the WBS to develop cost estimates. Discuss“top-down” versus “bottom-up” estimating. How are work package estimates aggregated into total project cost estimates?
For each of the following estimating methods, briefly describe the method, when it is used, and the estimate accuracy it provides:a. expert opinionb. analogyc. parametricd. cost engineering.
Explain the difference between accuracy and precision. Give two examples that illustrate the difference.
Explain the difference between a cost estimate and a cost target. What are the problems in confusing the two—in using cost targets as cost estimates?
What are life cycle costs and how are they different from project costs?
What is the relationship between phases of the project life cycle and cost escalation?
How does the type of contractual agreement influence the potential for cost escalation?
How do changes in requirements cause cost escalation?
Describe what the term “phased (rolling wave) project planning” means.
What is the purpose of a contingency fund (management reserve)? How is the contingency fund used and controlled?
Define cost escalation. What are major sources of cost escalation?
Why are accurate cost estimates so important, yet so difficult, in project planning? What are the implications and consequences of overestimating costs? Of underestimating costs?
Were people (other than the project manager) required to make commitments on the duration of activities? Comment on the possibility of changing this behavior.
How do you rate the risk of not finishing on time and what are the factors contributing to this risk?
Discuss how they were applied and show examples. Discuss those applications which that were not applied but which seem especially applicable to the project.
In the project you are studying, discuss which of the following kinds of analyses were performed:a. PERTb. CPM/time-cost tradeoff analysisc. Scheduling with resource constraintsd. CCPM
In a multiple-project environment the drum resource carries a certain“status” since work performed by other resources (and the needs of other resources) are subordinated to it. In one company management put a flag at a work center to indicate that it was the drum resource. An improvement (TOC
Revisit Question 18:a. Use the shortest task-time rule to solve the problem and draw a Gantt chart.b. Apply the least slack rule to solve the problem and draw a Gantt chart.c. Apply the first three of the five TOC steps (section 7.6) to the problem and draw a Gantt chart.d. Who would be the “drum
Discuss the implications of resource allocation for organizations involved in multiple projects.
Discuss the implications that subcontracted work would have on implementing CCPM.
Write an essay on the reasons why projects are often late.
Discuss the difference between fast-tracking, concurrent engineering, and crashing.
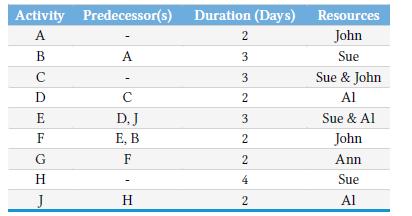
Consider the data about project activities given in the table below.a. Schedule the work in such a way that each person always has only one task to perform (do not reduce the durations of activities or insert buffers as yet).b. Indicate the critical chain.c. Indicate where the feeding buffers
Refer to Figure 7.22. Scheduling Activity T before Activity Q would also have been a way to resolve the resource contingency. Explain why this alternative was not selected.
Refer to the network in Question 19 in the Review Questions and Problems for Chapter 6.See Chapter 6a. Indicate the critical chain on the diagram.b. Assume the schedule uses durations from which any contingency(padding) has been removed. Insert a project buffer and feeding buffers as required.
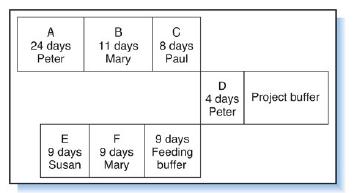
The diagram below was drawn before it became clear that Mary would have to perform both Activity B and Activity F.a. With the realization that Mary has to do the two tasks, indicate two possible critical chains.b. Reschedule the work and indicate the position and the size of the feeding buffer. A B
Explain in your own words how the principle of aggregation plays a role in reducing project duration.
How would you use buffers to ensure that you are on time for appointments? What factors would you take into account when you make a decision on the size of the buffer?
For the network in Figure 7.12, what is the probability of completing each of the five paths within 30 days? What is the probability of completing them all within 30 days?
Refer to the first network in the above problem.a. What is P(Te< 23)?b. What is P(Te< 32)?c. For what Ts is the probability 95 percent that the project will be completed?
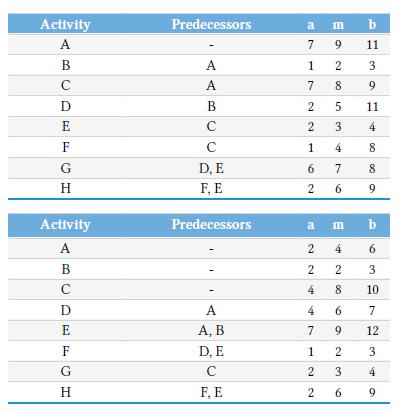
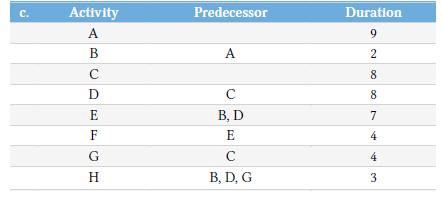
The tables below show the immediate predecessors anda, m, b for each activity in the two projects. For each project compute:a. te and V for each activityb. ES, EF, LS, and LF for each activity.c. Te and Vp for the project. Activity A Predecessors a m b 79 11 B A 1 2 3 CD A 7 8 9 B C C 2 14 22 5 11
A procurement officer finds that the delivery time for a specific item is never delivered in less than 5 days. The worst case scenario is that it takes 30 days for the item to arrive. A delivery lead time of 10 days is the most frequent.a. Calculate the expected delivery timeb. What estimate would
Has variability in a time estimate ever caused you to be late for an appointment? Describe.
The following table gives information on a project (T in days, C in $1,000s):a. Draw the network diagram. Under normal conditions, what is the earliest the project can be completed? What is the direct cost?What is the critical path?b. What is the cost of the project if it is completed 1 day
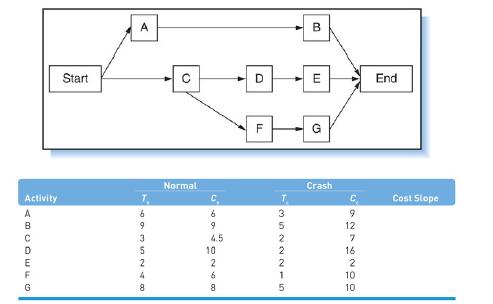
The project network and associated costs (T in days, C in $1,000s) are shown below.a. What is the earliest the project can be completed under normal conditions? What is the direct cost?b. What is the least costly way to reduce the project duration by 2 days? What is the project cost?c. What is the
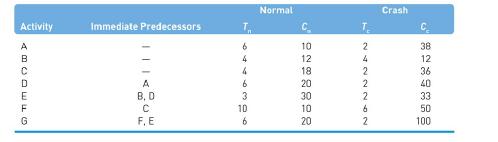
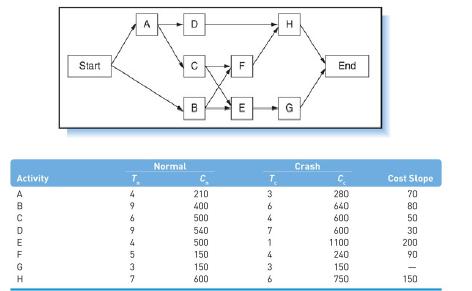
The project network and associated costs (T in days, C in $1,000s) are shown below.a. Verify that the normal duration is 22 days and that the direct cost is $3,050.b. What is the least costly way to reduce the project duration to 21 days? What is the project cost?c. What is the least costly way to
What are the criticisms of CPM? How and where is CPM limited in its application?
Time-cost tradeoff analysis deals only with direct costs. What distinguishes these costs from indirect costs? Give examples of both direct and indirect costs.
The cost slope always has a negative value. What does this indicate?
What does the cost slope represent?
How do CPM and PERT differ? How are they the same?
Define crash effort and normal effort in terms of the cost and time they represent. When would a project be crashed?
Were there any complaints about unrealistic workloads?
Was resource leveling done?
Did the functional manger(s) take responsibility for workload on resources?
If the project was done within a matrix structure, how did communication between the functional and project managers take place?
Was the workload on resources made visible?
How was the schedule reserve determined and included in the schedule?
Was all detail planning done upfront or was a phased approach followed?
What was used first to develop the schedule: (a) a table such as Table 6.3,(b) a network diagram, or was (c) the Gantt chart drawn first? Comment on the method used.
Was scheduling software used?
At what point in the project were networks created? When were they updated?
Were networks used for scheduling? If so, describe the networks. Show examples. What kind of computer software system was used to create and maintain them? Who was responsible for system inputs and system operations? Describe the capabilities of the software system.
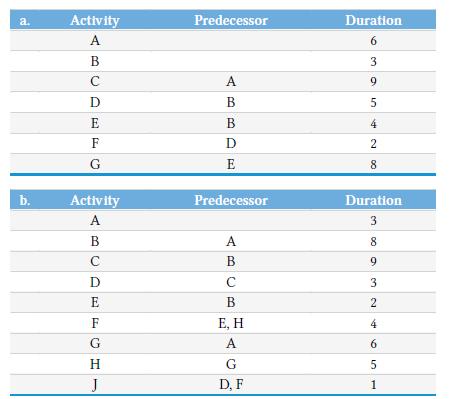
For each of the following predecessor tables:• Draw a corresponding AON network.• Compute ES and EF for each activity.• Compute LS and LF for each activity. Find the critical path.• Determine the total slack and free slack. a. Activity Predecessor Duration A 6 B C A 39 D B 5 E B 4 F D G E
Suppose in Figure 6.20 everything is the same except Activity Y can start 4 days after Activity V starts, but cannot be finished until 6 days after Activity V is finished. Show how this changes the values for ES, EF, LS, and LF.
Show that the schedule in Figure 6.23 (that produced an erratic loading for workers) yields a more balanced loading for equipment than the one shown in Figure 6.27.
Discuss the implications of resource allocation for organizations involved in multiple projects.
Level the resources for a project with the workload diagram below. In the time-phased diagram at the top of the figure, dotted lines indicate slack.8 Discuss pros and cons of the alternatives available.
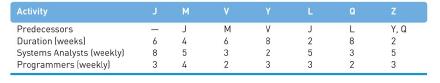
The requirements for systems analysts and programmers for the GUMBY project are as follows:a. Compute ESs, LSs, and total slack times.b. Then show the separate resource loadings for systems analysts and programmers, assuming early start times.c. Suppose the maximum weekly availability is eight
Describe how resource leveling of a resource-constrained project differs from resource leveling in a time-constrained project.
Why is leveling of resources preferred to large fluctuation of workload?What negative result could resource leveling cause?
To produce a manual, John has to write the text, after which Ann has to draw sketches and typeset the document. John can start with any section of the book (i.e., he does not have to start with Section 1). The work has to be done within 95 days. The network diagram below shows the precedence
For the PDM network in Figure 6.20, calculate ES, EF, LS, and LF for all activities.
Give examples of applications of PDM. Take a project you are familiar with (or invent one) and create a PDM network.
Showing 3500 - 3600
of 6087
First
29
30
31
32
33
34
35
36
37
38
39
40
41
42
43
Last
Step by Step Answers