New Semester
Started
Get
50% OFF
Study Help!
--h --m --s
Claim Now
Question Answers
Textbooks
Find textbooks, questions and answers
Oops, something went wrong!
Change your search query and then try again
S
Books
FREE
Study Help
Expert Questions
Accounting
General Management
Mathematics
Finance
Organizational Behaviour
Law
Physics
Operating System
Management Leadership
Sociology
Programming
Marketing
Database
Computer Network
Economics
Textbooks Solutions
Accounting
Managerial Accounting
Management Leadership
Cost Accounting
Statistics
Business Law
Corporate Finance
Finance
Economics
Auditing
Tutors
Online Tutors
Find a Tutor
Hire a Tutor
Become a Tutor
AI Tutor
AI Study Planner
NEW
Sell Books
Search
Search
Sign In
Register
study help
business
microeconomics principles
Microeconomics Canada In The Global Environment 9th Edition Robin Bade, Michael Parkin - Solutions
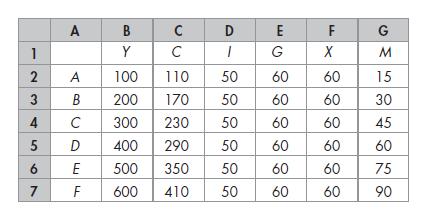
Calculate autonomous expenditure. Calculate the marginal propensity to consume.The spreadsheet lists real GDP (Y) and the components of aggregate planned expenditure in billions of dollars. 1 2 3 4 A A 100 B 200 C 300 5 D 400 6
Labour productivity is rising at a rapid rate in China and wages are rising at a similar rate.Explain how a rise in labour productivity and wages in China will influence the quantity of real GDP supplied and aggregate supply in China.
The increase in real GDP in the second quarter primarily reflected increases in personal consumption expenditure (0.9%), exports (4.2%), and investment (0.8%)—the largest quarterly gain since 2011, mainly due to the increase in consumption expenditure.Explain how the items in the news clip
Describe the policy change that a classical macroeconomist, a Keynesian, and a monetarist would recommend for Canadian policymakers to adopt in response to each of the following events:a. Growth in the world economy slows.b. The world price of oil rises.c. Canadian labour productivity declines.
Explain for each event whether it changes the quantity of real GDP demanded or aggregate demand in Canada.■ Canada’s exports to the European Union boom.■ Canadian firms build new pipelines across the nation.■ Foreign exchange dealers expect the Canadian dollar next year to appreciate
When real GDP increased in the second quarter of 2014, consumption expenditure, exports, and fixed investment increased, but business inventory investment fell from $14.5 billion to $7.0 billion.Explain how a fall in business inventories influences aggregate demand.
Real exports of goods and services increased 4.2 percent in the second quarter, after falling 0.2 percent in the first quarter. Real imports of goods and services increased 2.7 percent, after falling 1.4 percent in the first quarter. Explain how the changes in exports and imports reported here
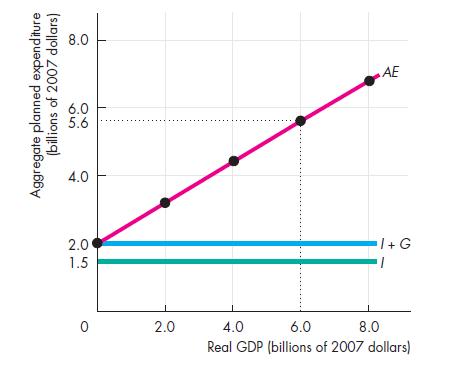
a. What is aggregate planned expenditure when real GDP is $6 billion?b. If real GDP is $4 billion, what is happening to inventories?c. If real GDP is $6 billion, what is happening to inventories?The figure illustrates the components of aggregate planned expenditure on Turtle Island. Turtle Island
Greg Mankiw wrote in 2007 on the eve of the global financial crisis, “Congress made its most important contribution to taming the business cycle back in 1913, when it created the Federal Reserve System. Today, the Fed remains the first line of defence against recession.”a. Describe the process
This headline expresses three views about what to do to get an economy growing more rapidly and contribute to closing the recessionary gap. Economists from which macroeconomic school of thought would recommend pursuing policies described by each of these views?
A decade ago, Brazil had rapid growth but now its economy is experiencing a slowdown with investment falling and inventories increasing. Potential GDP growth rate has slowed. Business and consumer confidence has fallen.a. Explain the effect of a decrease in investment on real GDP and potential
Which components of aggregate expenditure are influenced by real GDP?
In an economy, when income increases from $400 billion to $500 billion, consumption expenditure increases from $420 billion to $500 billion. Calculate the marginal propensity to consume, the change in saving, and the marginal propensity to save.
What is the relationship between aggregate planned expenditure and real GDP at equilibrium expenditure?
Explain how an increase in business investment at a constant price level changes equilibrium expenditure.
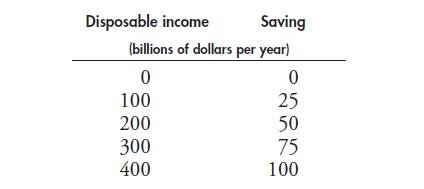
Calculate the marginal propensity to save.You are given the following information about the economy of Australia: Saving (billions of dollars per year) Disposable income 0 100 200 300 400 0 25 50 75 100
What is the multiplier? What does it determine? Why does it matter?
An economy has a fixed price level, no imports, and no income taxes. An increase in autonomous expenditure of $200 billion increases equilibrium expenditure by $800 billion. Calculate the multiplier and explain what happens to the multiplier if an income tax is introduced.
Explain the link between equilibrium expenditure and the quantity of real GDP demanded.
Calculate consumption at each level of disposable income. Calculate the marginal propensity to consume.You are given the following information about the economy of Australia: Saving (billions of dollars per year) Disposable income 0 100 200 300 400 0 25 50 75 100
How does a change in the price level influence the AE curve and the AD curve?
In the short run, does the price level remain at 100? Explain why or why not.Suppose that the economy is at full employment, the price level is 100, and the multiplier is 2. Investment increases by $100 billion.
a. Compare the change in real GDP in the long run with the increase in investment.b. Explain how the price level changes in the long run.Suppose that the economy is at full employment, the price level is 100, and the multiplier is 2. Investment increases by $100 billion.
Are the values of the multipliers in the short run and the long run larger or smaller than 2?Suppose that the economy is at full employment, the price level is 100, and the multiplier is 2. Investment increases by $100 billion.
Explain why higher share prices and house prices are equivalent to saving.Gains in stock markets and increased house prices boosted Canadians’ wealth in the first quarter of 2014. On a per capita basis, household wealth rose to $222,600. Statistics Canada also reported that consumption
Explain how a rise in household wealth would be expected to influence consumption expenditure and saving and how the consumption function and the saving function would change.Gains in stock markets and increased house prices boosted Canadians’ wealth in the first quarter of 2014. On a per capita
Draw a graph to illustrate how a rise in household wealth would change the consumption function and the saving function.Gains in stock markets and increased house prices boosted Canadians’ wealth in the first quarter of 2014. On a per capita basis, household wealth rose to $222,600. Statistics
The U.S. Commerce Department reported that wholesale inventories fell 1.3 percent in August for a record 12th consecutive month, evidence that companies are trimming orders to factories, which helped depress economic output during the recession. Economists hope that the rising sales will encourage
On January 27, 2009, the government announced a stimulus package, which included $12 billion earmarked for infrastructure—the construction of roads, bridges, public transit, broadband Internet access, schools, and social housing in every region of the country. If the slope of the AE curve is 0.7,
President Obama’s proposal to jolt a listless economic recovery with $180 billion worth of tax breaks and transportation projects left economists largely unimpressed Tuesday. If taxes fall by $90 billion and the spending on transport projects increases by $90 billion, which component of Obama’s
Compare the multiplier in the short run and the long run and explain why they are not identical.Statistics Canada reported that in the second quarter of 2014 Canadian exports increased by $24 billion.
For each of the expenditures listed in the news clip, say which is part of induced expenditure and which is part of autonomous expenditure.Consumer sentiment was up in August, helped by merchant discounts, especially from auto dealerships who received incentives from automakers Honda, General
Which of the events reported in the news clip would change aggregate demand and which would change the quantity of real GDP demanded? Provide a graphical illustration of the distinction.Consumer sentiment was up in August, helped by merchant discounts, especially from auto dealerships who received
Explain and draw a graph to illustrate how increasing consumer confidence influences aggregate expenditure and aggregate demand.Consumer sentiment was up in August, helped by merchant discounts, especially from auto dealerships who received incentives from automakers Honda, General Motors, and
In Japan, consumer prices slid at a faster pace in July and industrial production unexpectedly slumped.Contrast what the news clip says is happening in Japan with what is happening in Canada in Problem 30 and provide a graphical analysis of the differences.
How does a nonrival good differ from a nonexclusive good?
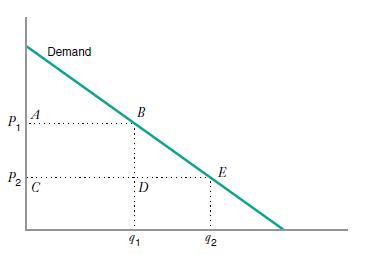
The accompanying figure illustrates the change in consumer surplus, given by area ABEC, when the price decreases from P1 to P2. This area can be divided into the rectangle ABDC and the triangle BDE. Briefly describe what each area represents, separately, keeping in mind the fact that consumer
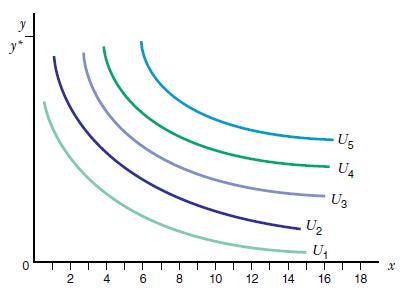
Gina lives in Chicago and very much enjoys traveling by air to see her mother in Italy. On the accompanying graph, x denotes her number of round trips to Italy each year. The composite good y measures her annual consumption of other goods; the price of the composite good is py, which is constant in
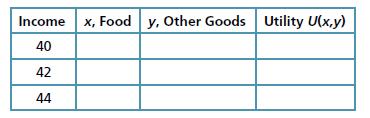
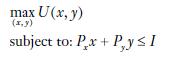
Emily purchases food (measured by x) and clothing (measured by y). Her preferences are described by the quasilinear utility function U(x, y) 32 √x 2y, withMUx = 16 / √x and MUy = 2. Throughout this problem, the prices of the two goods are Px = 2, Py = 1. Emily has a monthly income of
Catrina buys two goods, food F and clothing C, with the utility function U = FC + F. Her marginal utility of food is MUF = C + 1 and her marginal utility of 213 clothing is MUC = F. She has an income of 20. The price of clothing is 4.a) Derive the equation representing Catrina’s demand for food,
Raymond consumes leisure (L hours per day) and other goods (Y units per day), with preferences described by U(L,Y ) L + 2 √Y . The associated marginal utilities are MUY = 1 and MUL = 1/L. The price of other goods is 1 euro per unit. The wage rate is w euros per hour.a) Show how the number of
Julie buys food and other goods. She has an income of $400 per month. The price of food is initially $1.00 per unit. It then rises to $1.20 per unit. The prices of other goods do not change. To help Julie out, her mother offers to send her a check each month to supplement her income. Julie tells
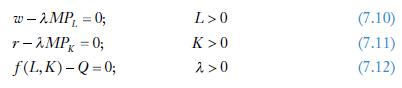
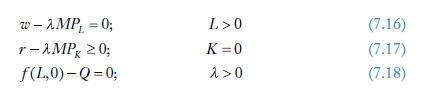
A firm has a production function Q = 10L + 30K. Suppose the price of labor services w is $5 per unit, and the price of capital services r is also $5 per unit. Using the method of Lagrange, find the optimal input combination given that the firm wishes to produce 900 units of output. Verify that the
Suppose that in the twenty-first century the production of semiconductors requires two inputs: capital (denoted by K) and labor (denoted by L). The production function takes the form Q = √KL. However, in the twenty-third century, suppose the production function for semiconductors will take the
A researcher claims to have estimated input demand curves in an industry in which the production technology involves two inputs, capital and labor. The input demand curves he claims to have estimated are L = ωr2Q and K = w2rQ. Are these valid input demand curves? In other words, could they have
A firm uses two inputs, labor services whose quantity is denoted by L and capital services whose quantity is denoted by K. The production function is given by Q = 100LK, and the price of labor w is $2 per unit and the price of capital r is $1 per unit. For this production function, the marginal
The Thai food restaurant business in Evanston, Illinois, is monopolistically competitive. Suppose that each existing and potential restaurant has a total cost function given by TC = 10Q + 40,000, where Q is the number of patrons per month and TC is total cost per month. The fixed cost of $40,000
What is economic rent? How does it differ from economic profit?
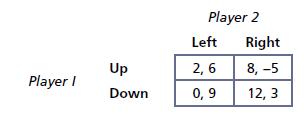
What is the Nash equilibrium in the following game? Player I Up Down Player 2 Left 2,6 0,9 Right 8,-5 12,3
What is the size of the deadweight loss in a competitive market with no government intervention?
In the competitive market for hard liquor, the demand is relatively inelastic and the supply is relatively elastic. Will the incidence of an excise tax of $T be greater for consumers or producers?
If an import tariff and an import quota lead to the same price in a competitive market, which one will lead to a larger domestic deadweight loss?
Under which of the programs listed above will the market clear? Briefly explain.
The demand curve for a certain good is P = 100 − Q. The marginal cost for a monopolist is MC(Q) = Q, for Q ⩽ 30. The maximum that can be supplied in this market is Q = 30, that is, the marginal cost is infinite for Q > 30.a) What price will the profit-maximizing monopolist set?b) What is the
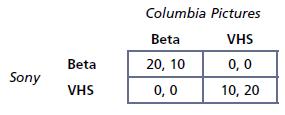
In the late 1970s, Sony, a manufacturer of video cassette players, and Columbia Pictures, a movie studio, played a game involving the choice of technology. Each firm had to decide whether to use the VHS or Beta format—Sony to make video players, Columbia to release its movies for rental or
Does a firm need to be a monopolist to price discriminate?
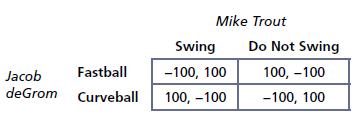
In a World Series game, Jacob deGrom is pitching and Mike Trout is batting. The count on Trout is three balls and two strikes. deGrom has to decide whether to throw a fastball or a curveball. Trout has to decide whether to swing or not swing. If deGrom throws a fastball and Trout doesn’t swing,
What is the expected value of a lottery? What is the variance?
What is Walras’ Law? What is its significance?
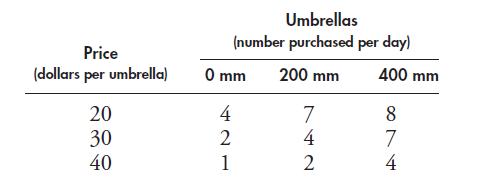
What happens in the graph in Problem 21 if the price rises and rainfall is constant?Data from in Problem 21The table gives data about umbrellas: price, the number purchased, and rainfall in millimetres (mm). Price (dollars per umbrella) 20 30 40 Umbrellas (number purchased per day) 0 mm 200
Draw a graph to show the relationship between the price and the number of umbrellas purchased, holding the amount of rainfall constant at 200 mm. Describe this relationship.The table gives data about umbrellas: price, the number purchased, and rainfall in millimetres (mm). Price (dollars per
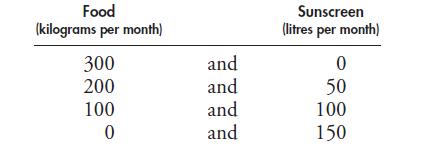
What feature of a PPF illustrates increasing opportunity cost? Explain why Yucatan’s opportunity cost does or does not increase.Suppose that Yucatan’s production possibilities are: Food (kilograms per month) 300 200 100 0 and and and and Sunscreen (litres per month) 0 50 100 150
Explain why Hong Kong has experienced faster economic growth than Canada.
Tim Hortons has exploded to become a dominant player among quick-serve restaurants. In 2001, it took the risk by switching to centralized production of baked goods, which lowered its labour costs and increased its sales volume.Draw a graph to show the effect of lower labour costs on the price of
What is the equilibrium price of a good or service?
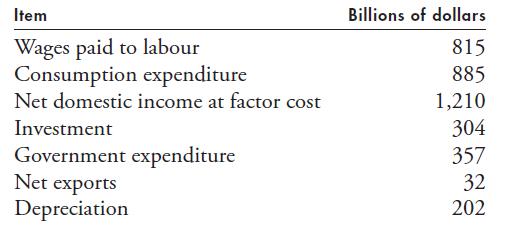
Explain the approach (expenditure or income) that you used to calculate GDP.The table lists some data for Canada in 2008. Item Wages paid to labour Consumption expenditure Net domestic income at factor cost Investment Government expenditure Net exports Depreciation Billions of
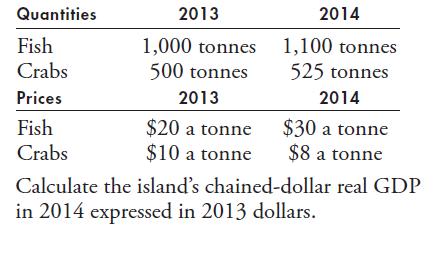
An island economy produces only fish and crabs.Calculate the island’s chained-dollar real GDP in 2014 expressed in 2013 dollars. Quantities Fish Crabs Prices Fish Crabs 2013 1,000 tonnes 500 tonnes 2013 $20 a tonne $10 a tonne 2014 1,100 tonnes 525 tonnes 2014 $30 a tonne $8 a tonne Calculate the
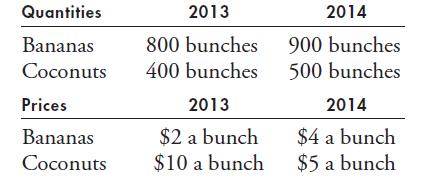
Calculate real GDP in 2014 in base-year prices.Tropical Republic produces only bananas and coconuts. The base year is 2013. Quantities Bananas Coconuts Prices Bananas Coconuts 2013 800 bunches 400 bunches 2013 $2 a bunch $10 a bunch 2014 900 bunches 500 bunches 2014 $4 a bunch $5 a bunch
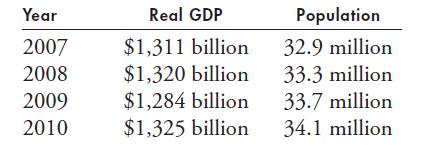
Explain in which of the years Canada’s standard of living (i) Increased and(ii) Decreased. Year 2007 2008 2009 2010 Real GDP $1,311 billion $1,320 billion $1,284 billion $1,325 billion Population 32.9 million 33.3 million 33.7 million 34.1 million
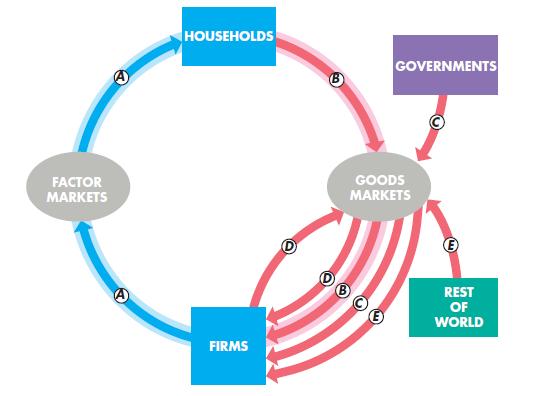
In 2014, flow D was $2 trillion, flow E was –$1 trillion, flow A was $10 trillion, and flow C was $4 trillion. Calculate consumption expenditure. FACTOR MARKETS HOUSEHOLDS FIRMS Q GOODS MARKETS DⓇ C GOVERNMENTS E E REST OF WORLD
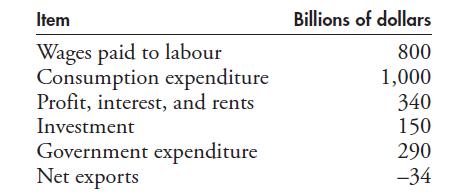
Explain the approach (expenditure or income) that you used to calculate GDP.The table lists some data for Xanadu in 2014. Item Wages paid to labour Consumption expenditure Profit, interest, and rents Investment Government expenditure Net exports Billions of dollars 800 1,000 340 150 290 -34
Describe the alternative measures of unemployment.
If the labour market is working properly, why would there be any unemployment at all?Matching people with available jobs is always difficult after a recession as the economy remakes itself. But labour market data suggest the disconnect is particularly acute this time. Since the recovery began, the
What is the natural unemployment rate?
Calculate the CPI basket and the percentage of the household’s budget spent on juice in 2013.The people on Coral Island buy only juice and cloth. The CPI basket contains the quantities bought in 2013. The average household spent $60 on juice and $30 on cloth in 2013 when juice was $2 a bottle and
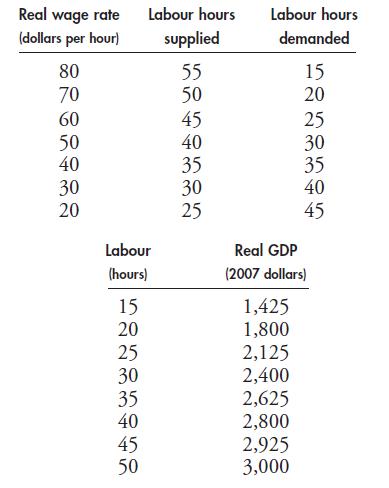
What are the equilibrium real wage rate and the quantity of labour employed in 2014?The first table describes an economy’s labour market in 2014 and the second table describes its production function in 2014. Real wage rate (dollars per hour) 80 70 60 50 40 30 20 Labour (hours) 15 20 Labour
South Africa’s real GDP was 1,900 billion rand in 2011 and 1,970 billion rand in 2012. South Africa’s population was 50.5 million in 2011 and 51.0 million in 2012. Calculate:a. The growth rate of real GDP.b. The growth rate of real GDP per person.c. The approximate number of years it will take
What are the preconditions for labour productivity growth?
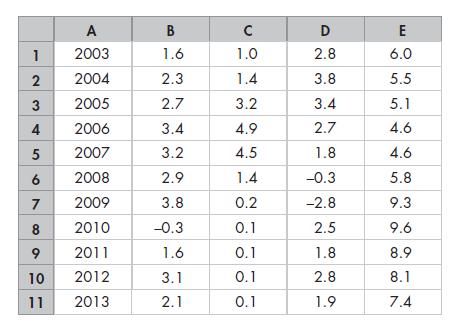
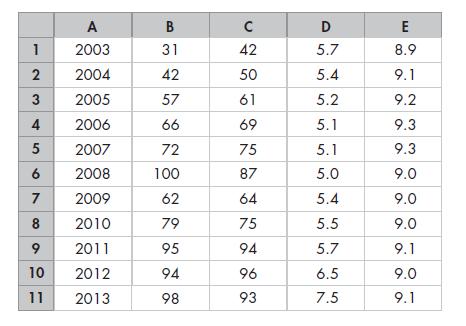
Draw a scatter diagram of the inflation rate and the interest rate. Describe the relationship.The spreadsheet provides the economic data: Column A is the year, column B is the inflation rate, column C is the interest rate, column D is the growth rate, and column E is the unemployment rate.
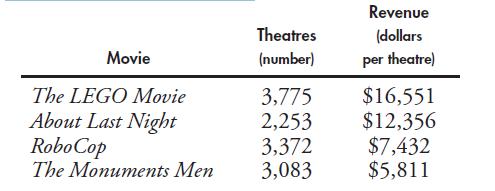
Draw a graph of the relationship between the revenue per theatre on the y -axis and the number of theatres on the x -axis. Describe the relationship.LEGO Tops the Box Office Movie The LEGO Movie About Last Night RoboCop The Monuments
Draw a scatter diagram of the growth rate and the unemployment rate. Describe the relationship.The spreadsheet provides the economic data: Column A is the year, column B is the inflation rate, column C is the interest rate, column D is the growth rate, and column E is the unemployment rate.
Draw a scatter diagram of the interest rate and the unemployment rate. Describe the relationship.The spreadsheet provides the economic data: Column A is the year, column B is the inflation rate, column C is the interest rate, column D is the growth rate, and column E is the unemployment rate.
Calculate the slope of the relationship in Problem 4 between 3,775 and 2,253 theatres.LEGO Tops the Box Office Movie The LEGO Movie About Last Night RoboCop The Monuments Men Theatres (number) 3,775 2,253 3,372 3,083 Revenue (dollars per theatre) $16,551 $12,356 $7,432 $5,811
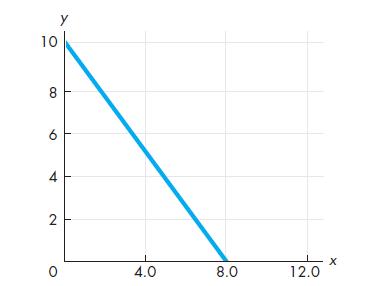
Calculate the slope of the following relationship. 10 8 6 4 2 0 у 4.0 8.0 12.0 X
Calculate the slope of the relationship in Problem 4 between 2,253 and 3,372 theatres.LEGO Tops the Box Office Movie The LEGO Movie About Last Night RoboCop The Monuments Men Theatres (number) 3,775 2,253 3,372 3,083 Revenue (dollars per theatre) $16,551 $12,356 $7,432 $5,811
The Russian government spent $6.7 billion on Olympic facilities and $16.7 billion upgrading Sochi area infrastructure. Sponsors spent $27.6 billion on hotels and facilities hoping to turn Sochi into a year-round tourist magnet. The Washington Post , February 11, 2014 Was the opportunity cost of the
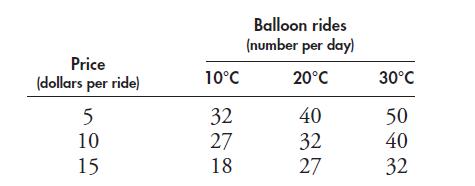
What happens in the graph in Problem 10 if the temperature rises to 30°C?The table gives the price of a balloon ride, the temperature, and the number of rides a day. Price (dollars per ride) 5 10 15 10°C 32 27 18 Balloon rides (number per day) 20°C 40 32 27 30°C 50 40 32
Draw a scatter diagram of the price of oil and the quantity of oil produced. Describe the relationship.The spreadsheet provides data on oil and gasoline: Column A is the year, column B is the price of oil (dollars per barrel), column C is the price of gasoline (cents per litre), column D is
Which of the following statements is positive, which is normative, and which can be tested?a. Canada should cut its imports.b. China is Canada’s largest trading partner.c. The federal government should increase the production of biofuels.
Draw a graph to show the relationship between the price and the number of rides when the temperature is 20°C. Describe this relationship.The table gives the price of a balloon ride, the temperature, and the number of rides a day. Price (dollars per ride) 5 10 15 10°C 32 27 18 Balloon
Eminem will hit the road with Rihanna offering an awesome deal—buy one and get one free! Mstars News , February 24, 2014 When Eminem gave away tickets, what was free and what was scarce? Explain your answer.
Draw a scatter diagram of the price of gasoline and the quantity of gasoline refined. Describe the relationship.The spreadsheet provides data on oil and gasoline:Column A is the year, column B is the price of oil (dollars per barrel), column C is the price of gasoline (cents per litre), column D is
When Costco opened a gas bar just off Highway 401, the neighbourhood was swamped with cars as drivers lined up to get the discount of 10 cents a litre.a. What is the opportunity cost of a litre of gas? Explain.b. To control the crowd, Costco hires traffic police. What is the tradeoff that Costco
Draw a scatter diagram of the quantity of oil produced and the quantity of gasoline refined. Describe the relationship.The spreadsheet provides data on oil and gasoline:Column A is the year, column B is the price of oil (dollars per barrel), column C is the price of gasoline (cents per litre),
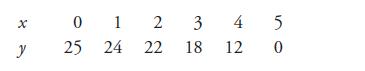
a. Is the relationship positive or negative?b. Does the slope of the relationship become steeper or flatter as the value of x increases?c. Think of some economic relationships that might be similar to this one.Draw a graph that shows the relationship between the two variables x and y: x y 012 3
Calculate the slope of the relationship between x and y when x equals 3.Draw a graph that shows the relationship between the two variables x and y: x y 012 3 4 25 24 22 18 12 5 0
Calculate the slope of the relationship across the arc as x increases from 4 to 5.Draw a graph that shows the relationship between the two variables x and y: x y 012 3 4 25 24 22 18 12 5 0
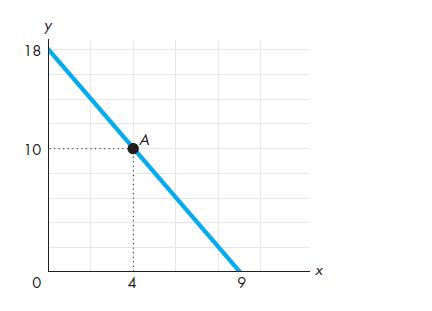
Calculate the slope of the curve in the figure in the next column at point A. 18 10 0 4 A 9 X
What happens in the graph in Problem 21 if the rainfall increases from 200 mm to 400 mm?Data from in Problem 21The table gives data about umbrellas: price, the number purchased, and rainfall in millimetres (mm). Price (dollars per umbrella) 20 30 40 Umbrellas (number purchased per day) 0 mm 200
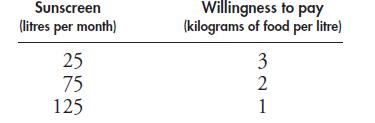
The table describes the preferences in Yucatan.a. What is the marginal benefit from sunscreen and how is it measured?b. Use the table in Problem 11. What does Yucatan produce to achieve allocative efficiency? Sunscreen (litres per month) 25 75 125 Willingness to pay (kilograms of food per
Showing 4200 - 4300
of 5615
First
36
37
38
39
40
41
42
43
44
45
46
47
48
49
50
Last
Step by Step Answers