New Semester Started
Get
50% OFF
Study Help!
--h --m --s
Claim Now
Question Answers
Textbooks
Find textbooks, questions and answers
Oops, something went wrong!
Change your search query and then try again
S
Books
FREE
Study Help
Expert Questions
Accounting
General Management
Mathematics
Finance
Organizational Behaviour
Law
Physics
Operating System
Management Leadership
Sociology
Programming
Marketing
Database
Computer Network
Economics
Textbooks Solutions
Accounting
Managerial Accounting
Management Leadership
Cost Accounting
Statistics
Business Law
Corporate Finance
Finance
Economics
Auditing
Tutors
Online Tutors
Find a Tutor
Hire a Tutor
Become a Tutor
AI Tutor
AI Study Planner
NEW
Sell Books
Search
Search
Sign In
Register
study help
business
probability statistics
Essential Statistics For The Behavioral Sciences 2nd Edition Gregory J Privitera - Solutions
What type of error is associated with decisions to retain the null hypothesis?
What type of error do we directly control?
A researcher selects a sample of 49 students to test the null hypothesis that the average student exercises 90 minutes per week. What is the mean for the sampling distribution for this population of interest if the null hypothesis is true?
For the following statements, write increases or decreases as an answer. The likelihood that we reject the null hypothesis (increases or decreases):1. The closer the value of a sample mean is to the value stated by the null hypothesis.2. The farther the value of a sample mean is from the value
If the null hypothesis is rejected, did we reach significance?
A test statistic is associated with a p value less than .05. What is the decision for this hypothesis test?
The criterion or level of significance in behavioral research is typically set at what probability value?
The decision in hypothesis testing is to retain or reject which hypothesis: null or alternative?
State the four steps of hypothesis testing.
True or false: Researchers select a sample from a population to learn more about characteristics in that sample.
On average, what do we expect the sample mean to be equal to?
Summarize the results of a one-sample z test in APA format.
Define power and identify six factors that influence power.
Elucidate effect size and compute a Cohen’s d for the one-sample z test.
Distinguish between a one-tailed test and a two-tailed test, and explain why a Type III error is possible only with one-tailed tests.
Calculate the one-sample z test and interpret the results.
Define Type I error and Type II error, and identify the type of error that researchers control.
Define null hypothesis, alternative hypothesis, level of significance, test statistic, p value, and statistical significance.
Identify the four steps of hypothesis testing.
The importance of sampling distributions. Turner and Dabney (2015) stated, “Sampling distributions play a key role in the process of statistical inference” (p. 23). Explain what the researchers meant by this statement.
Physical activity and enhanced mood. Williams, Dunsiger, Jennings, and Marcus (2012)conducted a study to test how enhanced mood during exercise can increase the likelihood of physical activity in the future. They reported that at 6 months of physical activity, mood scores(rated on a scale from −5
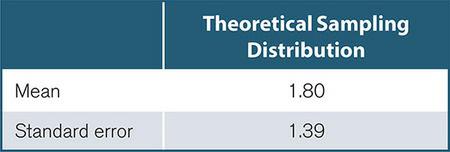
Classroom assessment: Standard error. In the Ryan (2006) study described in Question 28, participants selected 120 samples of size 3 from a population of 5 scores (0, 0, 0, 3, and 6) using theoretical sampling. Ryan reported the mean and standard error for the theoretical sampling distribution
Classroom assessment: Central limit theorem. In the Ryan (2006) study described in Question 28, participants selected 120 samples of size 3 from a population of 5 scores (0, 0, 0, 3, and 6) using theoretical sampling. Based on this example, 1. What is the shape of the population distribution? Hint:
Classroom assessment: Sampling and the population. Ryan (2006) reported about the effectiveness of an assignment given to students during a statistics class. The in-class assignment was aimed at helping students understand sampling distributions. In this study, participants selected 120 samples of
Sampling from the population. Olesen, Butterworth, Leach, Kelaher, and Pirkis (2013)selected a sample of 8,315 respondents from a population of about 22 million people who live in Australia to study the effects of mental health on employment status.1. Set up the calculation used to determine how
A sample of 26 scores is selected from a normally distributed population. State whether the standard error will increase or decrease if the sample size is changed to:1. n = 36 (b) n = 5 (c) n = 28 (d) n = 25
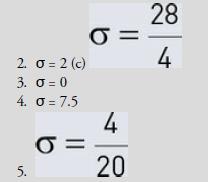
A population of scores is normally distributed with a standard deviation equal to 7. State whether the standard error will increase, decrease, or remain unchanged if the value of the population standard deviation is changed to:1. σ = 10 2. = 2 (c) 3. = 0 4. = 7.5 5. =0 = 4 20 28 4
A population is normally distributed with a mean of −30 and a standard deviation of 4.1. What is the mean of the sampling distribution (μM) for this population?2. If a sample of 16 participants is selected from this population, what is the standard error of the mean (σM)?3. Sketch the shape of
A population is normally distributed with a mean of 56 and a standard deviation of 12.1. What is the mean of the sampling distribution (μM) for this population?2. If a sample of 36 participants is selected from this population, what is the standard error of the mean (σM)?3. Sketch the shape of
A population with a positively skewed distribution of scores has a mean of 5 and a standard deviation of 4.1. What is the shape of the sampling distribution of the mean for this population?2. What is the mean of the sampling distribution for this population?3. Suppose a researcher selects two
State whether each of the following statements concerning the sample mean is true or false. If false, then explain what would make the statement true.1. The value of the sample mean equals the population mean on average.2. The value of the sample mean can vary from sample to sample.3. There is more
State whether each of the following statements is true or false. If false, then explain what would make the statement true.1. The central limit theorem explains why the mean is always at the center of a distribution.2. The standard error of the mean is the standard deviation of a sampling
Using the central limit theorem, what is the distribution of sample means when the population distribution is:1. rectangular?2. normal?3. positively skewed?4. nonmodal?5. multimodal?6. negatively skewed?
The sample mean is an unbiased estimator of the population mean. What do we expect the sample mean to be equal to when the population mean is equal to:1. μ = 8? (b) μ = 0? (c) μ = 20?2. μ = ∞? (e) μ = −40? (f) μ = 0.03?
Using the experimental sampling strategy, how many samples of size 3 (n = 3) can be drawn from a population of size:1. N = 5?2. N = 6?3. N = 7?4. N = 8?
Using the theoretical sampling strategy, how many samples of size 4 (n = 4) can be drawn from a population of size:1. N = 5?2. N = 8?3. N = 16?4. N = 50?
A support group has 12 patients who attend each week. Suppose 3 patients are selected at random to participate in a study. How many different samples of this size can be selected from this population of 12 patients using (a) experimental sampling and (b) theoretical sampling?
A local high school is interested in studying how teacher perceptions of students, as being intelligent or not, affect the success of freshman students in the classroom. The school creates an Excel spreadsheet listing all freshman students in alphabetical order and places their names into one of
A statistics instructor wants to measure the effectiveness of his teaching skills in a class of 102 students (N = 102). He selects students by waiting at the door to the classroom prior to his lecture and pulling aside every third student to give him or her a questionnaire.1. Is this sample design
How would the standard error change if (a) the population standard deviation increased and (b) the sample size increased?
The standard error measure is the standard deviation for what type of distribution?
What values do you need to know to compute the formula for standard error?
The sampling distribution of the sample mean approximates the shape of what type of distribution?
Can the mean of a sampling distribution be a negative value? Explain.
Explain why the following statement is true: μ = μM.
Define the central limit theorem.
The sample mean is an unbiased estimator of the population mean. Explain this statement.
Distinguish between sampling where order matters and sampling where order does not matter.
Distinguish between sampling with replacement and sampling without replacement.
Explain how conditional probabilities are related to sampling without replacement.
What is a sampling distribution?
Explain the following statement in words: μM = μ.
Compute a z transformation to find the z score, given the following measures: μ = 5, σM = 1.5, M = 8.
What formula is used to find the probability of obtaining a sample mean from a given population?
What are three ways that the standard error is reported in research journals?
Decreasing the _______________ will decrease the standard error.
Increasing the ______________ will decrease the standard error.
A psychologist selects a sample of 36 children from a population with a standard deviation of 12.Compute the standard error for this example.
Assuming the population standard deviation is known, state the formula for the standard error of the mean in words.
The ________________ states that regardless of the distribution of scores in a population, the sampling distribution of sample means selected from that population will approach the shape of a normal distribution, as the number of samples in the sampling distribution increases.
What is the standard error of the mean (σM) when the variance of the sampling distribution of sample means (σ2M) is equal to (a) 4, (b) 144, and (c) 1,225?
Suppose a population consists of a positively skewed distribution of scores. If we select all possible samples of size 10 from this population, then what will be the approximate shape of the sampling distribution of sample means?
A(n) ________________ is any sample statistic obtained from a randomly selected sample that equals the value of its respective population parameter on average.
If a random sample is selected from a population with a mean equal to 15, then what can we expect the value of the sample mean to be on average?
A researcher draws a sample of size 2 (n = 2) from a population of size 5 (N = 5). How many possible samples of this size can the researcher draw using experimental sampling?
State the two criteria for experimental sampling.
A researcher draws a sample of size 4 (n = 4) from a population of size 50 (N = 50). How many possible samples of this size can the researcher draw using theoretical sampling?
State the two criteria for theoretical sampling.
In Example 6.1, a researcher selected a sample of size 3 (n = 3) from a population of size 10 (N = 10). Using this same example, how many possible samples of size 3 can be selected using experimental sampling?
A researcher selects a sample of size 3 (n = 3) from a population of size 10 (N = 10). How many possible samples of size 3 can be selected using theoretical sampling?
Which sampling method is the most commonly used in behavioral research?
The number of left-handed people in a hypothetical population of 25 students is 8. What is the probability of selecting 2 left-handed people from this population when:1. Sampling with replacement?2. Sampling without replacement?
Which method for sampling is associated with equal probabilities for each selection, even with small sample sizes?
A researcher uses a sample ________ to make inferences about the value of a population ________ of interest.
Explain the relationship between standard error, standard deviation, and sample size.
Identify three characteristics of the sampling distribution of the sample mean
Compare theoretical and experimental sampling strategies.
Define sampling distribution
Can eating slower reduce how much we eat in a meal? In one variation of a study conducted by Privitera, Cooper, and Cosco (2012), participants were asked to eat fast or slow, and the amount consumed in their meal was recorded. In this study, participants who ate slowly consumed 627 ±183
Multicultural perceptions in education. Yang and Montgomery (2013) studied how teachers and prospective teachers perceive diversity in an educational environment. In their study, participants responded with their level of agreement to many statements regarding diversity on a scale from −5 (most
Preferences for specific body parts: The eyes. Montoya (2007) asked 56 men and 82 women to rate 21 different body parts on a scale of 1 (no opinion) to 5 (very desirable). They found that men and women rated the eyes similarly, with an average rating of about 3.77 ± 1.23 (M ± SD).Assuming these
Visual sequential memory and poor spellers. Holmes, Malone, and Redenbach (2008) found that good readers and good spellers correctly read 93.8 ± 2.9 (M ± SD) words from a spelling list.On the other hand, average readers and poor spellers correctly read 84.8 ± 3.0 (M ± SD) words from the same
The empirical rule and normal distributions. Ruxton, Wilkinson, and Neuhäuser (2015)stated that “researchers will frequently be required to consider whether a sample of data appears to have been drawn from a normal distribution” (p. 249). Based on the empirical rule, why is it informative to
The inaccuracy of lie detection. Maureen O’Sullivan (2007) stated that research on expert lie detection is “based on three assumptions: 1) Lie detection is an ability that can be measured; 2) This ability is distributed like many other abilities (i.e., normally); 3) Therefore, only a very few
A normal distribution has a standard deviation equal to 32. What is the mean of this normal distribution if the probability of scoring above x = 200 is .0228?
A normal distribution has a standard deviation equal to 10. What is the mean of this normal distribution if the probability of scoring below x = 10 is .5000?
A normal distribution has a mean equal to 10. What is the standard deviation of this normal distribution if the cutoff for the top 5% is x = 12.47?
A normal distribution has a mean equal to 45. What is the standard deviation of this normal distribution if 2.5% of the proportion under the curve lies to the right of x = 50.88?
A set of data is normally distributed with a mean of 3.5 and a standard deviation of 0.6. State whether the first area is bigger, the second area is bigger, or the two areas are equal in each of the following situations for these data:1. The area above the mean and the area below the mean 2. The
A set of scores measuring aggression is normally distributed with a mean equal to 23 and a standard deviation equal to 2.5. Find the proportion:1. To the left of x = 19.0 2. To the right of x = 25.5 3. Between the mean and x = 19.0 4. To the left of x = 25.5 5. To the right of x = 19.0
A college administrator states that the average high school GPA for incoming freshman students is normally distributed with a mean equal to 3.30 and a standard deviation equal to 0.20. If students with a GPA in the top 10% will be offered a scholarship, then what is the minimum GPA required to
A sample of final exam scores is normally distributed with a mean equal to 20 and a variance equal to 25.1. What percentage of scores is between 15 and 25?2. What raw score is the cutoff for the top 10% of scores?3. What is the probability of a score less than 27?4. What is the proportion below 13?
State the z score that is the cutoff for each of the following:1. The top 5% of scores 2. The bottom 2.5% of scores 3. The top 69.5% of scores 4. The top 50% of scores 5. The bottom 50% of scores
An athletics coach states that player run times (in seconds) for a 100-meter dash are normally distributed with a mean equal to 0.12 and a standard deviation equal to 0.02 second. What percentage of players on the team run the 100-meter dash in 0.14 seconds or faster (i.e., in less time)?
State whether the first area is bigger, the second area is bigger, or the two areas are equal in each of the following situations:1. The area to the left of z = 1.00 and the area to the right of z = −1.00 2. The area to the left of z = 1.00 and the area to the left of z = −1.00 3. The area
Using the unit normal table, find the proportion under the standard normal curve that lies between each of the following:1. The mean and z = 0 2. The mean and z = 1.96 3. z = −1.50 and z = 1.50 4. z = −0.30 and z = −0.10 5. z = 1.00 and z = 2.00
Using the unit normal table, find the proportion under the standard normal curve that lies to the left of each of the following:1. z = 0.50 2. z = −1.32 3. z = 0 4. z = −1.96 5. z = −0.10
Using the unit normal table, find the proportion under the standard normal curve that lies to the right of each of the following:1. z = 1.00 2. z = −1.05 3. z = −2.80 4. z = 0 5. z = 1.96
On the basis of statistics from the previous 3 years, a maternity ward states that 97% of patients say they are satisfied with their birthing experience. If 100,000 patients gave birth in that maternity ward over the previous 3 years, then how many patients do we expect were not satisfied with
A hypothetical population consists of eight individuals ages 13, 14, 17, 20, 21, 22, 24, and 30 years.1. What is the probability that a person in this population is a teenager?2. What is the probability of selecting a participant who is at least 20 years old?3. What is the probability of selecting
Showing 2600 - 2700
of 8686
First
20
21
22
23
24
25
26
27
28
29
30
31
32
33
34
Last
Step by Step Answers