New Semester Started
Get
50% OFF
Study Help!
--h --m --s
Claim Now
Question Answers
Textbooks
Find textbooks, questions and answers
Oops, something went wrong!
Change your search query and then try again
S
Books
FREE
Study Help
Expert Questions
Accounting
General Management
Mathematics
Finance
Organizational Behaviour
Law
Physics
Operating System
Management Leadership
Sociology
Programming
Marketing
Database
Computer Network
Economics
Textbooks Solutions
Accounting
Managerial Accounting
Management Leadership
Cost Accounting
Statistics
Business Law
Corporate Finance
Finance
Economics
Auditing
Tutors
Online Tutors
Find a Tutor
Hire a Tutor
Become a Tutor
AI Tutor
AI Study Planner
NEW
Sell Books
Search
Search
Sign In
Register
study help
business
probability statistics
Essential Statistics For The Behavioral Sciences 2nd Edition Gregory J Privitera - Solutions
What are two steps to locate the cutoff score for a given proportion?
What are two steps to locate proportions under the normal curve?
State the standard normal transformation formula in words.
What is a z score?
What are the values of the mean and the standard deviation in the standard normal distribution?
A normal distribution has a mean of 0 and a standard deviation of −1.0. Is this possible? Explain.
What type of distribution is most commonly applied to behavioral research?
The normal distribution is symmetrical. What does this mean?
State two characteristics of a probability.
Describe in words how to compute p(x).
State the z score that most closely approximates the following probabilities:1. Top 10% of scores 2. Bottom 10% of scores 3. Top 50% of scores
What are the z scores associated with the following probabilities toward the tail in a normal distribution?1. .4013 2. .3050 3. .0250 4. .0505
State the two steps for locating the cutoff score for a given proportion of data.
Find the probability of a score between the following z scores:1. The mean and 1.40 2. −1.00 and 1.00 3. 60 and 1.20
Find the probability of a score at or below the following z scores:1. 0.08 2. −1.00 3. 2.90
Find the probability of a score at or above the following z scores:1. 1.23 2. −2.50 3. 0.50
State the two steps for locating the proportion of scores in any normal distribution.
Complete the following sentence: The normal distribution is used to determine the probability of a certain outcome _______ to all other outcomes.
Identify the column in the unit normal table for each of the following:1. The z scores 2. The area from each z score toward the tail 3. The area between each z score and the mean
A set of data is normally distributed with a mean equal to 10 and a standard deviation equal to 3.Compute a z transformation for each of the following scores in this normal distribution:1. −2 2. 10 3. 3 4. 16 5. 0
What term is often used to describe behavior that falls within 2 SD of the mean in a normal distribution?
The area under a normal curve ranges between 0 and 1 and can never be negative. What type of statistic also has these same characteristics?
A normal distribution has a mean equal to 5. What is the value of the median and mode in this distribution?
All of the following characteristics are true about a normal distribution, except:1. The mean can be any positive or negative number.2. The variance can be any positive number.3. The shape of the normal distribution is symmetrical.4. The tails of a normal distribution touch the x-axis at 3 SD from
Suppose we want to determine the z score for the mean of a normal distribution. The z transformation for the mean of any normal distribution will always equal what z score value?
State whether each of the following is an appropriate probability.1. p = .88 2. p = –.26 3. p = 1.45 4. p = 1.00
A researcher has participants complete a computer task where they can choose to play one of 200 games.Of the 200 games, only 80 are set up so that participants can win the game.1. What is the event in this example?2. What is the outcome, x, in this example?3. What is the probability that a
Distinguish between a random event and a fixed event.
____________ is the proportion or fraction of times an outcome is likely to occur.
Convert raw scores to standard z scores using SPSS.
Locate scores in a normal distribution with a given probability.
Locate proportions of area under any normal curve above the mean, below the mean, and between two scores.
Define the standard normal distribution and compute the standard normal transformation.
Identify eight characteristics of the normal distribution.
Identify and compute a simple probability.
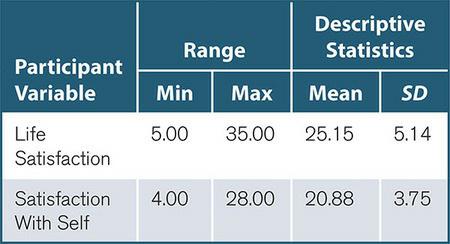
Acceptable height preferences. Pérez Escoda and Alegre (2016) studied how emotional intelligence moderates the relationship between various levels of life satisfaction. As part of their study, they measured participant life satisfaction or their personal satisfaction with themselves. The following
Total wellness among Citadel cadets. Gibson and Myers (2006) investigated perceived wellness among freshman military cadets at the Citadel academy. Cadets completed the Five Factor Wellness Inventory to measure their perceived wellness pertaining to creative, coping, social, essential, and physical
Showing love in marriage. Schoenfeld, Bredow, and Huston (2012) had couples who were married complete a rating scale indicating their feelings of love for their partners—that is, “the extent to which [they] felt a sense of closeness, belonging, and attachment to their partners” (p.1400).
Conscientious Responders. Marjanovic, Holden, Struthers, Cribbie, and Greenglass (2014)tested an index to discriminate between conscientious and random responders to surveys. As part of their study, they had participants complete the Conscientious Responders Scale (CRS; Marjanovic, Struthers,
A school administrator has students rate the quality of their education on a scale from 1 (poor)to 7 (exceptional). She claims that 99.7% of students rated the quality of their education between 3.5 and 6.5. If the mean rating is 5.0, then what is the standard deviation assuming the data are
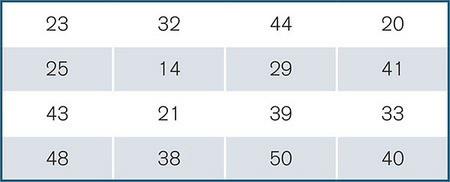
A professor records the time (in minutes) that it takes 16 students to complete an exam.Compute the SS, the variance, and the standard deviation (a) assuming the 16 students constitute a population and (b) assuming the 16 students constitute a sample. 23 32 44 20 25 14 29 29 41 43 21 39 33 48 38 50
A social psychologist records the age (in years) that a sample of eight participants first experienced peer pressure. The recorded ages for the participants are 14, 20, 17, 16, 12, 16, 15, and 16. Compute the SS, the variance, and the standard deviation for this sample using the definitional and
An expert reviews a sample of 10 scientific articles (n = 10) and records the following number of errors in each article: 0, 4, 2, 8, 2, 3, 1, 0, 5, and 7. Compute the SS, the variance, and the standard deviation for this sample using the definitional and computational formulas.
A psychologist measures a sample of scores on a love quiz, where SD = 4 points. State the new value for SD if the psychologist (a) adds 2 points to each quiz score and (b) doubles each quiz score.
If the example in Question 22 were a population of scores, would the values for the variance and standard deviation change? If so, how?
A sample of 60 scores is distributed with SS = 240. What is the sample variance and sample standard deviation for this distribution?
A researcher measures the time (in seconds) it takes a sample of five participants to complete a memory task. It takes four of the participants 5, 6, 6, and 7 seconds. If M = 6, then what must be the fifth time recorded?
State whether each of the following will increase, decrease, or have no effect on the population variance.1. The sum of squares (SS) increases.2. The sample size decreases.3. The size of the population increases.
Suppose the population variance for a given population is 36. If we select all possible samples of a certain size from this population, then, on average, what will be the value of the sample variance?
If the value of the SS remains constant, state whether each of the following will increase, decrease, or have no effect on the sample variance.1. The sample size increases.2. The degrees of freedom decrease.3. The size of the population increases.
A student computes a variance of 9. Will the standard deviation differ if 9 is the value for a population versus a sample variance? Explain.
A student computes a standard deviation of 12. Will the variance differ if 12 is the value for a population versus a sample standard deviation? Explain.
A psychopathologist records the number of criminal offenses among teenage drug users in a nationwide sample of 1,201 participants. To measure the variance of criminal offenses, he computes SS = 10,800 for this sample. (a) What are the degrees of freedom for variance? (b) Compute the variance and
A behavioral scientist measures attention in a sample of 31 participants. To measure the variance of attention, she computes SS = 120 for this sample. (a) What are the degrees of freedom for variance? (b) Compute the variance and standard deviation.
If Sample 1 has a variance of 4 and Sample 2 has variance of 32, can we tell which sample had a larger range? If so, which sample had a greater range?
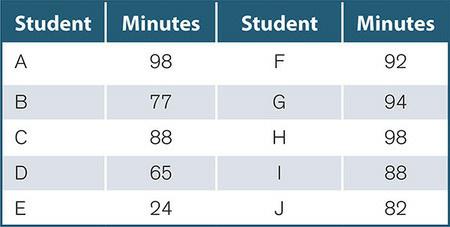
Suppose the researcher selects a sample of eight students from the population in Question 11.The sample consists of persons A, B, C, F, G, H, I, and J.1. What is the range of data in this sample?2. What is the IQR of data in this sample?3. What is the SIQR of data in this sample?4. What is the
A social scientist measures the number of minutes (per day) that a small hypothetical population of college students spends online.1. What is the range of data in this population?2. What is the IQR of data in this population?3. What is the SIQR of data in this population?4. What is the population
State four characteristics of the standard deviation.
Based on the empirical rule, what percentage of data fall within 1 SD, 2 SD, and 3 SD of the mean for data that are distributed normally?
What does the standard deviation measure?
Explain why deviations from the mean are squared in the formula for variance.
What does it mean to say that the sample variance is unbiased?
What are the degrees of freedom for sample variance?
Why is variance, as a measure of variability, preferred to the range, the IQR, and the SIQR?
What is the interquartile range?
How many scores are included to compute the range?
You read a claim that variability is negative. Is this possible? Explain.
An instructor measures the following quiz scores: 6, 8, 7, and 9 (SD = 1.29). If the instructor subtracts two points from each quiz score, how will the value for the standard deviation change?
Each of the following is a characteristic of standard deviation, except:1. The standard deviation is always positive.2. The standard deviation is affected by the value of every score in a distribution.3. The standard deviation is used to describe qualitative variables.4. Standard deviations are
How many standard deviations from the mean will contain at least 99% of data for any type of distribution? Hint: Refer to the Making Sense section.
The empirical rule is stated for data with what type of distribution?
The population variance is 121. What is the standard deviation for this population?
The sample variance is 121. What is the standard deviation for this sample?
The standard deviation is a measure used to determine the average distance that each score deviates from ________.
How do you compute standard deviation?
A researcher measures the following sample of scores (n = 3): 1, 4, and 7. (a) Use the definitional formula to calculate variance. (b) Use the computational formula to calculate variance. (c) Are your answers the same?
True or false: With identical data sets, the definitional and computational formula for sample variance will always produce the same solution, give or take rounding error.
How is the computational formula different from the definitional formula for variance?
A researcher records five scores: 3, 4, 5, 6, and x. If the mean in this distribution is 5, then what is the value for x?
True or false: The sample variance is unbiased when dividing SS by (n − 1).
How many scores are free to vary in a sample?
Why do we square each deviation in the numerator of variance?
True or false: A scientist measures the following data: 23, 23, 23, 23, 23, and 23. The value for the sample variance and population variance will be the same.
A researcher measures the following data: 3, 3, 3, 4, 4, and 4. What is the sample variance for these data?
How does calculating the sample variance differ from calculating the population variance?
True or false: When all scores in a population are the same, the variance will always be equal to 0.
A researcher measures the following scores: 12, 14, 16, 18, and 20. Compute the SS for these data.
Describe the sum of squares (SS) in words.
A researcher selects a population of eight scores where SS = 72. What is the population variance in this example?
Why is the variance a preferred measure of variability?
A researcher records the number of times that 10 students cough during a final exam. He records the following data: 0, 0, 0, 3, 3, 5, 5, 7, 8, and 11. True or false: In this example, the range will be smaller than the interquartile range.
When data are divided into four equal parts, the data are split into ________.
A researcher collects the following scores: 1, 2, 3, 4, 5, 6, 7, and 8. What is the range of these scores?
What is the formula for computing the range?
_______________ is a measure of the dispersion or spread of scores in a distribution and ranges from 0 to +∞.
Explain why the sample variance and population variance are computed differently.
Social support and stroke-induced aphasia. Hilari and Northcott (2006) used a Social Support Survey (SSS) to gauge how well supported individuals suffering from stroke-induced aphasia (a language disorder) felt more than one year following the stroke. They reported that “in terms of social
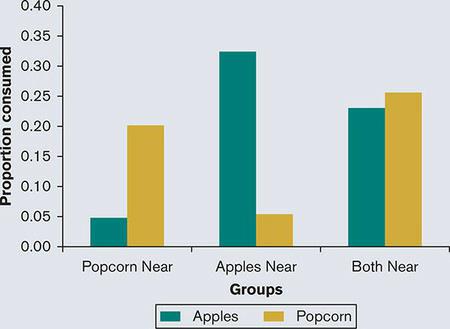
The convenience of eating. Privitera and Zuraikat (2014) conducted a study to test whether the proximity of food influences consumption. They placed a bowl of popcorn or apple slices in a container on a table (near) or 2 meters from a participant (far). Do the data in the figure given here support
Helping smokers quit by race. Patten and colleagues (2008) stated that “among nonsmokers who indicated they were close to a smoker whom they thought should quit, Black [participants]were most often concerned about a family member whereas White [participants] endorsed concern most often for a
Gender differences with money. Furnham, von Stumm, and Fenton-O’Creevy (2015), in a study about why males and females spend money, stated that “money was associated with generosity(money representing love) where males scored much lower than females, and autonomy (money representing freedom)
Showing 2700 - 2800
of 8686
First
21
22
23
24
25
26
27
28
29
30
31
32
33
34
35
Last
Step by Step Answers