New Semester Started
Get
50% OFF
Study Help!
--h --m --s
Claim Now
Question Answers
Textbooks
Find textbooks, questions and answers
Oops, something went wrong!
Change your search query and then try again
S
Books
FREE
Study Help
Expert Questions
Accounting
General Management
Mathematics
Finance
Organizational Behaviour
Law
Physics
Operating System
Management Leadership
Sociology
Programming
Marketing
Database
Computer Network
Economics
Textbooks Solutions
Accounting
Managerial Accounting
Management Leadership
Cost Accounting
Statistics
Business Law
Corporate Finance
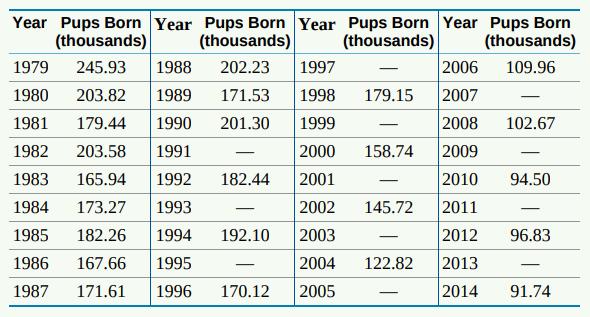
Finance
Economics
Auditing
Tutors
Online Tutors
Find a Tutor
Hire a Tutor
Become a Tutor
AI Tutor
AI Study Planner
NEW
Sell Books
Search
Search
Sign In
Register
study help
business
probability statistics
Statistics For The Behavioral Sciences 4th Edition Gregory J Privitera - Solutions
2.11 x and s Are Not Enough. The mean and standard deviation s measure center and variability but are not a complete description of a distribution. Data sets with different shapes can have the same mean and standard deviation. To demonstrate this fact, use your calculator to find x and s for these
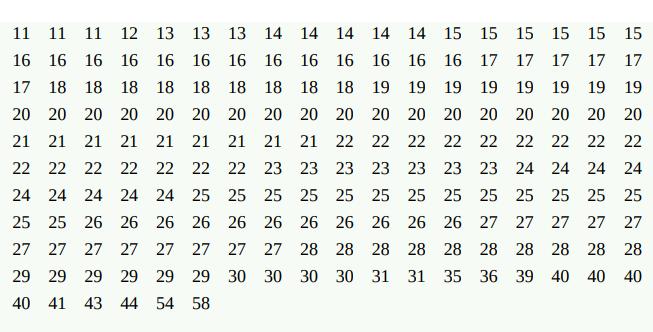
2.10 x and s by Hand. Radon is a naturally occurring gas and is the second leading cause of lung cancer in the United States. 11 It comes from the natural breakdown of uranium in the soil and enters buildings through cracks and other holes in the foundations. Found throughout the United States,
2.9 Fuel Economy for Midsize Cars. Exercise 2.7 (page 55) gives the estimated miles per gallon (mpg) for city driving for the 186 cars classified as midsize in 2016. In that exercise, we noted that several of the mpg values were unusually large. Which of these are suspected outliers by the 1.5 IQR
2.8 Travel Time to Work. In Example 2.1 (page 48), we noted the influence of one long travel time of 60 minutes in our sample of 15 North Carolina workers. Does the 1.5 IQR rule identify this travel time as a suspected outlier? NCTRAVEL
2.7 Fuel Economy for Midsize Cars. The Department of Energy provides fuel economy ratings for all cars and light trucks sold in the United States. Here are the estimated miles per gallon for city driving for the 186 cars classified as midsize in 2016, arranged in increasing order: MIDCARS(a) Give
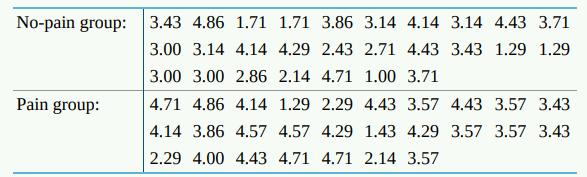
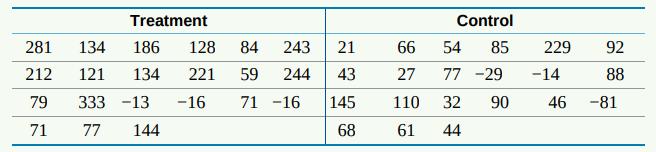
2.6 Shared Pain and Bonding. Although painful experiences are involved in social rituals in many parts of the world, little is known about the social effects of pain. Will sharing painful experiences in a small group lead to greater bonding of group members than sharing a similar non-painful
2.5 Carbon Dioxide Emissions. Burning fuels in power plants and motor vehicles emits carbon dioxide (CO2), which contributes to global warming. The CO2 emissions (metric tons per capita) for countries varies from 0.02 in Burundi to 44.02 in Qatar. Although the data set includes 214 countries, the
2.4 New House Prices. The mean and median sales prices of new homes sold in the United States in February 2016 were $301,400 and $348,900, respectively.5 Which of these numbers is the mean and which is the median? Explain how you know.
2.2 Health Care Spending. Table 1.3 (page 32) gives the 2013 health care expenditure per capita in 35 countries with the highest gross domestic product in 2013. The United States, at 9146 international dollars per person, is a high outlier. Find the mean health care spending in these nations with
2.1 E. Coli in Swimming Areas. To investigate water quality, the Columbus Dispatch took water specimens at 16 Ohio State Park swimming areas in central Ohio. Those specimens were taken to laboratories and tested for E. coli, which are bacteria that can cause serious gastrointestinal problems. For
1.46 Choosing class intervals. Student engineers learn that, although handbooks give the strength of a material as a single number, in fact the strength varies from piece to piece. A vital lesson in all fields of APPLET study is that "variation is everywhere." Here are data from a typical student
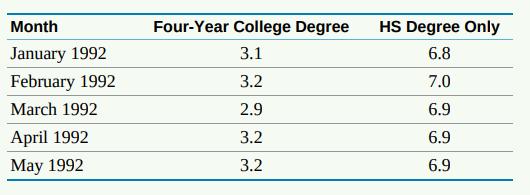
1.45 the first five months: 34 UNEMPLOY Month Four-Year College Degree HS Degree Only January 1992 3.1 6.8 February 1992 3.2 7.0 March 1992 2.9 6.9 April 1992 3.2 6.9 May 1992 3.2 6.9 (a) Make a time plot of the monthly unemployment rates for those over 25 years of age with a high school diploma
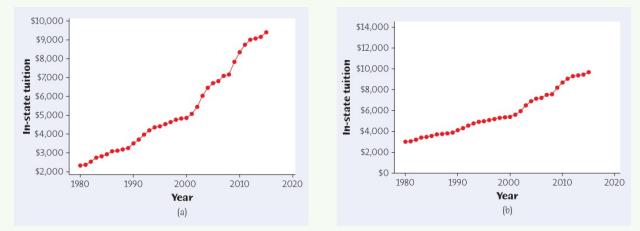
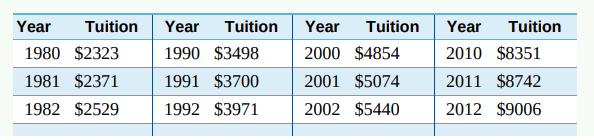
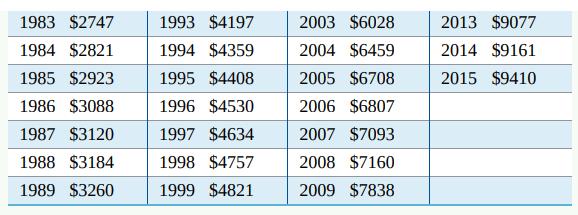
1.43 Watch those scales! Figures 1.18(a) and 1.18(b) both show time plots of tuition charged to in-state students from 1980 through 2015.33 (a) Which graph appears to show the biggest increase in tuition between 2000 and 2015? (b) Read the graphs and compute the actual increase in tuition between
1.42 She sounds tall! Presented with recordings of a pair of people of the same sex speaking the same phrase, can a listener determine which speaker is taller simply from the sound of their voice? Twenty-four young adults at Washington University listened to 100 pairs of speakers and, within each
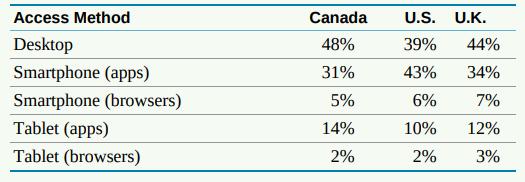
1.41 Accessing digital media in the U.S., Canada, and the U.K. Most mobile usage occurs via apps, particularly on smartphones, with time on smartphone apps now surpassing time spent on desktops in the United States. Digital media can be accessed on mobile platforms by using apps on a smartphone or
1.40 Marijuana and traffic accidents. Researchers in New Zealand interviewed 907 drivers at age 21. They had data on traffic accidents, and they asked the drivers about marijuana use. Here are data on the numbers of accidents caused by these drivers at age 19, broken down by marijuana use at the
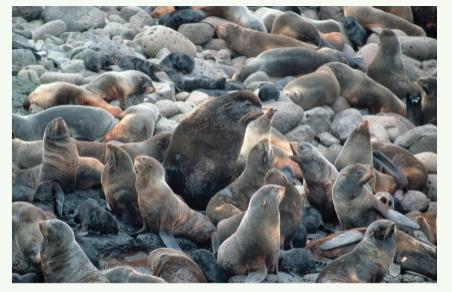
1.39 Fur seals on St. Paul Island. Make a time plot of the number of fur seals born per year from Exercise 1.37. What does the time plot show that your stemplot in Exercise 1.37 did not show? When you have data collected over time, a time plot is often needed to understand what is happening.
1.38 Nintendo and laparoscopic skills. In laparoscopic surgery, a video camera and several thin instruments are inserted into the patient’s abdominal cavity. The surgeon uses the image from the video camera positioned inside the patient’s body to perform the procedure by manipulating the
1.37 Fur seals on St. Paul Island. Every year, hundreds of thousands of northern fur seals return to their haul-outs in the Pribilof Islands in Alaska to breed, give birth, and teach their pups to swim, hunt, and survive in the Bering Sea. U.S. commercial fur sealing operations continued on St.
1.36 Child mortality rates. Although child mortality rates have dropped by more than 50% since 1990, in 2015 it was still the case that 16,000 children under five years old died each day. The mortality rates for children under five varied from 1.9 per 1000 in Luxembourg to 156.9 per 1000 in Angola.
1.35 Where are the nurses? Table 1.5 gives the number of active nurses per 100,000 people in each state. 26 NURSES (a) Why is the number of nurses per 100,000 people a better measure of the availability of nurses than a simple count of the number of nurses in a state? (b) Make a stemplot that
1.34 Food oils and health. Fatty acids, despite their unpleasant name, are necessary for human health. Two types of essential fatty acids, called omega-3 and omega- 6, are not produced by our bodies and so must be obtained from our food. Food oils, widely used in food processing and cooking, are
1.33 Name that variable. A survey of a large college class asked the following questions: 1. Are you female or male? (In the data, male = 0, female = 1.) 2. Are you right-handed or left-handed? (In the data, right = 0, left = 1.) 3. What is your height in inches? 4. How many minutes do you study on
1.32 Returns on common stocks. The return on a stock is the change in its market price plus any dividend payments made. Total return is usually expressed as a percent of the beginning price. Figure 1.16 is a histogram of the distribution of the monthly returns for all stocks listed on U.S. markets
1.31 IQ test scores. Figure 1.15 is a stemplot of the IQ test scores of 78 seventh- grade students in a rural midwestern school. 23 IQ (a) Four students had low scores that might be considered outliers. Ignoring these, describe the shape, center, and variability of the remainder of the
1.30 Do adolescent girls eat fruit? We all know that fruit is good for us. Many of us don't eat enough. Figure 1.14 is a histogram of the number of servings of fruit per day claimed by 74 seventeen-year-old girls in a study in Pennsylvania.22 Describe the shape, center, and variability of this
1.29 Time spent on mobile apps. Social media and entertainment account for two- thirds of the time spent on mobile apps, with those between 18 and 34 spending approximately two hours a day using social media and entertainment apps. Social media apps have become the primary platform for users to
1.28 Student debt. At the end of 2014, the average outstanding student debt for graduate and undergraduate study combined was $26,700, yielding a total outstanding student debt of $1.16 trillion. Figure 1.13 is a pie chart to show the distribution of outstanding education debt. 20 About what
1.27 Deaths among young people. Among persons aged 15-24 years in the United States, there were 28,486 deaths in 2013. The leading causes of death and number of deaths were: accidents, 11,619; suicide, 4878; homicide, 4329; cancer, 1496; heart disease, 1170; congenital defects, 362.19 (a) Make a
1.26 High school tobacco use. Despite the intense anti-smoking campaigns sponsored by both federal and private agencies, smoking continues to be the single-biggest cause of preventable death in the United States. How has the tobacco use of high school students changed over the past few years? For
1.25 What color is your car? The most popular colors for cars and light trucks vary with region, type of vehicle, and over time. In North America, silver and gray are the most popular choices for midsize cars, black and red for sports cars, and white for light trucks. Despite this variation,
1.24 Buying a refrigerator. Consumer Reports will have an article comparing refrigerators in the next issue. Some of the characteristics to be included in the report are the brand name and model; whether it has a top, bottom, or side-by- side freezer; the estimated energy consumption per year
1.23 Medical students. Students who have finished medical school are assigned to residencies in hospitals to receive further training in a medical specialty. Here is part of a hypothetical database of students seeking residency positions. USMLE is the student's score on Step 1 of the national
1.22 You look at real estate ads for houses in Naples, Florida. There are many houses ranging from $200,000 to $500,000 in price. The few houses on the water, however, have prices up to $15 million. The distribution of house prices will be (a) skewed to the left. (b) roughly symmetric. (c) skewed
1.21 The state with the smallest percent of first-year students enrolled in the state has (a) 0.34% enrolled. (b) 3.4% enrolled. (c) 34% enrolled.
1.20 The shape of the distribution in Exercise 1.19 is (a) skewed to the left. (b) skewed upward. (c) skewed to the right.
1.19 Where do students go to school? Although 80.4% of first-time first-year students attended college in the state in which they lived, this percent varied considerably over the states. Here is a stemplot of the percent of first-year students in each of the 50 states who were from the state where
1.18 Here are the exam scores of 10 students in a statistics class: 50 35 41 97 76 69 94 91 23 65 To make a stemplot of these data, you would use stems (a) 2, 3, 4, 5, 6, 7, 9. (b) 2, 3, 4, 5, 6, 7, 8, 9. (c) 20, 30, 40, 50, 60, 70, 80, 90.
1.17 Figure 1.6 (page 26) is a histogram of the percent of on-time high school graduates in each state. The rightmost bar in the histogram covers percents of on-time high school graduates ranging from about (a) 87% to 90%. (b) 88% to 92%. (c) 90% to 93%.
1.16 A political party's data bank includes the zip codes of past donors, such as 47906 34236 53075 10010 90210 75204 30304 99709 Zip code is a (a) quantitative variable. (b) categorical variable.(c) unit of measurement.
1.15 A description of different houses on the market includes the variables square footage of the house and the average monthly gas bill. (a) Square footage and average monthly gas bill are both categorical variables. (b) Square footage and average monthly gas bill are both quantitative variables.
1.14 According to the National Household Survey on Drug Use and Health, when asked in 2012, 41% of those aged 18 to 24 years used cigarettes in the past year, 9% used smokeless tobacco, 36.3% used illicit drugs, and 10.4% used pain relievers or sedatives.15 To display this data, it would be correct
1.13 Here are the first lines of a professor's data set at the end of a statistics course: Name Major Total Points Grade ADVANI, SURA COMM 397 B BARTON, DAVID HIST 323 BROWN, ANNETTE BIOL 446 A CHIU, SUN PSYC 405 B CORTEZ, MARIA PSYC 461 A The individuals in these data are (a) the students. (b) the
1.12 The Cost of College. Here are data on the average tuition and fees charged to in-state students by public four-year colleges and universities for the 1980 to 2015 academic years. Because almost any variable measured in dollars increases over time due to inflation (the falling buying power of a
1.11 Health Care Spending. Table 1.3 shows the 2013 per capita total expenditure on health in 35 countries with the highest gross domestic product in that year. 12 Health expenditure per capita is the sum of public and private health expenditure (in PPP, international $) divided by population.
1.10 The StatsBoards videos, Creating and Interpreting a Histogram and Creating and Interpreting a Stemplot, provide the details of constructing both stemplots and histograms through an example. APPLY YOUR KNOWLEDGE The Changing Face of America. Figure 1.10 gives a stemplot of the percentages of
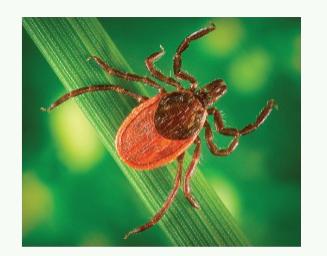
1.9 Lyme Disease. Lyme disease is caused by a bacteria called Borrelia burgdorferi and is spread through the bite of an infected black-legged tick, generally found in woods and grassy areas. There were 213,515 confirmed cases reported to the Centers for Disease Control (CDC) between 2001 and 2010,
1.8 The Changing Face of America. In Exercise 1.6 (page 23), you made a histogram of the percent of minority residents aged 18-34 in each of the 50 states and the District of Columbia. These data are given in Table 1.2. Describe the shape of the distribution. Is it closer to symmetric or skewed?
1.7 APPLET Choosing Classes in a Histogram. The data set menu that accompanies the One-Variable Statistical Calculator applet includes the data on the percent minorities between the ages of 18 and 34 in the states from Table 1.2. Choose these data, then click on the "Histogram" tab to see a
1.6 The Changing Face of America. In 1980, approximately 20% of adults aged 18-34 were considered minorities, reporting their ethnicity as other than non- Hispanic white. By the end of 2013, that percentage had more than doubled. How are minorities between the ages of 18 and 34 distributed in the
1.5 Never on Sunday? Births are not, as you might think, evenly distributed across the days of the week. Here are the average numbers of babies born on each day of the week in 2014:5 BIRTHS Day Sunday Monday Tuesday Wednesday Thursday Friday Saturday Births 7,371 11,805 12,630 12,155 12,112 12,042
1.4 How Do Students Pay for College? The Higher Education Research Institute's Freshman Survey includes more than 200,000 first-time, full-time freshmen who entered college in 2015.4 The survey reports the following data on the sources students use to pay for college expenses: Source for College
1.3 Social Media Preferences for Younger Audiences. Facebook remains the top choice of social media over all ages, with 65% using Facebook most often among those using social media sites. However, more visually oriented social networks such as Snapchat and Instagram continue to draw in younger
1.2 Students and Exercise. You are preparing to study the exercise habits of college students. Describe two categorical variables and two quantitative variables that you might measure for each student. Give the units of measurement for the quantitative variables.
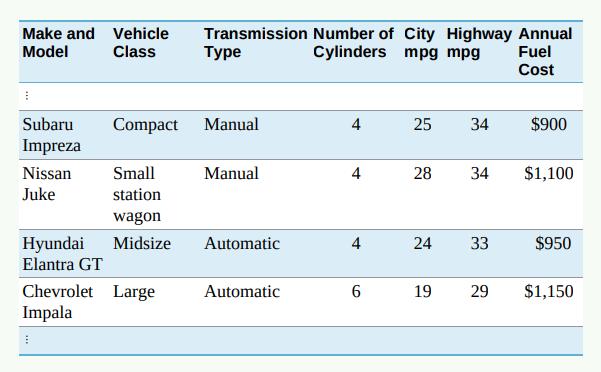
1.1 Fuel Economy. Here is a small part of a data set that describes the fuel economy in miles per gallon (mpg) of model year 2016 motor vehicles:The annual fuel cost is an estimate assuming 15,000 miles of travel a year (55% city and 45% highway) and an average fuel price. (a) What are the
Which of the following summarizes, using APA format, a t test that was significant and associated with a medium effect size?a. t(60) = 1.76, p > .05, d = 0.45b. t(30) = 1.53, p > .05, d = 0.15c. t(22) = 3.02, p < .05, d = 0.90d. t(25) = 2.95, p < .05, d = 0.50
A researcher reports the following result for a two-independent-sample t test in APA format: t(28) = 2.048, p = .05 (d = 0.10). Was this a one-tailed test or a two-tailed test?a. One-tailed test because the p value is equal to .05.b. Two-tailed test because the p value is equal to .05.c. It could
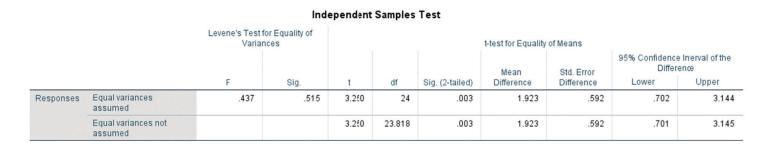
Using the values given in the table, identify the value of the test statistic for the twoindependent-sample t test.Answer: ____ [enter number exactly as shown in the table]
Based on the confi dence intervals, we can state at a 95% level of confi dence that the mean diff erence in the population between these two groups isa. between 5.876 and 30.235 more grams consumed of fruits for both groups.b. between 5.876 and 30.235 more grams consumed of fruits among those who
Using the values given in the table, identify the value of the denominator in the formula for the two-independent-sample t test.Answer: ____ [enter number exactly as shown in the table]
Using the values given in the table, identify the p value for this two-independent-sample t test.Answer: ____ [enter number exactly as shown in the table]
Based on the confi dence intervals, we can state at a 95% level of confi dence that the mean diff erence in the population between these two groups isa. between 0.702 and 3.144 more correct responses among those who received a reward for correct responses compared to those who did not receive a
What is the decision for this test?a. Fail to reject the null hypothesis.b. Reject the null hypothesis.
Using the values given in the table, what is the p value for these results?Answer: ____ [enter number exactly as shown in the table] Responses Equal variances assumed Equal variances not assumed Levene's Test for Equality of Variances Independent Samples Test 1-test for Equality of Means 95%
Using the values given in the table, identify the value of the numerator in the formula for the two-independent-sample t test.Answer: ____ [enter number exactly as shown in the table] Responses Equal variances assumed Equal variances not assumed Levene's Test for Equality of Variances Independent
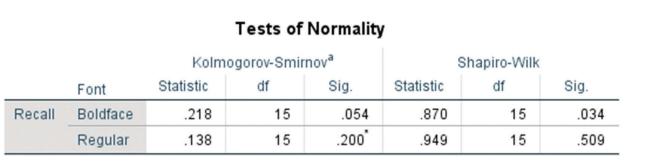
Below is the test of normality for a two-independent-sample t test computed in SPSS.What is the decision for the Shapiro-Wilk test?a. We reject the null hypothesis for Group Regular Font; thus the assumption of normality was violated for this group.b. We reject the null hypothesis for Group
Based on the confidence intervals for these data, and assuming a null hypothesis that there is no mean difference between these groups in the population, what can we infer about the decision for a null hypothesis significance test at a .05 level of significance for a two-tailed test?a. The decision
Which of the following lists the 99% confidence interval for these data?a. 99% CI −13.577, −0.423b. 99% CI −82.148, 68.148c. 99% CI −21.596, 7.596d. 99% CI −11.801, −2.199
Which of the following lists the 95% confidence interval for these data?a. 95% CI −61.859, 47.859b. 95% CI −11.801, −2.199c. 95% CI −13.577, −0.423d. 95% CI −17.655, 3.655
Based on the confidence intervals for these data, and assuming a null hypothesis that there is no mean difference between these groups in the population, what can we infer about the decision for a null hypothesis significance test at a .05 level of significance for a two-tailed test?a. The decision
Which of the following lists the 99% confidence interval for these data?a. 99% CI −8.226, 10.226b. 99% CI −4.087, 6.087c. 99% CI −0.532, 2.532d. 99% CI −1.082, 3.082
Which of the following lists the 95% confidence interval for these data?a. 95% CI −5.788, 7.788b. 95% CI −2.743, 4.743c. 95% CI −0.532, 2.532d. 95% CI −0.268, 2.268
Researchers find that participants randomly assigned to receive family counseling had more positive experiences compared to those randomly assigned to receive individual counseling, t(60) = 2.010, p < .05. Identify the effect size in this study using estimated omega-squared.
Differences on a cognitive assessment are compared between participants randomly assigned to receive a prompt or no prompt prior to an attentional task. The findings show that receiving the prompt prior to the task did not affect how quickly participants were able to complete the task, t(30) =
Which of the following identifies a large effect size for a t test?a. η2= .28b. d = .76c. ω2= .20d. tobt = 2.325
A researcher computes the mean difference in locomotion in a sample of 12 rats for 30 minutes following an injection of a saline solution (the control group) or amphetamine(the experimental group). Rats were placed in a box with infrared beams. The number of times a rat crossed a beam was used as a
What is the estimated Cohen’s d for this result?a. small effect size, d < 0.20b. medium effect size, 0.20 < d < 0.80c. large effect size, d > 0.80
Which of the following is an appropriate conclusion for this test?a. Participants stood for significantly less time if the confederate was also standing, compared to when the confederate was sitting, t(18) = 2.151, p < .05.b. Participants stood for significantly less time if the confederate was
Which of the following statements is true, assuming a two-tailed test was conducted?a. The analysis led to a decision that the confederate’s behavior (standing or sitting) did not affect the behavior of the participants.b. Participants stood for significantly more time if the confederate was also
What is the estimated Cohen’s d for this result?a. small effect size, d < 0.20b. medium effect size, 0.20 < d < 0.80c. large effect size, d > 0.80
Which of the following is an appropriate conclusion for this test?a. Ratings for the art were significantly affected by whether the art was described as being created by a famous or an amateur artist, t(24) = 2.207, p < .05.b. Ratings for the art were significantly affected by whether the art was
Which of the following statements is true, assuming a two-tailed test was conducted?a. The analysis led to a decision that how the art was described to participants did not affect their ratings of the art.b. The p value was larger than .05, indicating a significant effect for these data.c.
Which of the following is the statistical assumption for the two-independent-sample t test that can be tested using Levene’s test for equality of variances?a. normalityb. independencec. equal variancesd. random sampling
Which of the following are the statistical assumptions for the two-independent-sample t test?a. normality and equal variancesb. independence and random samplingc. normality and independence
A study conducted at a .05 level of significance in a sample of 12 participants observed in each of two groups for a two-tailed test.Answer: ____ [enter value exactly as shown in the table]
A study conducted in a sample of 15 students observed in each of two groups at a .05 level of significance for a two-tailed test.Answer: ____ [enter value exactly as shown in the table]
The degrees of freedom for a study in which the critical value = 1.725 for a one-tailed test at α = .05.Answer: ____ [enter whole number]
The degrees of freedom for a study in which the critical value = 2.086 for a two-tailed test at a .05 level of significance.Answer: ____ [enter whole number]
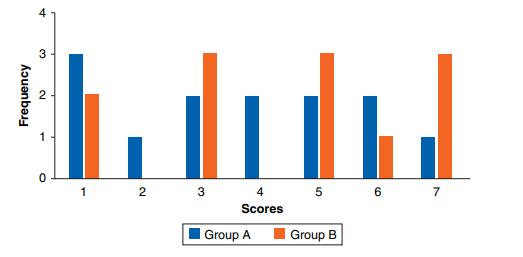
Evaluate the figure below based on how the data in each group overlaps. The figure shows the individual scores in each of two groups. Based on the figure, which of the following statements is true?a. It is not likely that these data will lead to a decision to reject the null hypothesis.b. It is
Evaluate the figure below based on how the data in each group overlaps. The figure shows the individual scores in each of two groups. Based on the figure, which of the following statements is true?a. It is not likely that these data will lead to a decision to reject the null hypothesis.b. It is
Suppose that we conduct two experiments in which we observe two groups in each experiment. In Experiment 1, scores do not overlap at all between the two groups; in Experiment 2, scores mostly overlap between the two groups. In which experiment are we more likely to reject the null hypothesis?a.
The less that scores in two groups overlap, thea. more likely we are to decide that two groups are significantly different.b. less likely we are to decide that two groups are significantly different.
A researcher selects a sample of participants and randomly assigns them to rate imagery of events that depict either a scene that violates their beliefs or is consistent with their beliefs to evaluate how these ratings differ between the two groups.
A researcher selects a sample of patients with a mental health disorder and randomly assigns them to receive a treatment or to participate in a control condition in order to evaluate the effectiveness of the treatment.
A researcher selects a sample of students attending a community college and those at a 4-year institution to evaluate differences in their social interactions.
A researcher selects a sample of military service members who serve in active duty (fulltime) and those who serve in the reserves (part-time) to evaluate differences in how they respond to stressors.
A clinician evaluates how husbands and wives respond differently to a treatment during family therapy counseling. Which of the following statements correctly describes this study?a. This study is an example of a between-subjects design.b. This study is an example of a design with an independent
Which of the following is an example of a between-subjects design?a. A researcher evaluates the resilience of children who have vs. have not experienced trauma.b. A counselor evaluates the behavior change in at-risk youths before and after an intervention.c. A teacher evaluates the improvement in
What type of sample is observed using the between-subjects design?a. related sampleb. dependent samplec. independent sample
The between-subjects design is a research design in which ____ participants are observed in each group or at each level of a factor. [Fill in the blank]a. mixedb. differentc. the same
Showing 5100 - 5200
of 8686
First
45
46
47
48
49
50
51
52
53
54
55
56
57
58
59
Last
Step by Step Answers