New Semester
Started
Get
50% OFF
Study Help!
--h --m --s
Claim Now
Question Answers
Textbooks
Find textbooks, questions and answers
Oops, something went wrong!
Change your search query and then try again
S
Books
FREE
Study Help
Expert Questions
Accounting
General Management
Mathematics
Finance
Organizational Behaviour
Law
Physics
Operating System
Management Leadership
Sociology
Programming
Marketing
Database
Computer Network
Economics
Textbooks Solutions
Accounting
Managerial Accounting
Management Leadership
Cost Accounting
Statistics
Business Law
Corporate Finance
Finance
Economics
Auditing
Tutors
Online Tutors
Find a Tutor
Hire a Tutor
Become a Tutor
AI Tutor
AI Study Planner
NEW
Sell Books
Search
Search
Sign In
Register
study help
business
statistics econometrics
Biocalculus Calculus Probability And Statistics For The Life Sciences 1st Edition James Stewart, Troy Day - Solutions
Find the first six terms of the recursive sequence. a1 − 1, an11 − 4 2 an
Find the first six terms of the recursive sequence. a1 − 2, an11 −an 1 1 an
Find the first six terms of the recursive sequence. a1 − 6, an11 −an n
Find the first six terms of the recursive sequence. a1 − 1, an11 − 5an 2 3
Find a formula for the general term an of the sequence, assuming that the pattern of the first few terms continues. 1, 0, 21, 0, 1, 0, 21, 0, . . .
Find a formula for the general term an of the sequence, assuming that the pattern of the first few terms continues. 5, 8, 11, 14, 17, . . .13. Find a formula for the general term an of the sequence, assuming that the pattern of the first few terms continues. 12 , 243 , 94 , 216 5 , 25 6 , . . .
Find a formula for the general term an of the sequence, assuming that the pattern of the first few terms continues. 23, 2, 243, 89, 216 27, . . .
Find a formula for the general term an of the sequence, assuming that the pattern of the first few terms continues. 1, 213, 19, 21 27, 1 81, . . .
Find a formula for the general term an of the sequence, assuming that the pattern of the first few terms continues. 1, 13, 15, 17, 19, . . .
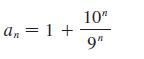
Calculate, to four decimal places, the first ten terms of the sequence and use them to plot the graph of the sequence by hand. 10" 9" + I = "p
Calculate, to four decimal places, the first ten terms of the sequence and use them to plot the graph of the sequence by hand. () + 1 = "v
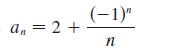
Calculate, to four decimal places, the first ten terms of the sequence and use them to plot the graph of the sequence by hand. a = 2 + an (-1)" n
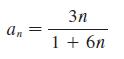
Calculate, to four decimal places, the first ten terms of the sequence and use them to plot the graph of the sequence by hand. an 3n 1 + 6n
List the first five terms of the sequence. a = cos TITT 2
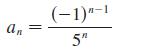
List the first five terms of the sequence. an (-1)"-1 5"
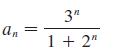
List the first five terms of the sequence. an 3" 1+2"
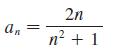
List the first five terms of the sequence. an = 2n n + 1
Amplifying DNA Polymerase Chain Reaction (PCR) is a biochemical technique that allows scientists to take tiny samples of DNA and amplify them into large samples that can then be examined to determine the DNA sequence.(This is useful, for example, in forensic science.) The process works by mixing
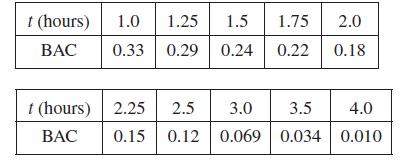
Drinking and driving In a medical study, researchers measured the mean blood alcohol concentration (BAC) of eight fasting adult male subjects (in mgymL) after rapid consumption of 30 mL of ethanol (corresponding to two standard alcoholic drinks). The BAC peaked after half an hour and the table
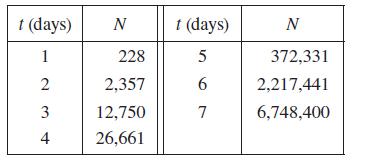
Malarial parasites The table, supplied by Andrew Read, shows the results of an experiment involving malarial parasites. The time t is measured in days and N is the number of parasites per microliter of blood.(a) Make a scatter plot and a semilog plot of the data.(b) Find an exponential model and
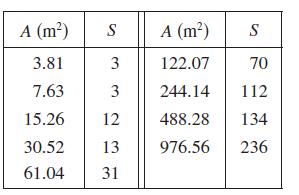
Biodiversity in a rain forest To quantify the biodiversity of trees in a tropical rain forest, biologists collected data in the Pasoh Forest Reserve of Malaysia. The table shows the number of tree species S found for a given area A in the rain forest.(a) Make a scatter plot of the data and either a
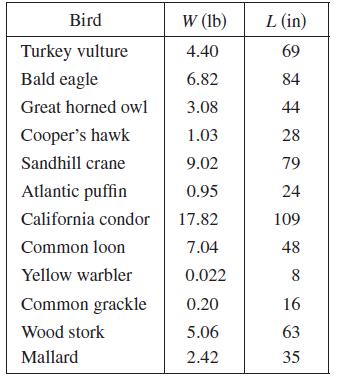
Why is the dodo extinct? Ornithologists measured and cataloged the wingspans and weights of many different species of birds that can fly. The table shows the wingspan L for a bird of weight W.(a) Make a scatter plot, semilog plot, and log-log plot for these data. Which type of model do you think
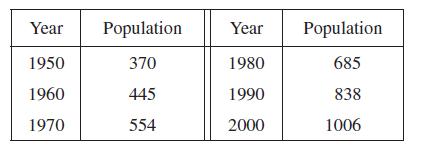
I ndian population The table gives the midyear population of India (in millions) for the last half of the 20th century.(a) Make a scatter plot, semilog plot, and log-log plot for these data and comment on which type of model would be most appropriate.(b) Obtain an exponential model for the
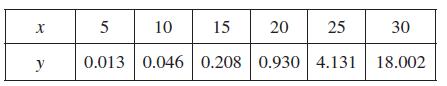
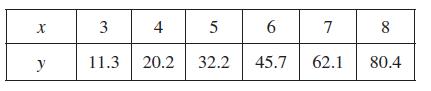
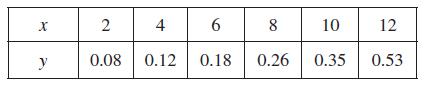
Data points sx, yd are given.(a) Draw a scatter plot of the data points.(b) Make semilog and log-log plots of the data.(c) Is a linear, power, or exponential function appropriate for modeling these data?(d) Find an appropriate model for the data and then graph the model together with a scatter plot
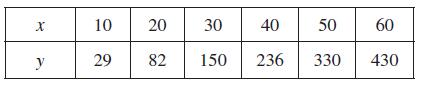
Data points sx, yd are given.(a) Draw a scatter plot of the data points.(b) Make semilog and log-log plots of the data.(c) Is a linear, power, or exponential function appropriate for modeling these data?(d) Find an appropriate model for the data and then graph the model together with a scatter plot
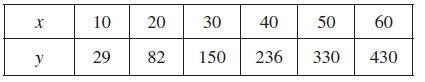
Data points sx, yd are given.(a) Draw a scatter plot of the data points.(b) Make semilog and log-log plots of the data.(c) Is a linear, power, or exponential function appropriate for modeling these data?(d) Find an appropriate model for the data and then graph the model together with a scatter plot
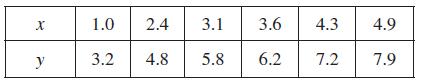
Data points sx, yd are given.(a) Draw a scatter plot of the data points.(b) Make semilog and log-log plots of the data.(c) Is a linear, power, or exponential function appropriate for modeling these data?(d) Find an appropriate model for the data and then graph the model together with a scatter plot
Data points sx, yd are given.(a) Draw a scatter plot of the data points.(b) Make semilog and log-log plots of the data.(c) Is a linear, power, or exponential function appropriate for modeling these data?(d) Find an appropriate model for the data and then graph the model together with a scatter plot
Data points sx, yd are given.(a) Draw a scatter plot of the data points.(b) Make semilog and log-log plots of the data.(c) Is a linear, power, or exponential function appropriate for modeling these data?(d) Find an appropriate model for the data and then graph the model together with a scatter plot
When a camera flash goes off, the batteries immediately begin to recharge the flash’s capacitor, which stores electric charge given by(The maximum charge capacity is Q0 and t is measured in seconds.)(a) Find the inverse of this function and explain its meaning.(b) How long does it take to
Bacteria population If a bacteria population starts with 500 bacteria and doubles in size every half hour, then the number of bacteria after t hours is n − f std − 500 ? 4t.(See Exercise 1.4.30).(a) Find the inverse of this function and explain its meaning.(b) When will the population reach
(a) Find the domain of f sxd − lnsex 2 3d.(b) Find f 21 and its domain.56. (a) What are the values of eln 300 and lnse300d?(b) Use your calculator to evaluate eln 300 and lnse300d. What do you notice? Can you explain why the calculator has trouble?
Dialysis treatment adequacy(a) The quantity KtyV in Exercise 53 is sometimes used as a measure of dialysis treatment adequacy. What does this represent and what are its units?(b) Another quantity sometimes used to measure dialysis treatment adequacy is the fractional reduction in urea during a
Dialysis time Hemodialysis is a process by which a machine is used to filter urea and other waste products from an individual’s blood when the kidneys fail. The concentration of urea in the blood is often modeled as exponential decay. If K is the mass transfer coefficient(in mLymin), cstd is the
Solve each inequality for x. (a) 1 , e3x21 , 2 (b) 1 2 2 ln x , 3
Solve each inequality for x. (a) ln x , 0 (b) ex . 5
Solve each equation for x. (a) lnsln xd − 1 (b) eax − Cebx, where a ± b
Solve each equation for x. (a) 2x25 − 3 (b) ln x 1 lnsx 2 1d − 1
Solve each equation for x. (a) lnsx2 2 1d − 3 (b) e2x 2 3ex 1 2 − 0
Solve each equation for x. (a) e724x − 6 (b) lns3x 2 10d − 2
Make a rough sketch of the graph of each function. Do not use a calculator. Just use the graphs given in Figures 12 and 13 and, if necessary, the transformations of Section 1.3. (a) y − lns2xd (b) y − ln |x |
Make a rough sketch of the graph of each function. Do not use a calculator. Just use the graphs given in Figures 12 and 13 and, if necessary, the transformations of Section 1.3. (a) y − log10sx 1 5d (b) y − 2ln x
Compare the functions f sxd − x0.1 and tsxd − ln x by graphing both f and t in several viewing rectangles. When does the graph of f finally surpass the graph of t?
Suppose that the graph of y − log2 x is drawn on a coordinate grid where the unit of measurement is an inch. How many miles to the right of the origin do we have to move before the height of the curve reaches 3 ft?
Use Formula 10 to evaluate each logarithm correct to six decimal places.(a) log12 10 (b) log2 8.4
Express the given quantity as a single logarithm. 13 lnsx 1 2d3 1 12 fln x 2 lnsx2 1 3x 1 2d2g
Express the given quantity as a single logarithm. lnsa 1 bd 1 lnsa 2 bd 2 2 ln c
Express the given quantity as a single logarithm. ln 5 1 5 ln 3
Find the exact value of each expression. (a) e22 ln 5 (b) lnsln ee10d
Find the exact value of each expression. (a) log2 6 2 log2 15 1 log2 20(b) log3 100 2 log3 18 2 log3 50
Find the exact value of each expression. (a) lns1yed (b) log10 s10
Find the exact value of each expression. (a) log5 125 (b) log3 s 1 27d
(a) What is the natural logarithm?(b) What is the common logarithm?(c) Sketch the graphs of the natural logarithm function and the natural exponential function with a common set of axes.
(a) How is the logarithmic function y − logb x defined?(b) What is the domain of this function?(c) What is the range of this function?(d) Sketch the general shape of the graph of the function y − logb x if b . 1.
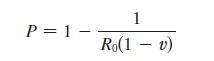
Vaccination coverage Suppose we modify the function in Example 5 by introducing vaccination to control the probability of an outbreak of the disease. We want to know the fraction of the population that we have to vaccinate to achieve a target outbreak probability. If v is the vaccination fraction,
Let f sxd − s1 2 x2 , 0 < x < 1.(a) Find f 21. How is it related to f ?(b) Identify the graph of f and explain your answer to part (a).
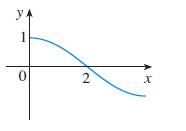
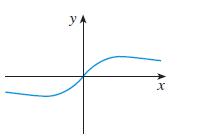
Use the given graph of f to sketch the graph of f 21. y. 1 0 2 x
Use the given graph of f to sketch the graph of f 21. 1 0 X
Find an explicit formula for f 21 and use it to graph f 21, f , and the line y − x on the same screen. To check your work, see whether the graphs of f and f 21 are reflections about the line. f sxd − 2 2 ex
Find an explicit formula for f 21 and use it to graph f 21, f , and the line y − x on the same screen. To check your work, see whether the graphs of f and f 21 are reflections about the line. f sxd − x4 1 1, x > 0
Find a formula for the inverse of the function. y −ex 1 1 2ex
Find a formula for the inverse of the function. y − lnsx 1 3d
Find a formula for the inverse of the function. y − x2 2 x, x > 12
Find a formula for the inverse of the function. f sxd − e2x21
Find a formula for the inverse of the function. f sxd −4x 2 1 2x 1 3
Find a formula for the inverse of the function. f sxd − 1 1 s2 1 3x
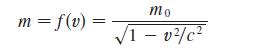
In the theory of relativity, the mass of a particle with speed v iswhere m0 is the rest mass of the particle and c is the speed of light in a vacuum. Find the inverse function of f and explain its meaning. m = f(v) = mo 1 - v/c
The formula C − 59 sF 2 32d, where F > 2459.67, expresses the Celsius temperature C as a function of the Fahrenheit temperature F. Find a formula for the inverse function and interpret it. What is the domain of the inverse function?
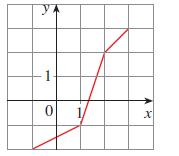
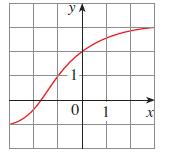
The graph of f is given.(a) Why is f one-to-one?(b) What are the domain and range of f 21?(c) What is the value of f 21s2d?(d) Estimate the value of f 21s0d. y 1 0 1 x
If tsxd − 3 1 x 1 ex, find t21s4d.
If f sxd − x5 1 x3 1 x, find f 21s3d and f s f 21s2dd.
Assume that f is a one-to-one function.(a) If f s6d − 17, what is f 21s17d?(b) If f 21s3d − 2, what is f s2d?
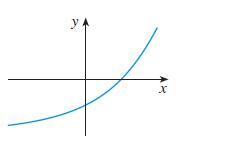
A function is given by a table of values, a graph, a formula, or a verbal description. Determine whether it is one-toone. f std is your height at age t.
A function is given by a table of values, a graph, a formula, or a verbal description. Determine whether it is one-toone. f std is the height of a football t seconds after kickoff.
A function is given by a table of values, a graph, a formula, or a verbal description. Determine whether it is one-toone. tsxd − cos x
A function is given by a table of values, a graph, a formula, or a verbal description. Determine whether it is one-toone. tsxd − 1yx
A function is given by a table of values, a graph, a formula, or a verbal description. Determine whether it is one-toone. f sxd − 10 2 3x
A function is given by a table of values, a graph, a formula, or a verbal description. Determine whether it is one-toone. f sxd − x2 2 2x
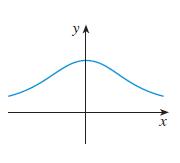
A function is given by a table of values, a graph, a formula, or a verbal description. Determine whether it is one-toone. x
A function is given by a table of values, a graph, a formula, or a verbal description. Determine whether it is one-toone. x
A function is given by a table of values, a graph, a formula, or a verbal description. Determine whether it is one-toone. x
A function is given by a table of values, a graph, a formula, or a verbal description. Determine whether it is one-toone. x
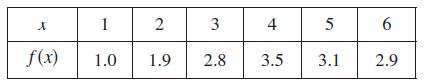
A function is given by a table of values, a graph, a formula, or a verbal description. Determine whether it is one-toone. x 1 2 3 4 5 6 f(x) 1.0 1.9 2.8 3.5 3.1 2.9
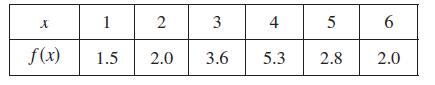
A function is given by a table of values, a graph, a formula, or a verbal description. Determine whether it is one-toone. X 1 2 3 4 5 6 f(x) 1.5 2.0 3.6 5.3 2.8 2.0
(a) Suppose f is a one-to-one function with domain A and range B. How is the inverse function f 21 defined?What is the domain of f 21? What is the range of f 21?(b) If you are given a formula for f , how do you find a formula for f 21?(c) If you are given the graph of f , how do you find the graph
(a) What is a one-to-one function?(b) How can you tell from the graph of a function whether it is one-to-one?
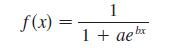
Graph several members of the family of functionswhere a . 0. How does the graph change when b changes?How does it change when a changes? f(x) 1 1+aex
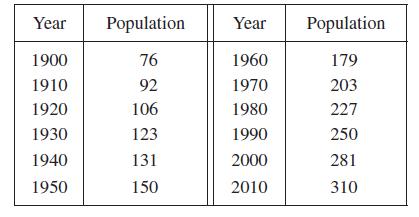
US population The table gives the population of the United States, in millions, for the years 1900–2010. Usea calculator with exponential regression capability to model the US population since 1900. Use the model to estimate the population in 1925 and to predict the population in the year
World population Use a calculator with exponential regression capability to model the population of the world with the data from 1950 to 2010 in Table 1 on page 46. Use the model to estimate the population in 1993 and to predict the population in the year 2020.
Blood alcohol concentration After alcohol is fully absorbed into the body, it is metabolized with a half-life of about 1.5 hours. Suppose you have had three alcoholic drinks and an hour later, at midnight, your blood alcohol concentration (BAC) is 0.6 mgymL.(a) Find an exponential decay model for
H alf-life of HIV Use the graph of V in Figure 12 to estimate the half-life of the viral load of patient 303 during the first month of treatment.
An isotope of sodium, 24Na, has a half-life of 15 hours. A sample of this isotope has mass 2 g.(a) Find the amount remaining after 60 hours.(b) Find the amount remaining after t hours.(c) Estimate the amount remaining after 4 days.; (d) Use a graph to estimate the time required for the mass to be
The half-life of bismuth-210, 210Bi, is 5 days.(a) If a sample has a mass of 200 mg, find the amount remaining after 15 days.(b) Find the amount remaining after t days.(c) Estimate the amount remaining after 3 weeks.; (d) Use a graph to estimate the time required for the mass to be reduced to 1 mg.
A bacteria culture starts with 500 bacteria and doubles in size every half hour.(a) How many bacteria are there after 3 hours?(b) How many bacteria are there after t hours?(c) How many bacteria are there after 40 minutes?; (d) Graph the population function and estimate the time for the population
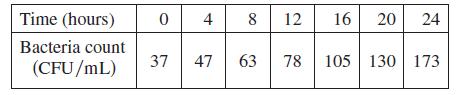
Giardia lamblia growth A researcher is trying to determine the doubling time of a population of the bacterium Giardia lamblia. He starts a culture in a nutrient solution and estimates the bacteria count every four hours. His data are shown in the table.(a) Make a scatter plot of the data.(b) Use a
Use a graph to estimate the values of x such that ex . 1,000,000,000.
Compare the functions f sxd − x10 and tsxd − ex by graphing both f and t in several viewing rectangles. When does the graph of t finally surpass the graph of f ?
Compare the functions f sxd − x5 and tsxd − 5x by graphing both functions in several viewing rectangles. Find all points of intersection of the graphs correct to one decimal place. Which function grows more rapidly when x is large?
Suppose the graphs of f sxd − x2 and tsxd − 2x are drawn on a coordinate grid where the unit of measurement is 1 inch. Show that, at a distance 2 ft to the right of the origin, the height of the graph of f is 48 ft but the height of the graph of t is about 265 mi.
Suppose you are offered a job that lasts one month. Which of the following methods of payment do you prefer?I. One million dollars at the end of the month.II. One cent on the first day of the month, two cents on the second day, four cents on the third day, and, in general, 2n21 cents on the nth day.
Showing 1900 - 2000
of 7357
First
13
14
15
16
17
18
19
20
21
22
23
24
25
26
27
Last
Step by Step Answers