New Semester
Started
Get
50% OFF
Study Help!
--h --m --s
Claim Now
Question Answers
Textbooks
Find textbooks, questions and answers
Oops, something went wrong!
Change your search query and then try again
S
Books
FREE
Study Help
Expert Questions
Accounting
General Management
Mathematics
Finance
Organizational Behaviour
Law
Physics
Operating System
Management Leadership
Sociology
Programming
Marketing
Database
Computer Network
Economics
Textbooks Solutions
Accounting
Managerial Accounting
Management Leadership
Cost Accounting
Statistics
Business Law
Corporate Finance
Finance
Economics
Auditing
Tutors
Online Tutors
Find a Tutor
Hire a Tutor
Become a Tutor
AI Tutor
AI Study Planner
NEW
Sell Books
Search
Search
Sign In
Register
study help
business
statistics econometrics
Statistics For The Behavioral And Social Sciences 5th Edition Arthur Aron Elliot Coups, Elaine N. Aron - Solutions
A researcher compares the typical family size in 10 cultures, five from Language Group A and five from Language Group B. The figures for the Group A cultures are 1.2, 2.5, 4.3, 3.8, and 7.2. The figures for the Group B cultures are 2.1, 9.2, 5.7, 6.7, and 4.8. Based on these 10 cultures, does
For each of the following distributions, make a square-root transformation:(a) 16, 4, 9, 25, 36(b) 35, 14.3, 13, 12.9, 18
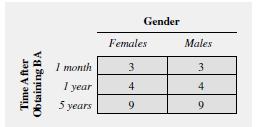
Lydon, Pierce, and O’Regan (1997) conducted a study that compared longdistance to local dating relationships. The researchers first administered questionnaires to a group of students one month prior to their leaving home to begin their first semester at McGill University (Time 1). Some of these
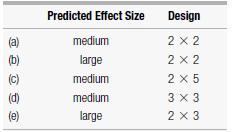
About how many participants do you need for 80% power in each of the following planned studies using a chi-square test for independence with p 6 .05? Predicted Effect Size Design (a) medium 2 X 2 (b) large 2 X 2 (c) medium 2 X 5 (d) medium 3 x 3 (e) large 2 x 3
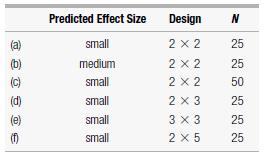
What is the power of the following planned studies using a chi-square test for independence with p 6 .05? Predicted Effect Size Design N (a) small 2 X 2 25 (b) medium 2 X 2 25 (c) small 2 X 2 50 (d) small 2 X 3 25 (e) small 3 x 3 25 (f) small 2 X 5 25
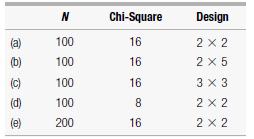
Figure the effect size for the following studies: N Chi-Square Design (a) 100 16 2 X 2 (b) 100 16 2 x 5 100 16 3 x 3 (d) 100 8 2 X 2 (e) 200 16 2 X 2
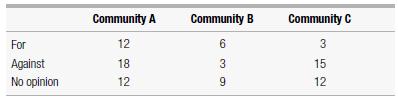
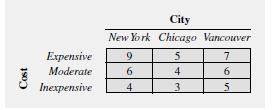
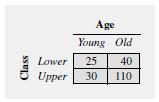
A political analyst is interested in whether the community in which a person lives is related to that person’s opinion on an upcoming water conservation ballot initiative. The analyst surveys 90 people by phone. The results are shown in the following table. Is opinion related to community at the
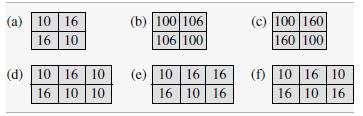
Carry out a chi-square test for independence for each of the following contingency tables (use the .01 level). Also, figure the effect size for each. (a) 10 10 16 16 10 (b) 100 106 106 100 (c) 100 160 160 100 (d) 10 16 10 16 10 10 16 10 16 (e) 10 16 16 (f) 10 16 10 16 10 16
A director of a social service agency is planning to hire temporary staff to assist with intake. In making plans, the director needs to know whether there is any difference in the use of the agency at different seasons of the year. Last year there were 28 new clients in the winter, 33 in the
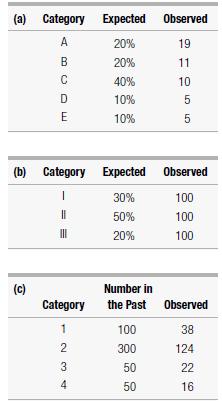
Carry out a chi-square test for goodness of fit for each of the following (use the.05 level for each): (a) Category Expected Observed ABCDE 20% 19 20% 11 40% 10 10% 5 10% 5 (b) Category Category Expected Observed 30% 100 50% 100 20% 100 (c) Number in Category the Past Observed 1 100 38 234 2 300
If conditions are not met for a parametric test, (a) what are the advantages and (b) disadvantages of data transformation over rank-order tests, and what are the (c) advantages and (d) disadvantages of rank-order tests over data transformation?
(a) What happens if you change your scores to ranks and then figure an ordinary parametric test using the ranks? (b) Why will this not be quite as accurate, even assuming that the transformation to ranks is appropriate?(c) Why will this result not be quite as accurate using the standard rankorder
(a) If you wanted to use a standard rank-order test instead of a t test for independent means, what procedure would you use? (b) What are the steps of doing such a test?
Transform the following scores to ranks: 5, 18, 3, 9, 2.
(a) What is a rank-order transformation? (b) Why is it done? (c) What is a rankorder test?
Consider the following distribution of scores: 4, 16, 25, 25, 25, 36, 64. (a) Are these scores roughly normally distributed? (b) Why? (c) Carry out a squareroot transformation for these scores (that is, list the square-root transformed scores). (d) Are the square-root transformed scores roughly
What is a data transformation?
(a) What is an outlier? (b) Why are outliers likely to have an especially big distorting effect in most statistical procedures?
(a) How do you check to see if you have met the assumptions? (b) Why is this problematic?
What are the two main assumptions for t tests and the analysis of variance?
About how many participants do you need for 80% power in a planned study in which you predict a medium effect size and will be using the.05 significance level?
What are two factors that affect the power of a study using a chi-square test of independence?
What is the power of a planned chi-square with 50 participants total and a predicted medium effect size?
(a) What is the measure of effect size for a chi-square test for independence for a contingency table that is larger than (b) Write the formula for this measure of effect size and define each of the symbols. (c) What is Cohen’s convention for a small effect size for a contingency table? (d)
(a) What is the measure of effect size for a chi-square test for independence?(b) Write the formula for this measure of effect size and define each of the symbols. (c) What are Cohen’s conventions for small, medium, and large effect sizes? (d) Figure the effect size for a chi-square test for
What are the assumptions for chi-square tests?
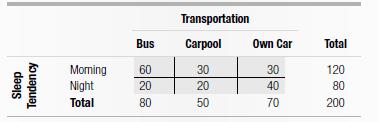
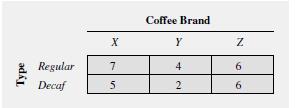
Use the steps of hypothesis testing to carry out a chi-square test for independence for the following observed scores (using the .01 significance level). The scores are from a study in which 200 university staff members completed a survey about the kind of transportation they use to get to work and
(a) Write the formula for figuring degrees of freedom in a chi-square test for independence and define each of its symbols. (b) Explain the logic behind this formula.
(a) List the steps for figuring the expected frequencies in a contingency table.(b) Write the formula for expected frequencies in a contingency table and define each of its symbols.
(a) In what situation do you use a chi-square test for independence? (b) How is this different from the situation in which you would use a chi-square test for goodness of fit?
Use the steps of hypothesis testing to carry out a chi-square test for goodness of fit (using the .05 significance level) for a sample in which one category has 15 people, the other category has 35 people, and the first category is expected to have 60% of people and the second category is expected
(a) What is a chi-square distribution? (b) What is its shape? (c) Why does it have that shape?
Write the formula for the chi-square statistic and define each of the symbols.
List the steps for figuring the chi-square statistic, and explain the logic behind each step.
In what situation do you use a chi-square test for goodness of fit?
Cut up 100 little pieces of paper of about the same size and write “1” on 16, “2”on 34, “3” on 34, and “4” on 16 of them. (You are creating an approximately normal distribution.) Put the slips into a bowl or hat, mix them up, draw out two, write the numbers on them down, and put
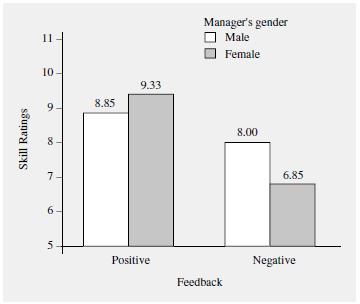
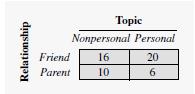
Sinclair and Kunda (2000) tested the idea that, if you want to think well of someone(for example, because they have said positive things about you), you are less influenced by the normal stereotypes when evaluating them. Participants filled outa questionnaire on their social skills and then
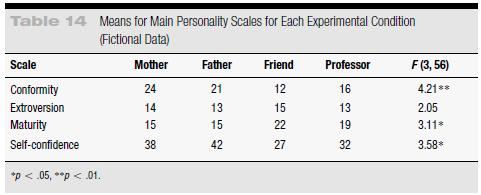
An experiment is conducted in which 60 participants each fill out a personality test, but not according to the way the participants see themselves. Instead, 15 are randomly assigned to fill it out according to the way they think their mothers see them (that is, the way they think their mothers
Each of the following is a table of means showing results of a study using a factorial design. Assuming that any differences are statistically significant, for each table (a) and (b), make two bar graphs showing the results (in one graph grouping the bars according to one variable and in the other
Each of the following is a table of means showing results of a study using a factorial design. Assuming that any differences are statistically significant, for each table (a) and (b), make two bar graphs showing the results (in one graph grouping the bars according to one variable and in the other
About how many participants do you need in each group for 80% power in each of the following planned studies, using the analysis of variance with p 6 .05? (b) Predicted Effect Size Small Medium Number of Groups Large (d) Medium 5553 5
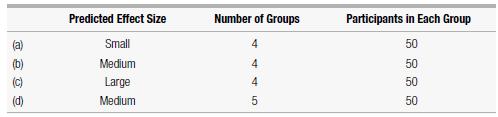
What is the power of each of the following planned studies, using the analysis of variance with p 6 .05? Predicted Effect Size (a) Small (b) Medium (c) Large Medium Number of Groups Participants in Each Group 4445 gggg 50 50 50 50
A researcher studying artistic preference randomly assigns a group of 45 participants to one of three conditions in which they view a series of unfamiliar abstract paintings. The 15 participants in the Famous condition are led to believe that these are each famous paintings; their mean rating for
Do students at various colleges differ in how sociable they are? Twenty-five students were randomly selected from each of three colleges in a particular region and were asked to report on the amount of time they spent socializing each day with other students.The results for College X was a mean of
An organizational researcher was interested in whether individuals working in different sectors of a company differed in their attitudes toward the company. The results for the three people surveyed in engineering were 10, 12, and 11; for the three in the marketing department, 6, 6, and 8; for the
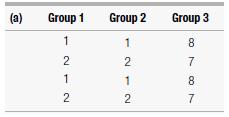
For each of the following studies, decide whether you can reject the null hypothesis that the groups come from identical populations. Use the .01 level. In addition, figure the effect size for each. (a) Group 1 Group 2 Group 3 1 1 8 22 2 7 1 1 8 2 2 7
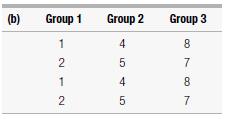
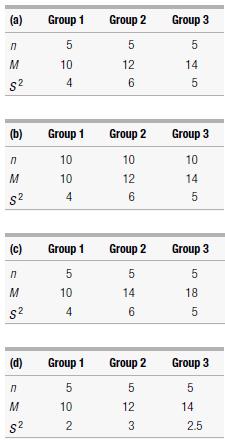
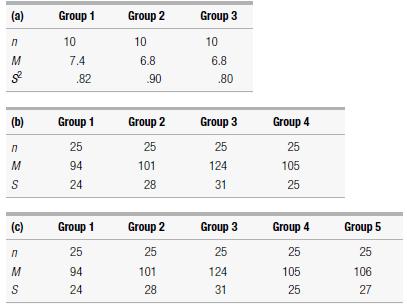
For each of the following studies, decide whether you can reject the null hypothesis that the groups come from identical populations. Use the .05 level. (a) Group 1 Group 2 Group 3 5 5 5 M 10 12 14 $2 4 6 5 (b) Group 1 Group 2 Group 3 n 10 10 10 M 10 12 14 S 4 6 5 (c) Group 1 Group 2 Group 3 SMS n
Which type of English words are longer: nouns, verbs, or adjectives? Go to a book of at least 400 pages (not this book or any other textbook) and turn to random pages (using the random numbers listed at the end of this paragraph). Go down the page until you come to a noun. Note its length (in
A researcher wants to know whether the need for health care among prisoners varies according to the different types of prison facilities. The researcher randomly selects 40 prisoners from each of the three main types of prisons in a particular Canadian province and conducts exams to determine their
Grilo, Walker, Becker, Edell, and McGlashan (1997) conducted a study of the relationship of depression and substance use to personality disorders. Personality disorders are persistent, problematic traits and behaviors that exceed the usual range of individual differences. The researchers conducted
Each of the following is a table of means showing results of a study using a factorial design. Assuming that any differences are statistically significant, for each table, (a) and (b) make two bar graphs showing the results (in one graph grouping the bars according to one variable and in the other
Each of the following is a table of means showing results of a study using a factorial design. Assuming that any differences are statistically significant, for each table, (a) and (b) make two bar graphs showing the results (in one graph grouping the bars according to one variable and in the other
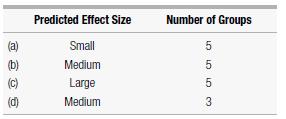
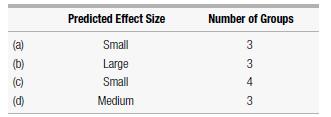
About how many participants do you need in each group for 80% power in each of the following planned studies, using the analysis of variance with p 6 .05? Predicted Effect Size Number of Groups (a) Small 3 (b) Large 3 (c) Small 4 (d) Medium 3
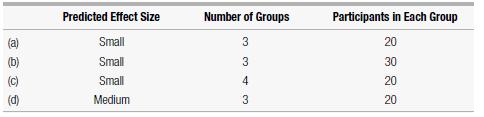
What is the power of each of the following planned studies, using the analysis of variance with p 6 .05? (b) Predicted Effect Size Number of Groups Participants in Each Group Small Small Small Medium 3343 30 222 20 20 20
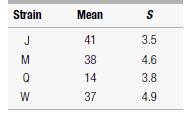
A researcher studying genetic influences on learning compares the maze performance of four genetically different strains of mice using eight mice per strain. Performance for the four strains were as follows:(a) Using the .01 significance level and the five steps of hypothesis testing, is there an
A study compared the felt intensity of unrequited love (loving someone who doesn’t love you) among three groups: 50 individuals who were currently experiencing unrequited love, who had a mean experienced intensity, M = 3.5, S2 = 5.2;50 who had previously experienced unrequited love and described
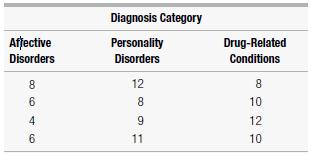
A social worker at a small psychiatric hospital was asked to determine whether there was any clear difference in the length of stay of patients with different categories of diagnosis. Looking at the last four clients in each of the three major categories, the results (in terms of weeks of stay)
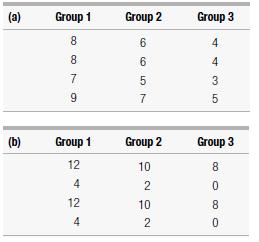
For each of the following studies, decide whether you can reject the null hypothesis that the groups come from identical populations. Use the .01 level. In addition, figure the effect size for each. (Be sure to show your calculations throughout.) (a) Group 1 Group 2 Group 3 8 6 4 8 6 4 7 5 3 6 7 5
For each of the following studies, decide whether you can reject the null hypothesis that the groups come from identical populations. Use the .05 level. In addition, figure the effect size and approximate power for each. Note that studies(b) and (c) provide S, not S2 (a) Group 1 Group 2 Group 3 n M
Explain how and why the scores from Steps ❸ and ❹ of the hypothesis-testing process are compared. Explain the meaning of the result of this comparison with regard to the specific research and null hypotheses being tested.
Describe the logic and process for determining the cutoff sample F score on the comparison distribution at which the null hypothesis should be rejected.
Explain the logic of the comparison distribution that is used with a one-way analysis of variance (the F distribution).
Describe the core logic of hypothesis testing in this situation. Be sure to mention that the analysis of variance involves comparing the results of two ways of estimating the population variance. One population variance estimate (the withingroups estimate) is based on the variation within each
Explain that the one-way analysis of variance is used for hypothesis testing when you have scores from three or more entirely separate groups of people. Be sure to explain the meaning of the research hypothesis and the null hypothesis in this situation.
When there is both a main and an interaction effect, (a) under what conditions must you be careful in interpreting the main effect, and (b) under what conditions can you still be confident in the overall main effect?
For a two-way factorial design, what are the possible combinations of main and interaction effects?
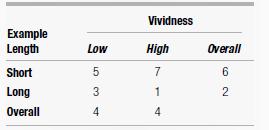
Make two bar graphs of these results: One graph should show vividness (low and high) on the horizontal axis, with bars for short and long example length;another graph should show example length (short and long) on the horizontal axis, with bars for low and high vividness. Vividness Example Length
Explain the pattern in terms of numbers. Vividness Example Length Low High Overall Short Long 53 5 7 6 1 2 Overall 4 4
Describe the pattern of results in words. Vividness Example Length Low High Overall Short Long 53 5 7 6 1 2 Overall 4 4
In each of the following studies, participants’ performance on a coordination task was measured under various conditions or compared for different groups.For each study, make a diagram of the research design and indicate whether it is a one-way or two-way design: (a) a study in which people are
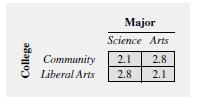
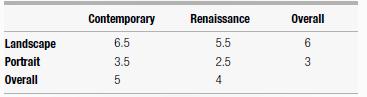
In the following table are the means from a study in which participants rated the originality of paintings under various conditions. For each mean, indicate its grouping and whether it is a cell or marginal mean Contemporary Renaissance Overall Landscape Portrait 6.5 5.5 6 3.5 2.5 3 Overall 50 4
In a factorial research design, (a) what is a main effect, and (b) what is an interaction effect?
(a) What is a factorial research design? (b) and (c) Give two advantages of a factorial research design over doing two separate experiments.
After getting a significant result with an analysis of variance, why do researchers usually go on to compare each population to each other population?
What is the general rule about when violations of the equal variance assumption are likely to lead to serious inaccuracies in results?
Why do we need the equal variance assumption?
Give the two main assumptions for the analysis of variance.
A study compares the effects of three experimental treatments, A, B, and C, by giving each treatment to 16 participants and then assessing their performance on a standard measure. The results on the standard measure are as follows:Treatment A group: Treatment B group:Treatment C group: Use the
(a) What is the F distribution? (b) Why is it skewed to the right? (c) What is the cutoff F for these scores for the .05 significance level?
(a) Write the formulas for the between-groups and within-groups degrees of freedom and (b) define each of the symbols. (c) Figure the between-groups and within-groups degrees of freedom for these scores.
(a) Write the formula for the F ratio and (b) define each of the symbols and explain the logic behind this formula. (c) Figure the F ratio for these scores.
(a) Write the formula for the between-groups population variance estimate based on the variance of the distribution of means and (b) define each of the symbols and explain the logic behind this formula. (c) Figure the betweengroups population variance estimate for these scores.
(a) Write the formula for the variance of the distribution of means when using it as part of an analysis of variance and (b) define each of the symbols. (c) Figure the variance of the distribution of means for these scores.
(a) Write the formula for the within-groups population variance estimate and(b) define each of the symbols. (c) Figure the within-groups population variance estimate for these scores.
(a) What is the F ratio; (b) why is it usually about 1 when the null hypothesis is true; and (c) why is it usually larger than 1 when the null hypothesis is false?
What are two sources of variation that can contribute to the between-groups population variance estimate?
(a) What is the between-groups population variance estimate based on?(b) How is it affected by the null hypothesis being true or not? (c) Why?
(a) What is the within-groups population variance estimate based on? (b) How is it affected by the null hypothesis being true or not? (c) Why?
When do you use an analysis of variance?
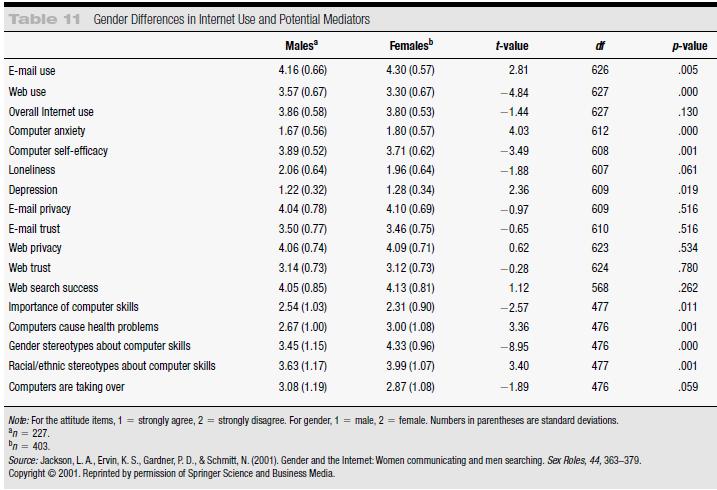
Jackson, Ervin, Gardner, and Schmitt (2001) gave a questionnaire about Internet usage to university students. Table 11 shows their results comparing men and women. (a) Select one significant and one nonsignificant result and explain these two results to a person who understands the t test for a
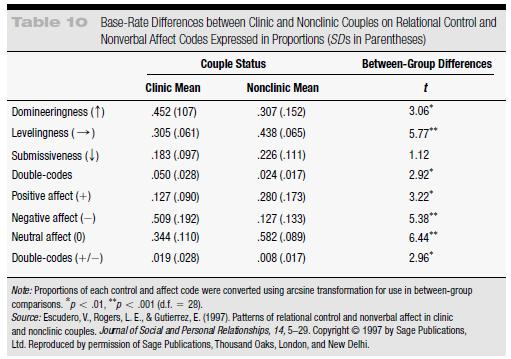
Escudero, Rogers, and Gutierrez (1997) videotaped 30 couples discussing a marital problem in their laboratory. The videotapes were later systematically rated for various aspects of the couple’s communication, such as domineeringness and the positive or negative quality of affect (emotion)
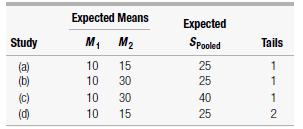
What are the approximate numbers of participants needed for each of the following planned studies to have 80% power, assuming equal numbers in the two groups and all using the .05 significance level? (Be sure to give the total number of participants needed, not just the number needed for each
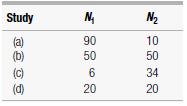
What is the approximate power of each of the following planned studies, all using a t test for independent means at the .05 significance level, two-tailed, with a predicted medium effect size? Study N N (a) 90 10 (b) 50 50 (c) 6 34 (d) 20 20
Figure the estimated effect size for problems (a) 16, (b) 17, and (c) 18. (d) Explain your answer to part (a) to a person who understands the t test for independent means but is unfamiliar with effect size.
A study of the effects of color on easing anxiety compared anxiety test scores of participants who completed the test printed on either soft yellow paper or on harsh green paper. The scores for five participants who completed the test printed on the yellow paper were 17, 19, 28, 21, and 18. The
Twenty students randomly assigned to an experimental group receive an instructional program; 30 in a control group do not. After 6 months, both groups are tested on their knowledge. The experimental group has a mean of 38 on the test(with an estimated population standard deviation of 3); the
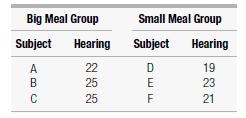
A researcher theorized that people can hear better when they have just eaten a large meal. Six individuals were randomly assigned to eat either a large meal or a small meal. After eating the meal, their hearing was tested. The hearing ability scores(high numbers indicate greater ability) are given
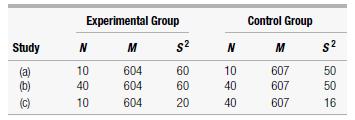
For each of the following experiments, decide whether the difference between conditions is statistically significant at the .05 level (two-tailed). Experimental Group Control Group Study N M $ N M $2 (a) 10 604 60 10 607 (b) 40 604 60 40 607 555 50 50 (c) 10 604 20 40 607 16
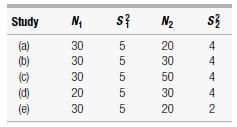
Figure SDifference for each of the following studies: Study N (a) (b) 30 (c) (d) (e) 30 88828 30 30 20 S s? 2 55555 20 30 50 30 20 S 44442
For each of the following studies, say whether you would use a t test for dependent means or a t test for independent means.(a) A researcher measures the heights of 40 university students who are the firstborn in their families and compares the 15 who come from large families to the 25 who come
Showing 2200 - 2300
of 7357
First
16
17
18
19
20
21
22
23
24
25
26
27
28
29
30
Last
Step by Step Answers