New Semester
Started
Get
50% OFF
Study Help!
--h --m --s
Claim Now
Question Answers
Textbooks
Find textbooks, questions and answers
Oops, something went wrong!
Change your search query and then try again
S
Books
FREE
Study Help
Expert Questions
Accounting
General Management
Mathematics
Finance
Organizational Behaviour
Law
Physics
Operating System
Management Leadership
Sociology
Programming
Marketing
Database
Computer Network
Economics
Textbooks Solutions
Accounting
Managerial Accounting
Management Leadership
Cost Accounting
Statistics
Business Law
Corporate Finance
Finance
Economics
Auditing
Tutors
Online Tutors
Find a Tutor
Hire a Tutor
Become a Tutor
AI Tutor
AI Study Planner
NEW
Sell Books
Search
Search
Sign In
Register
study help
business
statistics econometrics
Energy Statistics A Guide To Information Sources 1st Edition Sarojini Balachandran - Solutions
The long-term direction of a time series is called the .
Use the file Stock Indexes on Connect to determine the following:a. Develop a trend line for the S&P/TSX Index from 2001 to 2013. Does the trend line follow a linear or log equation? Use the best fit to estimate the value of the index in 2015.b. Develop a trend line for the DJIA Index from 2001 to
Units produced per quarter for Office Elegance along with the seasonal indexes are as follows: t Year Quarter Units Seasonal Indexes 1 2011 1 1234 102.89 2 2011 2 1300 101.89 3 2011 3 1225 90.32 4 2011 4 1323 104.89 5 2012 1 1334 102.89 6 2012 2 1234 101.89 7 2012 3 1134 90.32 8 2012 4 1450 104.89
The number of desks produced per quarter for Office Elegance is as follows: Year Winter Spring Summer Fall 2011 1234 1300 1225 1323 2012 1334 1234 1134 1450 2013 1511 1496 1300 1545 2014 1434 1576 1356 1598a. Determine a typical seasonal index for each of the four quarters.b. Comment on the indexes.
Nine Thirty Jewellery has forecasted sales of $825 000 next year. The sales index for February is 126.9, and the sales index for March is 86.3. Estimate the dollar value of sales for each month.
Sales per quarter for Sunshine Shores Boat and Ski Rentals along with the seasonal indexes are as follows: t Year Quarter Sales ($000’s) Seasonal Indexes 1 2012 1 13.5 149.046 2 2012 2 10.8 110.505 3 2012 3 8.7 89.421 4 2012 4 5.2 51.028 5 2013 1 14.6 149.046 6 2013 2 10.9 110.505 7 2013 3 8.8
Sales per quarter for Sunshine Shores Boat and Ski Rentals are as follows: Year Winter Spring Summer Fall 2012 13.5 10.8 8.7 5.2 2013 14.6 10.9 8.8 4.9 2014 15.0 11.1 8.9 5.4a. Determine a typical seasonal index for each of the four quarters.b. Comment on the indexes.
Banner Rocker Company manufacturers rocking chairs. The company developed a special rocker for children and would like to create a model to forecast sales for the next five years on the basis of the number sold in the past years. The data are as follows: Year Sales ($000) Year Sales ($000) 2004 153
The average salary of accountants working for the XYZ Corp. is listed below: Year Salary Year Salary Year Salary Year Salary 1993 58 436 1999 72 601 2005 89 257 2011 109 031 1994 59 994 2000 75 482 2006 92 574 2012 112 483 1995 61 515 2001 78 341 2007 95 843 2013 117 138 1996 63 182 2002 81 111
Listed below is the number of rooms rented at Spruce Falls Resort in Bobcaygeon from 2004 to 2014. Determine the least squares equation. According to this information, what is the estimated number of rentals for the next five years? Year Rentals Year Rentals Year Rentals 2004 6 714 2008 9 762 2012
Listed below is the number of movie tickets sold at the Library Cinema Complex, in thousands, for the period from 2000 to 2014. Compute a three-and five-year moving average. Describe the trend. Year Tickets (thousands) Year Tickets (thousands) Year Tickets (thousands) 2000 5.6 2005 6.5 2010 7.4
Sales for the La Parisienne Cosmetics Company (in $millions) are as follows: Year Sales ($millions) Year Sales ($millions) Year Sales ($millions) 1996 2.3 2003 4.5 2010 4.5 1997 2.9 2004 4.7 2011 4.9 1998 3.4 2005 5.0 2012 5.2 1999 4.5 2006 5.2 2013 5.5 2000 3.4 2007 5.5 2014 5.8 2001 4.0 2008 4.3
The Jamie Farr Kroger Classic is an LPGA (women’s professional golf) tournament played in Toledo, Ohio, each year. Listed below are the total purse and the prize for winner for the 22 years from 1988 through 2009. Develop a trend equation for both variables. Which variable is increasing at a
The enrollment in the School of Business at the local college by quarter since 2010 is as follows: Quarter Year Winter Spring Summer Fall 2010 2033 1871 714 2318 2011 2174 2069 840 2413 2012 2370 2254 927 2704 2013 2625 2478 1136 3001 2014 2803 2668 — — Using the ratio-to-moving-average
Ray Anderson, owner of the Anderson Ski Lodge, is interested in forecasting the number of visitors for the upcoming year. The following data are available, by quarter, since 2008. Develop a seasonal index for each quarter. How many visitors would you expect for each quarter of 2015, if Ray projects
The following are the net sales of Mike’s Surf Shoppe from 2005 to 2014:Year Sales Year Sales Year Sales 2005 $58 436 2009 $67 989 2013 $78 341 2006 59 994 2010 70 448 2014 81 111 2007 61 515 2011 72 601 2008 63 182 2012 75 482a. Plot the data.b. Determine the least squares trend equation. Use a
The inventory turnover rates for Bassett Wholesale Enterprises, by quarter, are as follows:Quarter Year I II III IV 2010 4.4 6.1 11.7 7.2 2011 4.1 6.6 11.1 8.6 2012 3.9 6.8 12.0 9.7 2013 5.0 7.1 12.7 9.0 2014 4.3 5.2 10.8 7.6a. Arrive at the four typical quarterly turnover rates for the Bassett
Sales of roof material, by quarter, since 2008 for Carolina Home Construction Inc. are shown below (in $ thousands):Quarter Year I II III IV 2008 $210 $180 $60 $246 2009 214 216 82 230 2010 246 228 91 280 2011 258 250 113 298 2012 279 267 116 304 2013 302 290 114 310 2014 321 291 120 320a.
Work Gloves Corp. is reviewing its quarterly sales of Toughie, the most durable glove it produces. The numbers of pairs produced (in thousands) by quarter are as follows: Quarter Year I Jan.–Mar. II Apr.–June III July–Sept. IV Oct.–Dec. 2009 142 312 488 208 2010 146 318 512 212 2011 160 330
The quarterly production of pine lumber, in millions of board feet, by Northwest Lumber since 2010 is as follows: Quarter Year Winter Spring Summer Fall 2010 7.8 10.2 14.7 9.3 2011 6.9 11.6 17.5 9.3 2012 8.9 9.7 15.3 10.1 2013 10.7 12.4 16.8 10.7 2014 9.2 13.6 17.1 10.3a. Determine the typical
The sales of Andre’s Boutique for 2013 and part of 2014 are as follows: Month 2013 Sales ($thousands) 2014 Sales ($thousands) Month 2013 Sales ($thousands) 2014 Sales ($thousands) January $78 $65 July $81 $65 February 72 60 August 85 61 March 80 72 September 90 75 April 110 97 October 98 May 92
The production of the Reliable Manufacturing Company for 2013 and part of 2014 is as follows: Month 2013 Production (thousands) 2014 Production (thousands) Month 2013 Production (thousands) 2014 Production (thousands) January 6 7 July 3 4 February 7 9 August 5 March 12 14 September 14 April 8 9
Listed below is the selling price for a share of Oracle Inc. stock at the close of the calendar year: Year Price($) Year Price($) Year Price($) Year Price($) 1990 0.1944 1991 0.3580 1992 0.7006 1993 1.4197 1994 2.1790 1995 3.1390 1996 4.6380 1997 3.7180 1998 7.1875 1999 28.0156 2000 29.0625 2001
Reported below are the amounts spent on advertising ($ millions) by a large firm from 2004 to 2014: Year Amount Year Amount 2004 $88.1 2010 $132.6 2005 94.7 2011 141.9 2006 102.1 2012 150.9 2007 109.8 2013 157.9 2008 118.1 2014 162.6 2009 125.6a. Determine the logarithmic trend equation.b. Estimate
If plotted, the following sales series would appear curvilinear. This indicates that sales are increasing at a somewhat constant annual rate (percentage). To fit the sales, therefore, a logarithmic straight-line equation should be used. Year Sales ($ millions) Year Sales ($ millions) 2004 $8.0 2010
Listed below is the selling price for a share of PepsiCo Inc. at the close of the calendar year: Year Price Year Price Year Price Year Price 1990 $13.00 1991 16.94 1992 20.75 1993 20.44 1994 18.13 1995 27.94 1996 29.25 1997 36.25 1998 40.88 1999 35.25 2000 49.56 2001 48.69 2002 42.22 2003 46.62
The numbers of employees, in thousands, of Keller Overhead Door Inc. for the years 2009 to 2014 are as follows: Year Employees (thousands) Year Employees (thousands) 2009 45.6 2012 39.3 2010 42.2 2013 34.0 2011 41.1 2014 30.0a. Plot the data.b. Determine the least squares trend equation.c. Use the
The sales, in billions of dollars, of Keller Overhead Door Inc. for 2009 to 2014 are as follows: Year Sales ($ billions) Year Sales ($ billions) 2009 $7.45 2012 $7.94 2010 7.83 2013 7.76 2011 8.07 2014 7.90a. Plot the data.b. Determine the least squares trend equation.c. Use the trend equation to
The asset turnovers, excluding cash and short-term investments, for the RNC Company from 2004 to 2014 are as follows: 2004 2005 2006 2007 2008 2009 2010 2011 2012 2013 2014 1.11 1.28 1.17 1.10 1.06 1.14 1.24 1.33 1.38 1.50 1.65a. Plot the data.b. Determine the least squares trend equation.c.
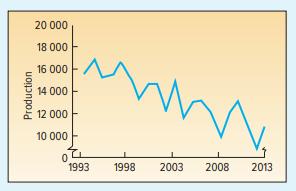
Refer to the following diagram:a. Estimate the linear trend equation for the production series by drawing a line through the data.b. What is the average annual decrease in production?c. On the basis of the trend equation, what is the forecast for the year 2019? 20 000 18 000 16 000 14 000 12 000
Refer to Exercise 10, regarding sales at the Appliance Centre. Use the seasonal indexes you computed to determine the deseasonalized sales. Determine the linear trend equation based on the quarterly data for the four years. Forecast the seasonally adjusted sales for 2015.
Refer to Exercise 9, regarding the absences at Anderson Belts Inc. Use the seasonal indexes you computed to determine the deseasonalized absences. Determine the linear trend equation based on the quarterly data for the three years. Forecast the seasonally adjusted absences for 2015.
Team Sports Inc. sells sporting goods to high schools and colleges via a nationally distributed catalogue. Management at Team Sports estimates that it will sell 2000 Wilson Model A2000 catcher’s mitts next year. The deseasonalized sales are projected to be the same for each of the four quarters
The planning department of Padget and Kure Shoes, the manufacturer of an exclusive brand of women’s shoes, developed the following trend equation, in millions of pairs, based on five years of quarterly data: Y¿ = 3.30 + 1.75t The following table gives the seasonal factors for each quarter:
The Appliance Centre sells a variety of electronic equipment and home appliances. For the last four years the following quarterly sales (in $ millions) were reported: Quarter Year I II III IV 2011 $5.3 $4.1 $6.8 $6.7 2012 4.8 3.8 5.6 6.8 2013 4.3 3.8 5.7 6.0 2014 5.6 4.6 6.4 5.9
Victor Anderson, the owner of Anderson Belts Inc., is studying absenteeism among his employees. His workforce is small, consisting of only five employees. For the last three years, he recorded the following number of employee absences, in days, for each quarter: Quarter Year I II III IV 2012 4 10 7
It appears that the imports of carbon black have been increasing by about 10% annually. Year Imports of Carbon Black (thousands of tonnes) Year Imports of Carbon Black (thousands of tonnes) 2007 92.0 2011 135.0 2008 101.0 2012 149.0 2009 112.0 2013 163.0 2010 124.0 2014 180.0a. Determine the
Sally’s Software Inc. is a rapidly growing supplier of computer software. Sales for the last five years are given below: Year Sales ($ millions) 2010 $1.1 2011 1.5 2012 2.0 2013 2.4 2014 3.1a. Determine the logarithmic trend equation.b. By what percentage did sales increase, on average, during
The sales by Walker’s Milk and Dairy products, in millions of dollars, for the period from 2008 to 2014 are reported below. Determine the least-squares trend equation, and estimate sales for 2015. Year Code Sales ($ millions) 2008 1 $17.5 2009 2 19.0 2010 3 21.0 2011 4 22.7 2012 5 24.5 2013 6
The following table lists the annual amounts of glass cullet produced by Kimble Glass Works Inc.: Year Code Scrap (tonnes) 2008 1 2.0 2009 2 4.0 2010 3 3.0 2011 4 5.0 2012 5 6.0 2013 6 7.0 2014 7 6.0 Determine the least-squares trend equation. Estimate the amount of scrap for the year 2016.
Listed below are the net sales in millions of dollars for Home Depot Inc. and its subsidiaries from 1993 to 2012: Year Net Sales Year Net Sales Year Net Sales 1993 $ 9 239 2000 $45 738 2007 $77 349 1994 12 477 2001 53 553 2008 71 288 1995 15 470 2002 58 247 2009 66 176 1996 19 535 2003 64 816 2010
The following table lists the average price of home listings in Canada from January 2007 to January 2014. (See Connect for the CREA data set). Year Amount Year Amount Jan-14 $388 553 Jan-10 328 728 Jan-13 354 951 Jan-09 274 711 Jan-12 348 178 Jan-08 309 448 Jan-11 344 118 Jan-07 282 420a. Provide a
The CPI (Consumer Price Index) for Canada for the six years from 2005 to 2013 is listed below. On the basis of these data, determine the least squares equation, and estimate the value of the CPI for 2017. See Connect for the complete file. 2005 2006 2007 2006 2009 2010 2011 2012 2013 107.0 109.1
The numbers of bank failures for the years 2010 through 2014 are given below. Determine the least squares equation and estimate the number of failures in 2016. Year Code Number of Failures 2010 1 79 2011 2 120 2012 3 138 2013 4 184 2014 5 200
The prices and quantities of several golf items purchased by members of the men’s golf league at the Osler Bluffs Golf and Tennis Club are as follows: 2006 2011 Price Quantity Price Quantity Driver $250.00 5 $275.00 6 Putter 60.00 12 75.00 10 Iron 700.00 3 750.00 4a. Determine the simple
The sales at Roberta’s Ice Cream Stand for the last five years are as follows: Year Sales 2007 $130 000 2008 145 000 2009 120 000 2010 170 000 2011 190 000a. Find the simple index for each year using 2007 as the base year.b. Find the simple index for each year using 2007–2008 as the base year.
The current base period for the CPI is
In a Laspeyres index, the quantities are used in both the numerator and denominator. (base period, given period, oldest, newest).
In a weighted index, both the price and the are considered.
A number that measures the relative change from one period to another is called a/an .
To compute an index, the base period is always the (numerator, denominator, can be in either, always 100).
a. Use the file Stock Indexes on Connect to compare the price changes in the S&P/TSX Composite Index and the NASDAQ from 2001 to 2013. Interpret your findings.b. Use the file Stock Indexes on Connect to compare the price changes in the S&P/TSX Composite Index and the S&P 500 from 2001 to 2013.
Determine the value index for 2014 using 2009 as the base year. Interpret the index
a. Determine Laspeyres’ price index.b. Determine Paasche’s price index.c. Determine Fisher’s ideal index.
a. Determine the simple price indexes.b. Determine the simple average of the price indexes.c. Determine the simple aggregate price index for the two years.
The following table gives information on the CPI and the yearly salary of Simone Smith: Year Consumer Price Index (2002 = 100) Simone Smith’s Yearly Salary 2002 100.0 $30 000 2006 109.1 32 250 2010 116.5 36 000 2013 122.8 40 500a. What is the purchasing power of the dollar for 2013 based on the
The prices and quantities of various items sold at the Accessory Shop in July 2007 and July 2014 are as follows: 2007 2014 Item Price Quantity Price Quantity Handbags $49.00 1500 $79.00 2000 Gloves 25.00 10 30.00 12 Umbrellas 14.00 250 18.00 250 Scarves 21.00 1000 25.00 900 Hats 22.00 325 35.00 525
In 2009, the mean salary for a marketing director with a bachelor’s degree was $89 673. The CPI for 2009 was 114.4. The mean annual salary for a marketing director in the base period of 2002 (2002 = 100.0) was $69 800. What was the real income of the marketing director in 2009? How much had the
The sales of Hill Enterprises, a small injection moulding company, increased from $875 000 in 1998 to $1 596 000 in 2013. Details are in the chart below. The owner, Harry Hill, realizes that the price of raw materials used in the process have also increased over the period, so Mr. Hill wants to
a. Determine Laspeyres’ price index.b. Determine Paasche’s price index.c. Determine Fisher’s ideal index.
a. Determine the simple price indexes.b. Determine the simple average of the price indexes.c. Determine the simple aggregate price index for the two years.
WSD Bank Inc. reported $17 446 (million) in commercial loans in 2000, $19 989 in 2002, $21 468 in 2004, $21 685 in 2005, $15 922 in 2007, $18 375 for 2009, and $54 818 in 2014. Using 2000 as the base, develop a simple index for the change in the amount of commercial loans for the years 2002, 2004,
The following table gives information on the CPI and the monthly take-home pay of Bill Martin, an employee at the Jeep Corporation. Year Consumer Price Index (2002 = 100) Mr. Martin’s Monthly Take-Home Pay 2002 100.0 $2400 2007 111.5 2800 2010 116.5 2900 2013 122.8 3050a. What is the purchasing
The management of Ingalls Super Discount stores wants to construct an index of economic activity for its metropolitan area. Management contends that if the index reveals that the economy is slowing down, inventory should be kept at a low level. Three series seem to hold promise as predictors of
M Studios is studying its revenue to determine where its greatest growth has been. The business started 10 years ago, and a summary of sales is given below: Year Consumer Price Index (2002 = 100) Photographic Supplies (in thousands) Index of Photographic Services (in thousands) 2007 111.5 175 65
A special-purpose index is to be designed to monitor the overall economy of the region. Four key series were selected. After considerable deliberation it was decided to weight retail sales 20%, total bank deposits 10%, industrial production in the region 40%, and nonagricultural employment 30%. The
Determine a value index for 2014 using 2006 as the base period.
Compute Paasche’s index for 2014 using 2006 as the base period.
Compute Laspeyres’ price index for 2014 using 2006 as the base period.
Compute a simple aggregate price index. Use 2006 as the base period.
Compute a simple price index for each of the four items. Use 2006 as the base period.
Determine a value index for 2014 using 2005 as the base period.The prices of selected items for 2006 and 2014 are as follows. Quantity purchased is also listed. 2006 2014 Item Price ($) Quantity Price ($) Quantity Paper, computer (pkg) $4.99 400 $5.99 500 Paper, lined (pkg) 0.89 1000 0.99 1200
Compute Paasche’s index for 2014 using 2005 as the base period.
Compute Laspeyres’ price index for 2014 using 2005 as the base period.
Compute a simple aggregate price index. Use 2005 as the base period.
Compute a simple price index for each of the four items. Use 2005 as the base period.
Determine a value index for 2014 using 2005 as the base period. Prices for selected foods for 2005 and 2014 are given in the following table: 2005 2014 Item Price ($) Quantity Price ($) Quantity Cabbage (500 g) $0.60 2000 $0.90 1500 Carrots (bunch) 0.49 200 0.69 200 Peas (kilograms [kg]) 1.99 400
Compute Paasche’s index for 2014 using 2005 as the base period.
Compute Laspeyres’ price index for 2014 using 2005 as the base period.
Compute a simple aggregate price index for 2014. Use 2005 as the base period.
Compute a simple price index for each of the three items. Use 2005 as the base period.
Determine a value index for 2014 using 2004 as the base period. Betts Electronics purchases three replacement parts for robotic machines used in its manufacturing process. Information on the price of the replacement parts and the quantity purchased is given below: 2005 2014 Part Price ($) Quantity
Compute Paasche’s index for 2014 using 2004 as the base period.
Compute Laspeyres’ price index for 2014 using 2004 as the base period.
Compute a simple aggregate price index. Use 2004 as the base period.
Compute a simple price index for each of the four items. Use 2004 as the base period.
Compute a simple index for the closing price using the period Mar-06–Mar-10 as the base period. What can you conclude about the change in the closing price over the period?The following information was reported on food items for the years 2004 and 2014: 2004 2014 Item Price ($) Quantity Price ($)
Compute a simple index for the closing price using the period Mar-04–Mar-06 as the base period. What can you conclude about the change in the closing price over the period?
Compute a simple index for the closing price using Mar-03 as the base period. What can you conclude about the change in the closing price over the period?
Compute a simple index for the closing price. Use Mar-01 as the base period. What can you conclude about the change in the closing stock price over the period?
Refer to the table above. Compare Jan-14 with Jan-08 for the national average and each city. Which city increased the most? The following information from Blackberry Limited’s stock prices is taken from the first trading day in March each year. (See Connect for the data file and source.) Date
Refer to the table above. Use the data from Jan-14 for Calgary and Saskatoon as the base period, and compute a simple index for each city for Jan-14. Interpret your findings.
Refer to the table above. Use the data from Jan-14 for Vancouver, Calgary, and Saskatoon as the base period, and compute a simple index for each city for Jan-14. Interpret your findings.
Refer to the table above. Use the National Average as the base period, and compute a simple index for each city for Jan-08. Interpret your findings.
Refer to the table above. Use the National Average as the base period, and compute a simple index for each city for Jan-10. Interpret your findings.
Refer to the table above. Use the National Average as the base period, and compute a simple index for each city for Jan-14. Interpret your findings.
Sam Steward is a freelance Web page designer. His yearly wages for the years 2009 through 2014 are listed below. An industry index for computer programmers that reports the rate of wage inflation in the industry is also included. This index has a base of 1998. Year Wage ($ thousands) Index (1998 =
In 1998, the mean salary of plant workers at Mercury Distribution Inc. was $26 650. The salary included bonuses and overtime. By 2003, the mean salary increased to $31 972, and it was further increased to $36 382 in 2008, $37 269 in 2011, and $39 500 in 2014. The company maintains information on
The Trade Union Association maintains indexes on the hourly wages for a number of the trades. Unfortunately, the indexes do not all have the same base periods. Listed below is information on plumbers and electricians. Shift the base periods to 2000, and compare the hourly wage increases. Year
At the end of 2013, the average salary for a senior customer service representative at Mercury Distribution Inc. was $48 500. The CPI for 2013 was 122.8 (2002 = 100.0). The mean salary for the same position in the base period of 2002 was $39 000. What was the real income of the customer service
Showing 3200 - 3300
of 7357
First
26
27
28
29
30
31
32
33
34
35
36
37
38
39
40
Last
Step by Step Answers