New Semester
Started
Get
50% OFF
Study Help!
--h --m --s
Claim Now
Question Answers
Textbooks
Find textbooks, questions and answers
Oops, something went wrong!
Change your search query and then try again
S
Books
FREE
Study Help
Expert Questions
Accounting
General Management
Mathematics
Finance
Organizational Behaviour
Law
Physics
Operating System
Management Leadership
Sociology
Programming
Marketing
Database
Computer Network
Economics
Textbooks Solutions
Accounting
Managerial Accounting
Management Leadership
Cost Accounting
Statistics
Business Law
Corporate Finance
Finance
Economics
Auditing
Tutors
Online Tutors
Find a Tutor
Hire a Tutor
Become a Tutor
AI Tutor
AI Study Planner
NEW
Sell Books
Search
Search
Sign In
Register
study help
business
statistics econometrics
Statistics For The Behavioral And Social Sciences 5th Edition Arthur Aron Elliot Coups, Elaine N. Aron - Solutions
What is a decision error?
A researcher predicts that making people hungry will affect how they do on a coordination test. A randomly selected person is asked not to eat for 24 hours before taking a standard coordination test and gets a score of 400.For people in general of this age group and gender, tested under normal
Why might you use a two-tailed test even when your theory predicts a particular direction of result?
What is the advantage of using a one-tailed test when your theory predicts a particular direction of result?
Why do you use a two-tailed test when testing a nondirectional hypothesis?
What is a two-tailed test?
What is a nondirectional hypothesis test?
How is it possible that a result can be statistically significant but be of little practical importance?
A training program to increase friendliness is tried on one individual randomly selected from the general public. Among the general public (who do not get this training program) the mean on the friendliness measure is 30 with a standard deviation of 4. The researchers want to test their hypothesis
What can you conclude when (a) a result is so extreme that you reject the null hypothesis, and (b) a result is not very extreme so that you cannot reject the null hypothesis?
Why do we say that hypothesis testing involves a double negative logic?
What is the cutoff sample score?
(a) What is a comparison distribution? (b) What role does it play in hypothesis testing?
A sample of rats in a laboratory is given an experimental treatment intended to make them learn a maze faster than other rats. State (a) the null hypothesis and(b) the research hypothesis.
You apply to 20 graduate programs, 10 of which are in the United States, 5 of which are in Canada, and 5 of which are in Australia. You get a message from home that you have a letter from one of the programs to which you applied, but nothing is said about which one. Give the probability it is from
You are conducting a survey at a college with 800 students, 50 faculty members, and 150 administrators. Each of these 1,000 individuals has a single listing in the campus phone directory. Suppose you were to cut up the directory and pull out one listing at random to contact. What is the probability
Suppose that you were going to conduct a survey of visitors to your campus. You want the survey to be as representative as possible. (a) How would you select the people to survey? (b) Why would that be your best method?
A large study of concerns about terrorism among individuals living in Los Angeles(Eisenmann et al., 2009) recruited participants using “ a random digit dial survey of the Los Angeles population October 2004 through January 2005 in 6 languages.” These are procedures in which phone numbers to
Suppose you want to conduct a survey of the voting preference of undergraduate students. One approach would be to contact every undergraduate student you know and ask them to fill out a questionnaire. (a) What kind of sampling method is this? (b) What is a major limitation of this kind of approach?
Suppose that you are designing an instrument panel for a large industrial machine.The machine requires the person using it to reach 2 feet from a particular position.The reach from this position for adult women is known to have a mean of 2.8 feet with a standard deviation of .5. The reach for adult
In the example in problem 16, assume that the mean is 300 and the standard deviation is 25. Using a normal curve table, what scores would be the top and bottom score to find (a) the middle 50% of architects, (b) the middle 90% of architects, and (c) the middle 99% of architects?
In the example in problem 16, using a normal curve table, what is the minimum Z score an architect can have on the creativity test to be in the (a) top 50%,(b) top 40%, (c) top 60%, (d) top 30%, and (e) top 20%?
Suppose that the scores of architects on a particular creativity test are normally distributed. Using a normal curve table, what percentage of architects have Z scores (a) above .10, (b) below .10, (c) above .20, (d) below .20, (e) above 1.10,(f) below 1.10, (g) above and (h) below
Using the information in problem 14 and the 50%–34%–14% figures, what is the longest time to complete the word puzzle a person can have and still be in the bottom (a) 2%, (b) 16%, (c) 50%, (d) 84%, and (e) 98%?
The length of time it takes to complete a word puzzle is found to be normally distributed with a mean of 80 seconds and a standard deviation of 10 seconds. Using the 50%–34%–14% figures, approximately what percentage of scores (on time to complete the word puzzle) will be (a) above 100, (b)
Consider a test that has a normal distribution, a mean of 100, and a standard deviation of 14. How high a score would a person need to be in the top (a) 1%,(b) the top 5%?
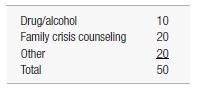
The following numbers of employees in a company received special assistance from the personnel department last year:If you were to select a score at random from the records for last year, what is the probability that it would be in each of the following categories? (a) drug/alcohol, (b) family, (c)
Tanski and colleagues (2009) conducted a telephone survey of smoking and exposure to smoking in movies among U.S. adolescents. In the method section of their article, they explained that “a nationally representative sample of 6522 US adolescents, 10 to 14 years of age, was recruited through a
A research article is concerned with the level of self-esteem of Australian high school students. The methods section emphasizes that a “random sample” of Australian high school students was surveyed. Explain to a person who has never had a course in statistics what this means and why it is
Consider a test of coordination that has a normal distribution, a mean of 50, and a standard deviation of 10. (a) How high a score would a person need to be in the top 5%? (b) Explain your answer to someone who has never had a course in statistics.
Assuming a normal curve, (a) if a person is in the top 10% of the country on mathematics ability, what is the lowest Z score this person could have? (b) If the person is in the top 1%, what would be the lowest Z score this person could have?
Assuming a normal curve, (a) if a student is in the bottom 30% of the class on Spanish ability, what is the highest Z score this person could have? (b) If the person is in the bottom 3%, what would be the highest Z score this person could have?
Using a normal curve table, give the percentage of scores between the mean and a Z score of (a) .58, (b) .59, (c) 1.46, (d) 1.56, (e)
In the test anxiety example of problems 3 and 4, using a normal curve table, what is the lowest score on the test anxiety measure a person has to have to be in(a) the top 40%, (b) the top 30%, (c) the top 20%?
In the previous problem, the measure of test anxiety has a mean of 15 and a standard deviation of 5. Using a normal curve table, what percentage of students have scores (a) above 16, (b) above 17, (c) above 18, (d) below 18, (e) below 14?
An education researcher has been studying test anxiety using a particular measure, which she administers to students prior to midterm exams. On this measure, she has found that the distribution follows a normal curve. Using a normal curve table, what percentage of students have Z scores (a) below
Using the information in problem 1 and the 50%–34%–14% figures, what is the minimum score a person has to have to be in the top (a) 2%, (b) 16%, (c) 50%,(d) 84%, and (e) 98%?
Suppose the people living in a particular city have a mean score of 40 and a standard deviation of 5 on a measure of concern about the environment. Assume that these concern scores are normally distributed. Using the 50%–34%–14% figures, approximately what percentage of people in this city have
What is meant by p < .01?1+++ A candy dish has four kinds of fruit-flavored candy: 20 apple, 20 strawberry, 5 cherry, and 5 grape. If you close your eyes and pick one piece of candy at random, what is the probability it will be either cherry or grape?
Suppose people’s scores on a particular measure are normally distributed with a mean of 50 and a standard deviation of 10. If you were to pick a person completely at random, what is the probability you would pick someone with a score on this measure higher than 60?
Suppose you have 400 pennies in a jar and 40 of them are more than 9 years old. You then mix up the pennies and pull one out. (a) What is the number of possible successful outcomes? (b) What is the number of all possible outcomes?(c) What is the probability of getting one that is more than 9 years
The probability of an event is defined as the expected relative frequency of a particular outcome. Explain what is meant by (a) relative frequency and (b) outcome.
Explain the difference between a population parameter and a sample statistic.
Explain the difference between random sampling and haphazard sampling.
Why do behavioral and social scientists usually study samples and not populations?
Explain the difference between the population and a sample for a research study.
Using the normal curve table, what Z score would you have if (a) 20% are above you, (b) 80% are below you?
Using the normal curve table, what percentage of scores are (a) between the mean and a Z score of 2.14, (b) above 2.14, (c) below 2.14?
Without using a normal curve table, about what Z score would a person have who is at the start of the top (a) 50%, (b) 16%, (c) 84%, (d) 2%?
Without using a normal curve table, about what percentage of scores on a normal curve are (a) between the mean and 2 SD above the mean, (b) below 1 SD above the mean, (c) above 2 SD below the mean?
Without using a normal curve table, about what percentage of scores on a normal curve are (a) above the mean, (b) between the mean and 1 SD above the mean, (c) between 1 and 2 SD above the mean, (d) below the mean, (e) between the mean and 1 SD below the mean, and (f) between 1 and 2 SD below the
Why is the normal curve (or at least a curve that is symmetrical and unimodal)so common in nature?
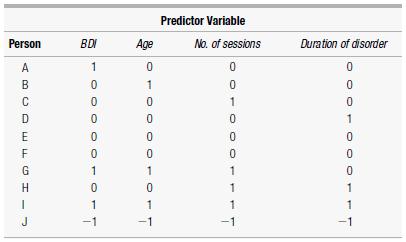
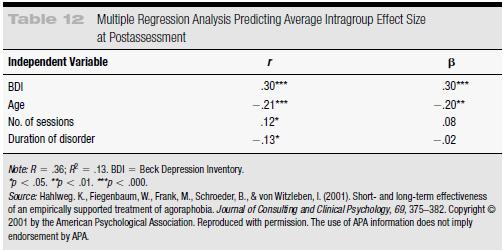
ADVANCED TOPIC: Based on Table 12 from problem 23, (a) write out the Zscore multiple regression formula for predicting average intragroup effect size at postassessment, and (b) figure the predicted Z score for average intragroup effect size at postassessment for persons A through J, whose Z scores
ADVANCED TOPIC: Hahlweg, Fiegenbaum, Frank, Schroeder, and von Witzleben(2001) carried out a study of a treatment method for agoraphobia, a condition that affects about 4% of the population and involves unpredictable panic attacks in public spaces such as shopping malls, buses, or movie theaters.
Ask five other students of the same gender as yourself (each from different families)to give you their own height and also their mother’s height. Based on the numbers these five people give you, (a) figure the correlation coefficient, and (b)determine the Z-score prediction model for predicting a
A researcher studying adjustment to the job of new employees found a correlation of .30 between amount of employees’ education and rating by job supervisors 2 months later. The researcher now plans to use amount of education to predict supervisors’later ratings of employees. Indicate the (a)
Arbitrarily select eight people, each from a different page of a newspaper. Do each of the following: (a) make a scatter diagram for the relation between the number of letters in each person’s first and last name, (b) figure the correlation coefficient for the relation between the number of
Gable and Lutz (2000) studied 65 children, 3 to 10 years old, and their parents. One of their results was: “Parental control of child eating showed a negative association with children’s participation in extracurricular activities ”(p. 296). Another result was: “Parents who held less
As part of a larger study, Speed and Gangestad (1997) colleced ratings and nominations on a number of characteristics for 66 fraternity men from their fellow fraternity members. The following paragraph is taken from their“Results” section:men’s romantic popularity significantly correlated
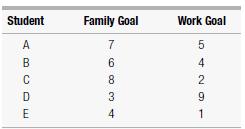
Five university students were asked about how important a goal it is to them to have a family and about how important a goal it is for them to be highly successful in their work. Each variable was measured on a scale from 0 “Not at all important goal” to 10 “Very important goal.” (For part
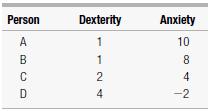
Four research participants take a test of manual dexterity (high scores mean better dexterity) and an anxiety test (high scores mean more anxiety). (For part (f), assume that dexterity is the predictor variable.) The scores are as follows: Person Dexterity Anxiety ABCD 1 10 1 2 24 8 4 -2
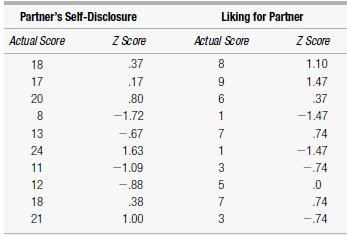
In a study of people first getting acquainted with each other, researchers reasoned the amount of self-disclosure of one’s partner (on a scale from 1 to 30) and one’s liking for one’s partner (on a scale from 1 to 10). The Z scores for the variables are given to save you some figuring. Here
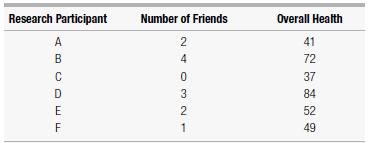
A researcher studying people in their 80s was interested in the relation between number of very close friends and overall health (on a scale from 0 to 100). The scores for six research participants are shown on the following page. Research Participant Number of Friends Overall Health A B DEE F
Make up a scatter diagram with 10 dots for each of the following situations:(a) perfect positive linear correlation, (b) strong but not perfect positive linear correlation, (c) weak positive linear correlation, (d) strong but not perfect negative linear correlation, (e) no correlation, (f) clear
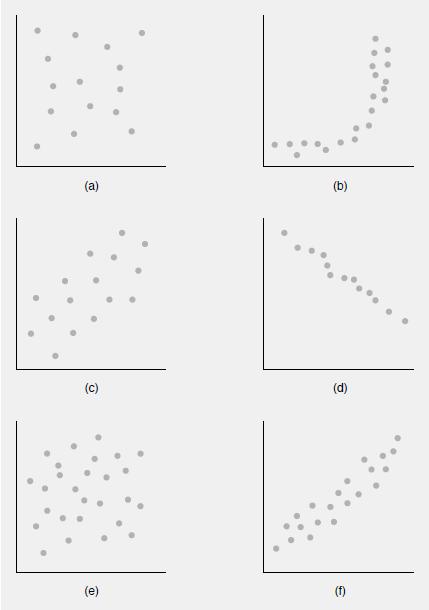
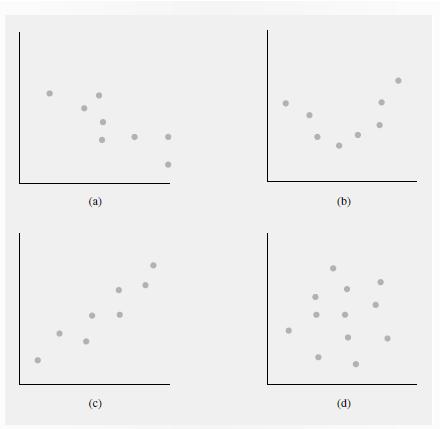
For each of the scatter diagrams on the following page, indicate whether the pattern is linear, curvilinear, or no correlation; if it is linear, indicate whether it is positive or negative and approximately how strong the correlation is (strong, moderate, small).
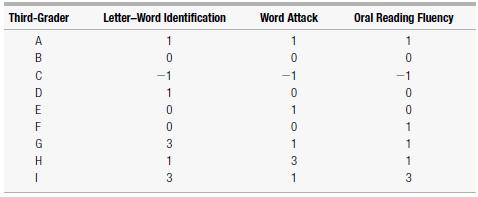
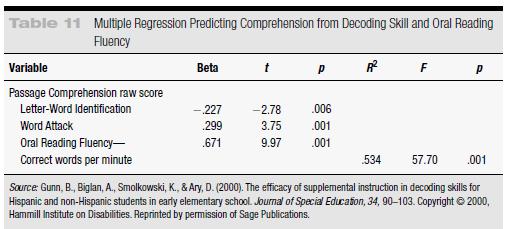
ADVANCED TOPIC: Based on Table 11 (from Gunn et al., 2000), (a) determine the Z score multiple regression formula, and (b) calculate the predicted passage comprehension Z score for each of the following third-graders (figures are Z scores): Third-Grader Letter-Word Identification Word Attack Oral
ADVANCED TOPIC: Gunn, Biglan, Smolkowski, and Ary (2000) studied reading in a group of Hispanic and non-Hispanic third-graders. As part of this study, they did an analysis predicting reading comprehension (called “passage comprehension”)from three more specific measures of reading ability:
A researcher working with hockey players found that knowledge of fitness training principles correlates .40 with number of injuries received over the subsequent year. The researcher now plans to test all new athletes for their knowledge of fitness training principles and use this information to
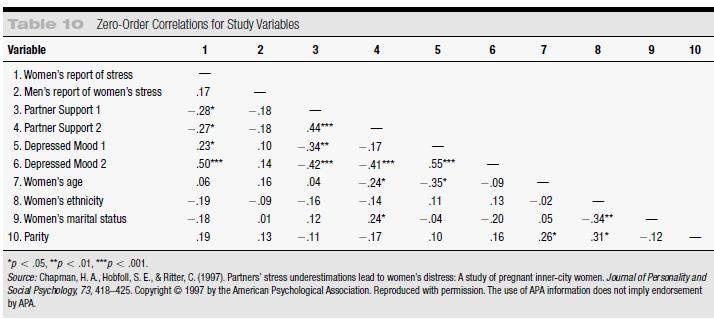
Chapman, Hobfoll, and Ritter (1997) interviewed 68 pregnant inner-city women and their husbands (or boyfriends) twice during their pregnancy, once between 3 and 6 months into the pregnancy and again between 6 and 9 months into the pregnancy.Table 10 shows the correlations among several of their
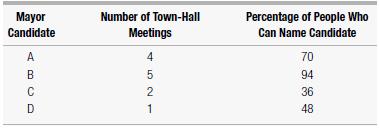
A political scientist studied the relation between the number of town-hall meetings held by the four candidates for mayor in a small town and the percentage of people in the town who could name each candidate. (For part (f), assume that the number of town-hall meetings is the predictor variable.)
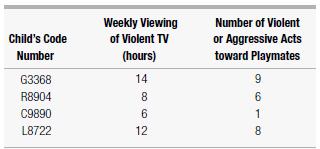
Four young children were monitored closely over a period of several weeks to measure how much they watched violent television programs and their amount of violent behavior toward their playmates. (For part (f), assume that hours watching violent television is the predictor variable.) The results
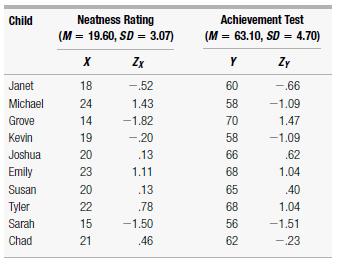
A schoolteacher thought that he had observed that students who dressed more neatly were generally better students. To test this idea, the teacher had a friend rate each of the students for neatness of dress. Following are the ratings for neatness, along with each student’s score on a standardized
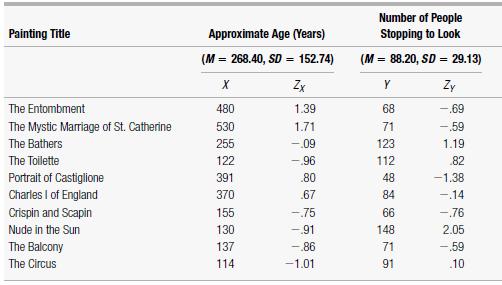
The Louvre Museum in Paris is interested in the relation of the age of a painting to public interest in it. The number of people stopping to look at each of 10 randomly selected paintings is observed over a week. The results are as shown: Painting Title Approximate Age (Years) Number of People
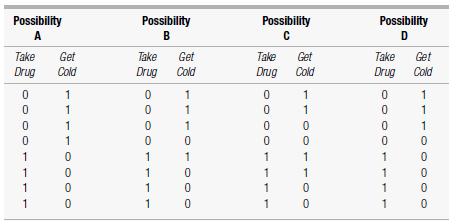
A researcher is interested in whether a new drug affects the development of a cold. Eight people are tested: four take the drug and four do not. (Those who take it are rated 1; those who don’t, 0.) Whether they get a cold (rated 1) or not (0) is recorded. Four possible results are shown. Figure
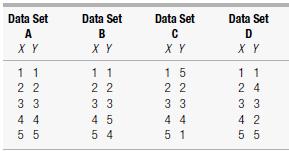
(a) The following have been prepared so that data sets B through D are slightly modified versions of data set A. Make scatter diagrams and figure the correlation coefficients for each data set. (b) Discuss how and why the correlations change. Data Set Data Set Data Set Data Set A B C D X Y X Y X Y
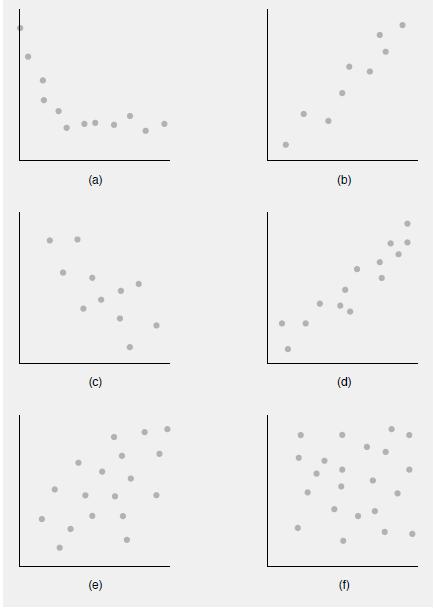
For each of the following scatter diagrams, indicate whether the pattern is linear, curvilinear, or no correlation; if it is linear, indicate whether it is positive or negative and approximately how strong the correlation is (large, moderate, small). (a) (b) (c) (d) (e) (f)
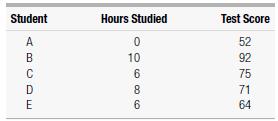
Based on the number of hours studied and the test score for the five students in the following table, make a scatter diagram and describe in words the general pattern of association. Student Hours Studied Test Score ABCDE 0 52 10 92 6 75 8 71 6 64
In multiple regression, why are the standardized regression coefficients for each predictor variable often smaller than the ordinary correlation coefficient of that predictor variable with the criterion variable?
In a multiple regression model, the standardized regression coefficient for the first predictor variable is .40 and for the second predictor variable is .70. What is the predicted criterion variable Z score for (a) a person with a Z score of on the first predictor variable and a Z score of on the
Write the multiple regression prediction model with two predictors, and define each of the symbols.
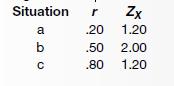
Figure the predicted Z score on the criterion variable (Y) in each of the following situations: Situation r Zx a C DO b .20 1.20 .50 2.00 .80 1.20
Write the formula for the prediction model using Z scores, and define each of the symbols.
Why does the standardized regression coefficient have this name? That is, explain the meaning of each of the three words that make up the term: standardized, regression, and coefficient.
In words, what is the prediction model using Z scores?
What does it mean to say that a particular correlation coefficient is statistically significant?
A researcher randomly assigns participants to eat zero, two, or four cookies and then asks them how full they feel. The number of cookies eaten and feeling full are highly correlated. What directions of causality can and cannot be ruled out?
If anxiety and depression are correlated, what are three possible directions of causality that might explain this correlation?
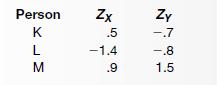
Figure the correlation coefficient for the Z scores shown below for three people who were each tested on two variables, X and Y. Person Zx Zy K .5 -.7 LM -1.4 -.8 .9 1.5
Write the formula for the correlation coefficient and define each of the symbols.
When figuring the correlation coefficient, why do you divide the sum of crossproducts of Z scores by the number of people in the study?
Give two reasons why we use Z scores for figuring the exact linear correlation between two variables, thinking of correlation as how much high scores go with high scores and lows go with lows (or vice versa for negative correlations).
Give two reasons why it is important to identify the pattern of correlation in a scatter diagram before going on to figure the linear correlation.
For each of the scatter diagrams shown in Figure 10, say whether the pattern is roughly linear, curvilinear, or no correlation. If the pattern is roughly linear, also say if it is positive or negative, and whether it is large, moderate, or small. (b) (d) (c)
What is the difference between a positive and negative linear correlation?Answer this question in terms of (a) the patterns in a scatter diagram and(b) what those patterns tell you about the relationship between the two variables.
What does it mean to say that two variables have no correlation?
What is the difference between a linear and curvilinear correlation in terms of how they appear in a scatter diagram?
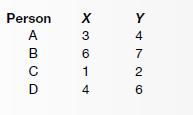
Make a scatter diagram for the following scores for four people who were each tested on two variables, X and Y. X is the variable we are predicting from; it can have scores ranging from 0 to 6. Y is the variable being predicted; it can have scores from 0 to 7. Person X A BCD 614 3 6 94728 6 Y
(a) When it is the kind of study in which one variable can be thought of as predicting another variable, which variable goes on the horizontal axis? (b) Which variable goes on the vertical axis?
What does a scatter diagram show, and what does it consist of?
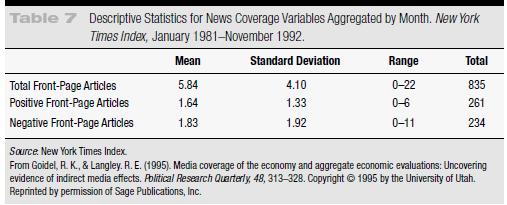
Goidel and Langley (1995) studied the positivity and negativity of newspaper accounts of economic events in the period just before the 1992 U.S. Presidential election. Table 7, reproduced from their report, describes the numbers of frontpage articles on economic news in the New York Times for the
Showing 2500 - 2600
of 7357
First
19
20
21
22
23
24
25
26
27
28
29
30
31
32
33
Last
Step by Step Answers