New Semester
Started
Get
50% OFF
Study Help!
--h --m --s
Claim Now
Question Answers
Textbooks
Find textbooks, questions and answers
Oops, something went wrong!
Change your search query and then try again
S
Books
FREE
Study Help
Expert Questions
Accounting
General Management
Mathematics
Finance
Organizational Behaviour
Law
Physics
Operating System
Management Leadership
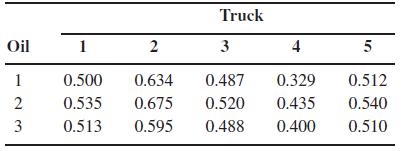
Sociology
Programming
Marketing
Database
Computer Network
Economics
Textbooks Solutions
Accounting
Managerial Accounting
Management Leadership
Cost Accounting
Statistics
Business Law
Corporate Finance
Finance
Economics
Auditing
Tutors
Online Tutors
Find a Tutor
Hire a Tutor
Become a Tutor
AI Tutor
AI Study Planner
NEW
Sell Books
Search
Search
Sign In
Register
study help
business
systems analysis and design using matlab
Design And Analysis Of Experiments 8th Edition Douglas C. Montgomery - Solutions
5.20. In Problem 5.3, suppose that we wish to reject the null hypothesis with a high probability if the difference in the true mean yield at any two pressures is as great as 0.5. If a reasonable prior estimate of the standard deviation of yield is 0.1, how many replicates should be run?
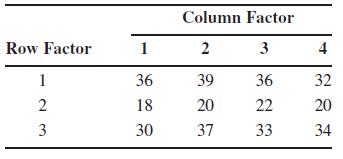
5.15. Consider the following data from a two-factor factorial experiment. Analyze the data and draw conclusions. Perform a test for nonadditivity. Use ( $ 0.05. Column Factor Row Factor 1 2 3 3 4 1 36 39 36 32 2 18 20 22 22 20 3 30 37 33 34
5.14. Derive the expected mean squares for a two-factor analysis of variance with one observation per cell, assuming that both factors are fixed.
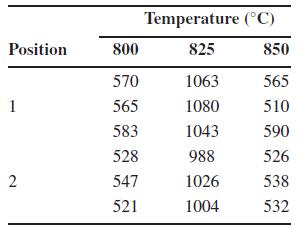
5.13. An experiment was conducted to determine whether either firing temperature or furnace position affects the baked density of a carbon anode. The data are shown below:Suppose we assume that no interaction exists. Write down the statistical model. Conduct the analysis of variance and test
5.12. Use Tukey’s test to determine which levels of the pressure factor are significantly different for the data in Problem 5.3.
5.11. Consider the experiment in Problem 5.3. Fit an appropriate model to the response data. Use this model to provide guidance concerning operating conditions for the process.
5.5. For the data in Problem 5.4, compute a 95 percent confidence interval estimate of the mean difference in response for feed rates of 0.20 and 0.25 in/min.
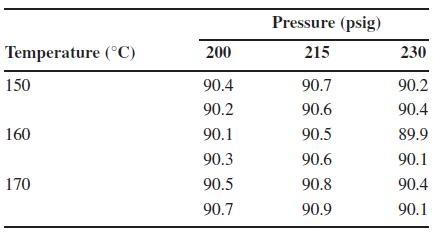
5.3. The yield of a chemical process is being studied. The two most important variables are thought to be the pressure and the temperature. Three levels of each factor are selected, and a factorial experiment with two replicates is performed.The yield data are as follows:(a) Analyze the data and
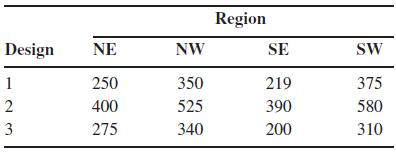
4.54. Consider the direct mail marketing experiment in Problem 4.8. Suppose that this experiment had been run as a complete randomized design, ignoring potential regional differences, but that exactly the same data was obtained. Reanalyze the experiment under this new assumption. What difference
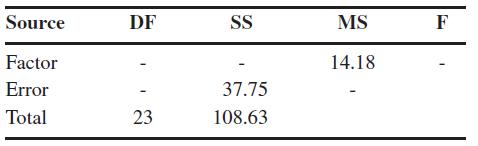
4.53. Physics graduate student Laura Van Ertia has conducted a complete randomized design with a single factor, hoping to solve the mystery of the unified theory and complete her dissertation. The results of this experiment are summarized in the following ANOVA display:Answer the following
4.52. Suppose that a single-factor experiment with five levels of the factor has been conducted. There are three replicates and the experiment has been conducted as a complete randomized design. If the experiment had been conducted in blocks, the pure error degrees of freedom would be reduced by
4.51. Extended incomplete block designs. Occasionally, the block size obeys the relationship a + k + 2a. An extended incomplete block design consists of a single replicate of each treatment in each block along with an incomplete block design with k* $ k !a. In the balanced case, the incomplete
4.50. Show that the variance of the intrablock estimators is k(a ! 1)!2/(0a2).
4.49. Verify that a BIBD with the parameters a $ 8, r $ 8, k $ 4, and b $ 16 does not exist.
4.48. Perform the interblock analysis for the design in Problem 4.42.
4.47. Perform the interblock analysis for the design in Problem 4.40.
4.46. An experimenter wishes to compare eight treatments in blocks of four runs. Find a BIBD with 14 blocks and 0 $ 3.
4.45. An experimenter wishes to compare four treatments in blocks of two runs. Find a BIBD for this experiment with six blocks.
4.44. Prove that is the adjusted sum of squaresfor treatments in a BIBD. i= k (Q(a) )
4.43. Analyze the data in Example 4.5 using the general regression significance test.
4.41. Construct a set of orthogonal contrasts for the data in Problem 4.33. Compute the sum of squares for each contrast.
4.39. Consider the randomized block design with one missing value in Problem 4.19. Analyze this data by using the exact analysis of the missing value problem discussed in Section 4.1.4. Compare your results to the approximate analysis of these data given from Problem 4.19.
4.38. Consider the data in Problems 4.23 and 4.36.Suppressing the Greek letters in problem 4.36, analyze the data using the method developed in Problem 4.32.
4.37. Construct a 5 & 5 hypersquare for studying the effects of five factors. Exhibit the analysis of variance table for this design.
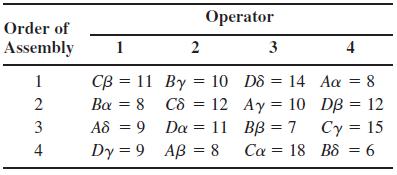
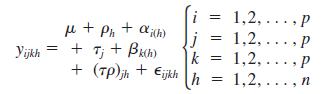
4.36. Suppose that in Problem 4.23 the engineer suspects that the workplaces used by the four operators may represent an additional source of variation. A fourth factor, workplace((, ", 5, *) may be introduced and another experiment conducted, yielding the Graeco-Latin square that follows.Analyze
4.34. Suppose that in Problem 4.22 the data taken on day 5 were incorrectly analyzed and had to be discarded. Develop an appropriate analysis for the remaining data.
4.33. Discuss how the operating characteristics curves in the Appendix may be used with the Latin square design.
4.32. Designs involving several Latin squares. [See Cochran and Cox (1957), John (1971).] The p & p Latin square contains only p observations for each treatment. To obtain more replications the experimenter may use several squares, say n. It is immaterial whether the squares used are the same
4.31. Derive the missing value formula (Equation 4.27) for the Latin square design.
4.30. Consider a p & p Latin square with rows ((i), columns ("k), and treatments (.j) fixed. Obtain least squares estimates of the model parameters (i, "k, and .j.
4.29. Suppose that in Problem 4.20 the observation from batch 3 on day 4 is missing. Estimate the missing value and perform the analysis using the value.
4.28. Consider the gene expression experiment in Problem 4.12. Assume that the subjects used in this experiment are random.Estimate the block variance component.
4.27. Consider the randomized complete block design in Problem 4.11. Assume that the software projects that were used as blocks are random. Estimate the block variance component.
4.26. Consider the randomized complete block design in Problem 4.9. Assume that the trucks are random. Estimate the block variance component.
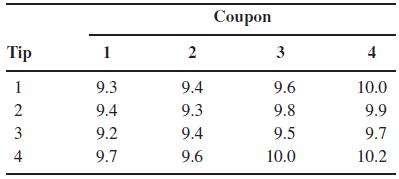
4.25. Consider the randomized complete block design in Problem 4.7. Assume that the coupons are random. Estimate the block variance component.
4.24. Consider the randomized complete block design in Problem 4.4. Assume that the days are random. Estimate the block variance component.
4.20. Two missing values in a randomized block. Suppose that in Problem 4.3 the observations for chemical type 2 and bolt 3 and chemical type 4 and bolt 4 are missing.(a) Analyze the design by iteratively estimating the missing values, as described in Section 4.1.3.(b) Differentiate SSE with
4.19. Consider the hardness testing experiment in Problem 4.7. Suppose that the observation for tip 2 in coupon 3 is missing. Analyze the problem by estimating the missing value.
4.18. Suppose that the observation for chemical type 2 and bolt 3 is missing in Problem 4.3. Analyze the problem by estimating the missing value. Perform the exact analysis and compare the results.
4.17. Draw an operating characteristic curve for the design in Problem 4.4. Does the test seem to be sensitive to small differences in the treatment effects?
4.16. Assuming that chemical types and bolts are fixed, estimate the model parameters .i and "j in Problem 4.3.
4.15. Analyze the data in Problem 4.4 using the general regression significance test.
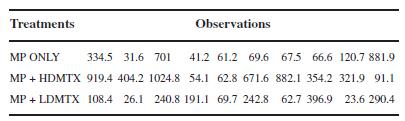
4.12. An article in Nature Genetics (2003, Vol. 34, pp.85–90) “Treatment-Specific Changes in Gene Expression Discriminate in vivo Drug Response in Human Leukemia Cells” studied gene expression as a function of different treatments for leukemia. Three treatment groups are: mercaptopurine(MP)
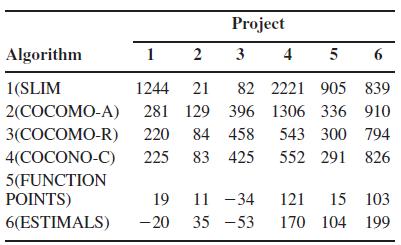
4.11. An article in Communications of the ACM (Vol. 30, No. 5, 1987) studied different algorithms for estimating software development costs. Six algorithms were applied to several different software development projects and the percent error in estimating the development cost was observed.Some of
4.9. The effect of three different lubricating oils on fuel economy in diesel truck engines is being studied. Fuel economy is measured using brake-specific fuel consumption after the engine has been running for 15 minutes. Five different truck engines are available for the study, and the
4.8. A consumer products company relies on direct mail marketing pieces as a major component of its advertising campaigns. The company has three different designs for a new brochure and wants to evaluate their effectiveness, as there are substantial differences in costs between the three designs.
4.7. Consider the hardness testing experiment described in Section 4.1. Suppose that the experiment was conducted as described and that the following Rockwell C-scale data(coded by subtracting 40 units) obtained:(a) Analyze the data from this experiment.(b) Use the Fisher LSD method to make
4.6. Plot the average bacteria counts for each solution in Problem 4.4 and compare them to a scaled t distribution. What conclusions can you draw?
4.5. Plot the mean tensile strengths observed for each chemical type in Problem 4.3 and compare them to an appropriately scaled t distribution. What conclusions would you draw from this display?
4.2. Consider the single-factor completely randomized single factor experiment shown in Problem 3.4. Suppose that this experiment had been conducted in a randomized complete block design, and that the sum of squares for blocks was 80.00.Modify the ANOVA for this experiment to show the correct
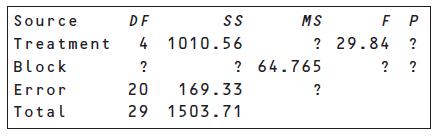
4.1. The ANOVA from a randomized complete block experiment output is shown below.(a) Fill in the blanks. You may give bounds on the P-value.(b) How many blocks were used in this experiment?(c) What conclusions can you draw? Source DF Treatment 4 1010.56 ss MS F P ? 29.84 ? Block ? ? 64.765 ? ?
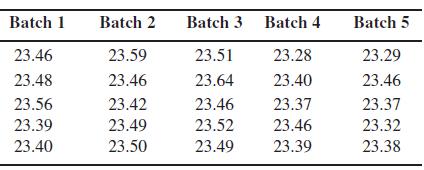
3.55. A manufacturer suspects that the batches of raw material furnished by his supplier differ significantly in calcium content. There are a large number of batches currently in the warehouse. Five of these are randomly selected for study.A chemist makes five determinations on each batch and
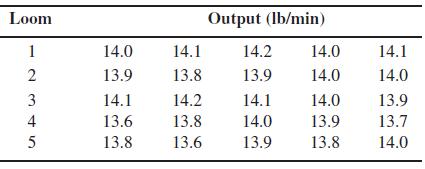
3.54. A textile mill has a large number of looms. Each loom is supposed to provide the same output of cloth per minute. To investigate this assumption, five looms are chosen at random, and their output is noted at different times. The following data are obtained:(a) Explain why this is a random
3.53. Consider the experiment in Example 3.5. Suppose that the largest observation on etch rate is incorrectly recorded as 250 Å/min. What effect does this have on the usual analysis of variance? What effect does it have on the Kruskal–Wallis test?
3.52. Use the Kruskal–Wallis test for the experiment in Problem 3.23. Are the results comparable to those found by the usual analysis of variance?
3.51. Use the Kruskal–Wallis test for the experiment in Problem 3.23. Compare the conclusions obtained with those from the usual analysis of variance.
3.50. Apply the general regression significance test to the experiment in Example 3.5. Show that the procedure yields the same results as the usual analysis of variance.
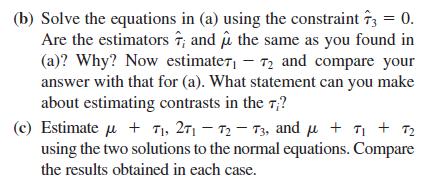
3.49. Consider the data shown in Problem 3.22.(a) Write out the least squares normal equations for this problem and solve them for and ;, using the usual constraint = 0). Estimate 71 - 72.
3.47. Refer to the aluminum smelting experiment in Section 3.8.3. Verify the ANOVA for pot noise summarized in Table 3.16. Examine the usual residual plots and comment on the experimental validity.
means is at least 0.90? Assume that ( $ 0.05 and that a reasonable estimate of the error variance is !2 $ 25.3.45. Refer to Problem 3.44.(a) How would your answer change if a reasonable estimate of the experimental error variance were !2 $ 36?(b) How would your answer change if a reasonable
3.44. Suppose that four normal populations have means of$1 $ 50, $2 $ 60, $3 $ 50, and $4 $ 60. How many observations should be taken from each population so that the probability of rejecting the null hypothesis of equal population
3.43. Consider the experiment in Problem 3.26. If we wish to construct a 95 percent confidence interval on the difference in two mean battery lives that has an accuracy of )2 weeks, how many batteries of each brand must be tested?
3.42. Refer to Problem 3.26.(a) If we wish to detect a maximum difference in battery life of 10 hours with a probability of at least 0.90, what sample size should be used? Discuss how you would obtain a preliminary estimate of !2 for answering this question.(b) If the difference between brands is
3.41. Refer to Problem 3.22. If we wish to detect a maximum difference in mean response times of 10 milliseconds with a probability of at least 0.90, what sample size should be used?How would you obtain a preliminary estimate of !2?
3.40. Use the modified Levene test to determine if the assumption of equal variances is satisfied in Problem 3.26.Use ( $ 0.05. Did you reach the same conclusion regarding the equality of variances by examining residual plots?
3.39. Use Bartlett’s test to determine if the assumption of equal variances is satisfied in Problem 3.24. Use ( $ 0.05.Did you reach the same conclusion regarding equality of variances by examining residual plots?
3.38. In a fixed effects experiment, suppose that there are n observations for each of the four treatments. Let be single-degree-of-freedom components for the orthogonal contrasts.Prove that SSTreatments $ .
3.37. Show that the variance of the linear combination ciyi. is !2 .
3.35. Consider the single-factor random effects model discussed in this chapter. Develop a procedure for finding a 100(1 – ()% confidence interval on the ratio 222(22. % 22).Assume that the experiment is balanced.
3.33. Consider the vapor-deposition experiment described in Problem 3.32.(a) Estimate the total variability in the uniformity response.(b) How much of the total variability in the uniformity response is due to the difference between positions in the reactor?(c) To what level could the variability
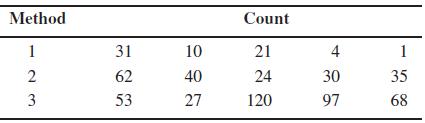
3.29. A semiconductor manufacturer has developed three different methods for reducing particle counts on wafers. All three methods are tested on five different wafers and the after treatment particle count obtained. The data are shown below:(a) Do all methods have the same effect on mean particle
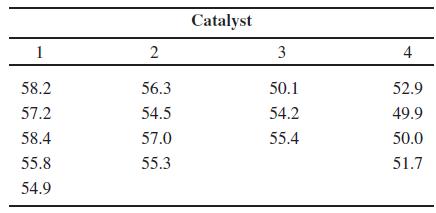
3.27. Four catalysts that may affect the concentration of one component in a three-component liquid mixture are being investigated. The following concentrations are obtained from a completely randomized experiment:(a) Do the four catalysts have the same effect on the concentration?(b) Analyze the
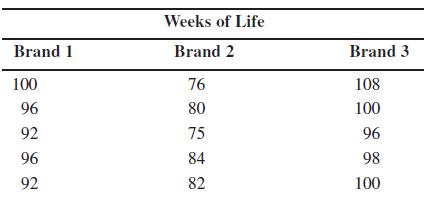
3.26. Three brands of batteries are under study. It is suspected that the lives (in weeks) of the three brands are different.Five randomly selected batteries of each brand are tested with the following results:(a) Are the lives of these brands of batteries different?(b) Analyze the residuals from
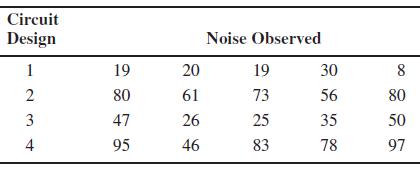
3.24. Four different designs for a digital computer circuit are being studied to compare the amount of noise present. The following data have been obtained:(a) Is the same amount of noise present for all four designs? Use ( $ 0.05.(b) Analyze the residuals from this experiment. Are the analysis of
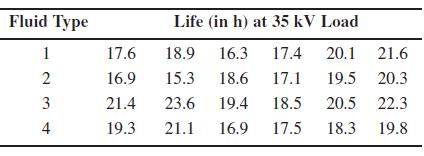
3.23. The effective life of insulating fluids at an accelerated load of 35 kV is being studied. Test data have been obtained for four types of fluids. The results from a completely randomized experiment were as follows:(a) Is there any indication that the fluids differ? Use ( $0.05.(b) Which fluid
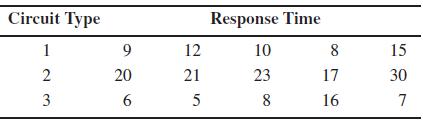
3.22. The response time in milliseconds was determined for three different types of circuits that could be used in an automatic valve shutoff mechanism. The results from a completely randomized experiment are shown in the following table:(a) Test the hypothesis that the three circuit types have the
3.19. Reconsider the experiment from Problem 3.18.Analyze the residuals and draw conclusions about model adequacy.
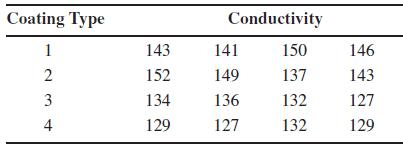
3.18. A manufacturer of television sets is interested in the effect on tube conductivity of four different types of coating for color picture tubes. A completely randomized experiment is conducted and the following conductivity data are obtained:(a) Is there a difference in conductivity due to
3.17. Rework part (d) of Problem 3.16 using the Tukey method. What conclusions can you draw? Explain carefully how you modified the technique to account for unequal sample sizes.
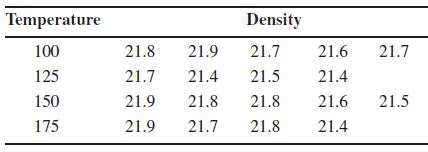
3.16. An experiment was run to determine whether four specific firing temperatures affect the density of a certain type of brick. A completely randomized experiment led to the following data:(a) Does the firing temperature affect the density of the bricks? Use ( $ 0.05.(b) Is it appropriate to
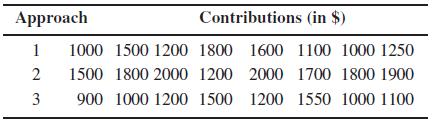
3.15. A regional opera company has tried three approaches to solicit donations from 24 potential sponsors. The 24 potential sponsors were randomly divided into three groups of eight, and one approach was used for each group. The dollar amounts of the resulting contributions are shown in the
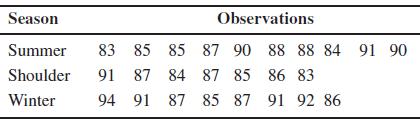
3.14. I belong to a golf club in my neighborhood. I divide the year into three golf seasons: summer (June–September), winter(November–March), and shoulder (October, April, and May).I believe that I play my best golf during the summer (because I have more time and the course isn’t crowded) and
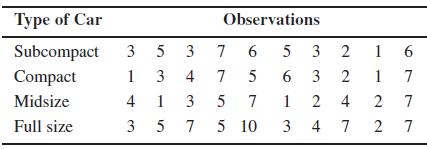
3.13. A rental car company wants to investigate whether the type of car rented affects the length of the rental period. An experiment is run for one week at a particular location, and 10 rental contracts are selected at random for each car type.The results are shown in the following table.(a) Is
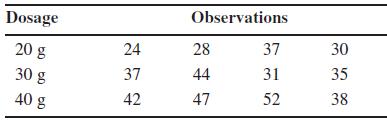
3.12. A pharmaceutical manufacturer wants to investigate the bioactivity of a new drug. A completely randomized single-factor experiment was conducted with three dosage levels, and the following results were obtained.(a) Is there evidence to indicate that dosage level affects bioactivity? Use ( $
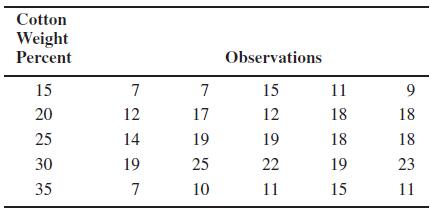
3.11. Reconsider the experiment described in Problem 3.10. Suppose that 30 percent cotton content is a control. Use Dunnett’s test with ( $ 0.05 to compare all of the other means with the control.
3.10. A product developer is investigating the tensile strength of a new synthetic fiber that will be used to make cloth for men’s shirts. Strength is usually affected by the percentage of cotton used in the blend of materials for the fiber. The engineer conducts a completely randomized
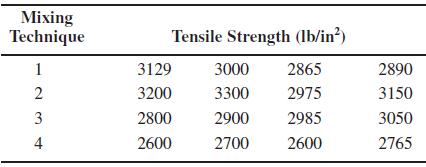
3.9. Reconsider the experiment in Problem 3.7. Find a 95 percent confidence interval on the mean tensile strength of the Portland cement produced by each of the four mixing techniques.Also find a 95 percent confidence interval on the difference in means for techniques 1 and 3. Does this aid you in
3.8(a) Rework part (c) of Problem 3.7 using Tukey’s test with ( $ 0.05. Do you get the same conclusions from Tukey’s test that you did from the graphical procedure and/or the Fisher LSD method?(b) Explain the difference between the Tukey and Fisher procedures.
3.7. The tensile strength of Portland cement is being studied.Four different mixing techniques can be used economically.A completely randomized experiment was conducted and the following data were collected:(a) Test the hypothesis that mixing techniques affect the strength of the cement. Use ( $
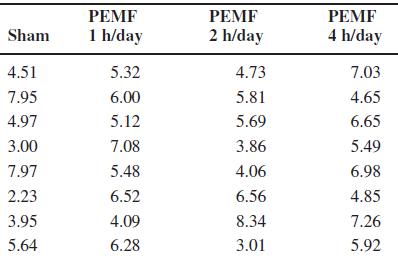
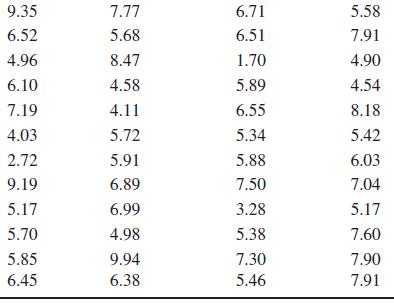
3.6. An article in Bioelectromagnetics (“Electromagnetic Effects on Forearm Disuse Osteopenia: A Randomized, Double-Blind, Sham-Controlled Study,” Vol. 32, 2011, pp.273–282) described a randomized, double-blind, sham-controlled, feasibility and dosing study to determine if a common pulsing
3.5. An article appeared in The Wall Street Journal on Tuesday, April 27, 2010, with the title “Eating Chocolate Is Linked to Depression.” The article reported on a study funded by the National Heart, Lung and Blood Institute (part of the National Institutes of Health) and conducted by faculty
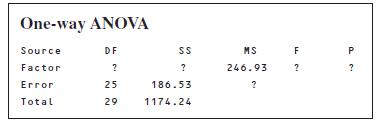
3.4. A computer ANOVA output is shown below. Fill in the blanks. You may give bounds on the P-value. One-way ANOVA Source DF SS MS F Factor ? ? 246.93 2 Error 25 186.53 Total 29 1174.24 P ?
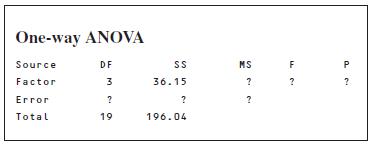
3.3. A computer ANOVA output is shown below. Fill in the blanks. You may give bounds on the P-value. One-way ANOVA Source DF SS MS F P Factor 3 36.15 ? ? ? Error ? ? ? Total 19 196.04
3.2. An experimenter has conducted a single-factor experiment with six levels of the factor, and each factor level has been replicated three times. The computed value of the F- statistic is F0 $ 5.81. Find bounds on the P-value.
3.1. An experimenter has conducted a single-factor experiment with four levels of the factor, and each factor level has been replicated six times. The computed value of the F-statistic is F0 $ 3.26. Find bounds on the P-value.
2.48. Consider the data from Problem 2.24. If the mean fill volume of the two machines differ by as much as 0.25 ounces, what is the power of the test used in Problem 2.19? What sample size would result in a power of at least 0.9 if the actual difference in mean fill volume is 0.25 ounces?
2.47. Reconsider the bottle filling experiment described in Problem 2.24. Rework this problem assuming that the two population variances are unknown but equal.
2.46. Consider the experiment described in Problem 2.26.If the mean burning times of the two flares differ by as much as 2 minutes, find the power of the test. What sample size would be required to detect an actual difference in mean burning time of 1 minute with a power of at least 0.90?
2.44. Develop an equation for finding a 100 (1 ! () percent confidence interval on the difference in the means of two normal distributions where . Apply your equation to the Portland cement experiment data, and find a 95 percent confidence interval.
2.43. Develop Equation 2.50 for a 100(1 ! () percent confidence interval for the ratio , where and are the variances of two normal distributions.
Showing 1800 - 1900
of 2697
First
12
13
14
15
16
17
18
19
20
21
22
23
24
25
26
Last
Step by Step Answers