New Semester
Started
Get
50% OFF
Study Help!
--h --m --s
Claim Now
Question Answers
Textbooks
Find textbooks, questions and answers
Oops, something went wrong!
Change your search query and then try again
S
Books
FREE
Study Help
Expert Questions
Accounting
General Management
Mathematics
Finance
Organizational Behaviour
Law
Physics
Operating System
Management Leadership
Sociology
Programming
Marketing
Database
Computer Network
Economics
Textbooks Solutions
Accounting
Managerial Accounting
Management Leadership
Cost Accounting
Statistics
Business Law
Corporate Finance
Finance
Economics
Auditing
Tutors
Online Tutors
Find a Tutor
Hire a Tutor
Become a Tutor
AI Tutor
AI Study Planner
NEW
Sell Books
Search
Search
Sign In
Register
study help
business
systems analysis and design using matlab
Design And Analysis Of Experiments 8th Edition Douglas C. Montgomery - Solutions
8.15. Analyze the data in Problem 6.26 as if it came from a design with I $ ABCD. Project the design into a full factorial in the subset of the original four factors that appear to be significant.
8.14. Consider the 25 design in Problem 6.24. Suppose that only a one-half fraction could be run. Furthermore, two days were required to take the 16 observations, and it was necessary to confound the 25!1 design in two blocks. Construct the design and analyze the data.
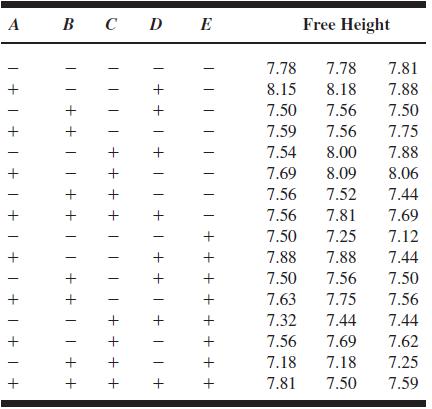
8.12. Consider the leaf spring experiment in Problem 8.7.Suppose that factor E (quench oil temperature) is very difficult to control during manufacturing. Where would you set factors A, B, C, and D to reduce variability in the free height as much as possible regardless of the quench oil temperature
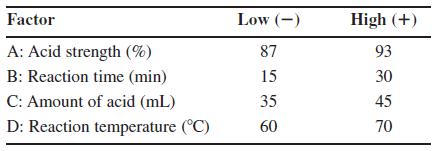
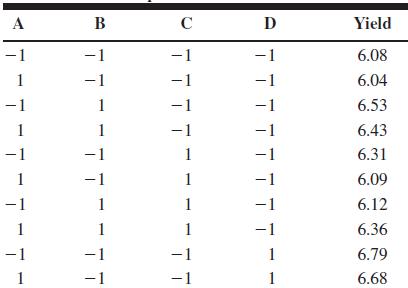
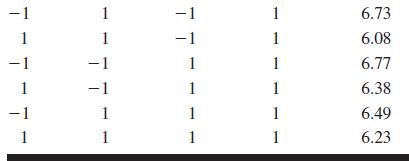
8.11. An article in Industrial and Engineering Chemistry(“More on Planning Experiments to Increase Research Efficiency,” 1970, pp. 60–65) uses a 25!2 design to investigate the effect of A $ condensation temperature, B $ amount of material 1, C $ solvent volume, D $ condensation time, and E $
8.10. An article by J. J. Pignatiello Jr. and J. S. Ramberg in the Journal of Quality Technology (Vol. 17, 1985, pp.198–206) describes the use of a replicated fractional factorial to investigate the effect of five factors on the free height of leaf springs used in an automotive application. The
8.9. R. D. Snee (“Experimenting with a Large Number of Variables,” in Experiments in Industry: Design, Analysis and Interpretation of Results, by R. D. Snee, L. B. Hare, and J. B.Trout, Editors, ASQC, 1985) describes an experiment in which a 25!1 design with I $ ABCDE was used to investigate
8.8. Continuation of Problem 8.6. Reconsider the 24!1 fractional factorial design with I $ ABCD from Problem 8.6. Set a partial fold-over of this fraction to isolate the AB interaction. Select the appropriate set of responses from the full factorial data in Example 6.6 and analyze the resulting
8.7. Continuation of Problem 8.6. In Exercise 6.6, we found that all four main effects and the two-factor AB interaction were significant. Show that if the alternate fraction(I$!ABCD) is added to the 24!1 design in Problem 8.6 that the analysis of the results from the combined design produce
8.6. In Example 6.6, a 24 factorial design was used to improve the response rate to a credit card mail marketing offer. Suppose that the researchers had used the 24!1 fractional factorial design with I $ ABCD instead. Set up the design and select the responses for the runs from the full factorial
8.5. Continuation of Problem 8.4. Suppose you have made the eight runs in the 25!2 design in Problem 8.4. What additional runs would be required to identify the factor effects that are of interest? What are the alias relationships in the combined design?
8.4. Problem 6.24 describes a process improvement study in the manufacturing process of an integrated circuit. Suppose that only eight runs could be made in this process. Set up an appropriate 25!2 design and find the alias structure. Use the appropriate observations from Problem 6.24 as the
8.3. Consider the plasma etch experiment described in Example 6.1. Suppose that only a one-half fraction of the design could be run. Set up the design and analyze the data.
8.2. Suppose that in Problem 6.15, only a one-half fraction of the 24 design could be run. Construct the design and perform the analysis, using the data from replicate I.
7.27. Construct a 23 design with ABC confounded in the first two replicates and BC confounded in the third. Outline the analysis of variance and comment on the information obtained.
7.26. Suppose that in Problem 6.7 ABCD was confounded in replicate I and ABC was confounded in replicate II.Perform the statistical analysis of this design.
7.25. Repeat the analysis of Problem 6.1 assuming that ABC was confounded with blocks in each replicate.
7.24. Suppose that in Problem 6.1 we had confounded ABC in replicate I, AB in replicate II, and BC in replicate III.Calculate the factor effect estimates. Construct the analysis of variance table.
7.22. Consider the 22 design in two blocks with AB confounded.Prove algebraically that SSAB $ SSBlocks.
7.20. Design an experiment for confounding a 26 factorial in four blocks. Suggest an appropriate confounding scheme, different from the one shown in Table 7.8.
7.19. The design in Problem 6.42 is a 23 factorial replicated twice. Suppose that each replicate was a block. Analyze all of the responses from this blocked design. Are the results comparable to those from Problem 6.42? Is the block effect large?
7.18. The design in Problem 6.40 is a 24 factorial. Set up this experiment in two blocks with ABCD confounded.Analyze the data from this design. Is the block effect large?
7.17. Repeat Problem 6.16 using a design in two blocks.
7.16. The experiment in Problem 6.39 is a 25 factorial.Suppose that this design had been run in four blocks of eight runs each.(a) Recommend a blocking scheme and set up the design.(b) Analyze the data from this blocked design. Is blocking important?
7.15. Consider the isatin yield experiment in Problem 6.38.Set up the 24 experiment in this problem in two blocks with ABCD confounded. Analyze the data from this design. Is the block effect large?
7.14. Consider the direct mail experiment in Problem 6.24. Suppose that each group of customers is in a different part of the country. Suggest an appropriate analysis for the experiment.
7.13. Using the data from the 24 design in Problem 6.22, construct and analyze a design in two blocks with ABCD confounded with blocks.
7.12. Consider the potting experiment in Problem 6.21.Analyze the data considering each replicate as a block.
7.11. Consider the fill height deviation experiment in Problem 6.20. Suppose that only four runs could be made on each shift. Set up a design with ABC confounded in replicate 1 and AC confounded in replicate 2. Analyze the data and comment on your findings.
7.10. Consider the fill height deviation experiment in Problem 6.18. Suppose that each replicate was run on a separate day.Analyze the data assuming that days are blocks.
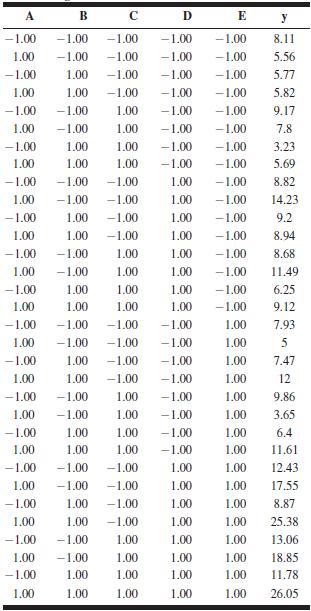
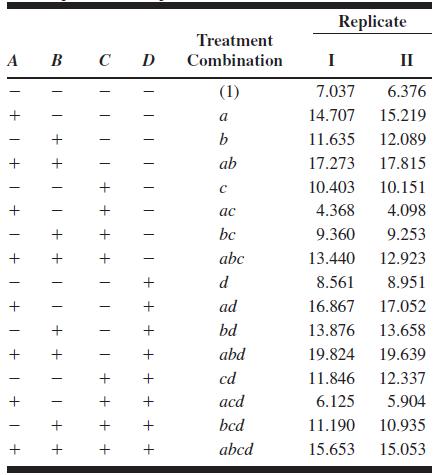
7.9. Consider the data from the 25 design in Problem 6.26.Suppose that it was necessary to run this design in four blocks with ACDE and BCD (and consequently ABE) confounded.Analyze the data from this design.
7.8. Repeat Problem 7.7 assuming that four blocks are necessary. Suggest a reasonable confounding scheme.
7.7. Using the data from the 25 design in Problem 6.26, construct and analyze a design in two blocks with ABCDE confounded with blocks.
7.6. Repeat Problem 7.5 assuming that four blocks are required. Confound ABD and ABC (and consequently CD)with blocks.
7.5. Consider the data from the first replicate of Problem 6.7. Construct a design with two blocks of eight observations each with ABCD confounded. Analyze the data.
7.4. Consider the data from the first replicate of Problem 6.1. Suppose that these observations could not all be run using the same bar stock. Set up a design to run these observations in two blocks of four observations each with ABC confounded.Analyze the data.
7.3. Consider the alloy cracking experiment described in Problem 6.15. Suppose that only 16 runs could be made on a single day, so each replicate was treated as a block. Analyze the experiment and draw conclusions.
7.2. Consider the experiment described in Problem 6.5.Analyze this experiment assuming that each one of the four replicates represents a block.
7.1. Consider the experiment described in Problem 6.1.Analyze this experiment assuming that each replicate represents a block of a single production shift.
6.45. Suppose that you want to run a 23 factorial design. The variance of an individual observation is expected to be about 4.Suppose that you want the length of a 95 percent confidence interval on any effect to be less than or equal to 1.5. How many replicates of the design do you need to run?
6.44. Hierarchical models. Several times we have used the hierarchy principle in selecting a model; that is, we have included nonsignificant lower order terms in a model because they were factors involved in significant higher order terms.Hierarchy is certainly not an absolute principle that must
6.43. Often the fitted regression model from a 2k factorial design is used to make predictions at points of interest in the design space. Assume that the model contains all main effects and two-factor interactions.(a) Find the variance of the predicted response at a point x1, x2, . . . , xk in the
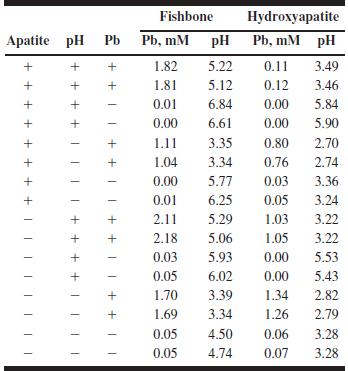
6.42. An article in the Journal of Hazardous Materials(“Feasibility of Using Natural Fishbone Apatite as a Substitute for Hydroxyapatite in Remediating Aqueous Heavy Metals,”Vol. 69, Issue 2, 1999, pp. 187–196) describes an experiment to study the suitability of fishbone, a natural, apatite
6.41. Continuation of Problem 6.40. The experiment in Problem 6.40 actually included six center points. The responses at these conditions were 35, 35, 35, 36, 36, and 34.Is there any indication of curvature in the response function?Are additional experiments necessary? What would you recommend
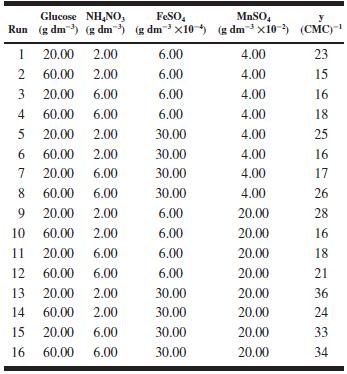
6.40. A paper in the Journal of Chemical Technology and Biotechnology (“Response Surface Optimization of the Critical Media Components for the Production of Surfactin,”1997, Vol. 68, pp. 263–270) describes the use of a designed experiment to maximize surfactin production. A portion of the
6.39. An article in Quality and Reliability Engineering International (2010, Vol. 26, pp. 223–233) presents a 25 factorial design. The experiment is shown in Table P6.12.(a) Analyze the data from this experiment. Identify the significant factors and interactions.(b) Analyze the residuals from
6.38. The book by Davies (Design and Analysis of Industrial Experiments) describes an experiment to study the yield of isatin. The factors studied and their levels are as follows:The data from the 24 factorial is shown in Table P6.11.(a) Fit a main-effects-only model to the data from this
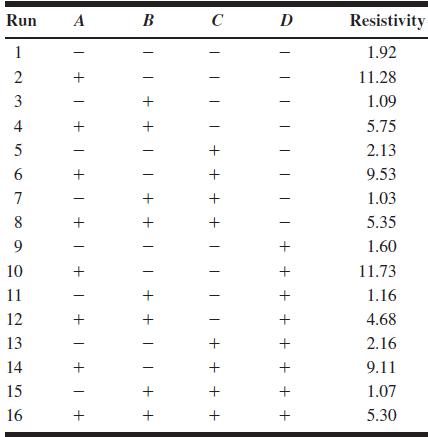
6.37. Continuation of Problem 6.36. Suppose that the experimenter had also run four center points along with the 16 runs in Problem 6.36. The resistivity measurements at the center points are 8.15, 7.63, 8.95, and 6.48. Analyze the experiment again incorporating the center points. What conclusions
6.36. Resistivity on a silicon wafer is influenced by several factors. The results of a 24 factorial experiment performed during a critical processing step is shown in Table P6.10.(a) Estimate the factor effects. Plot the effect estimates on a normal probability plot and select a tentative
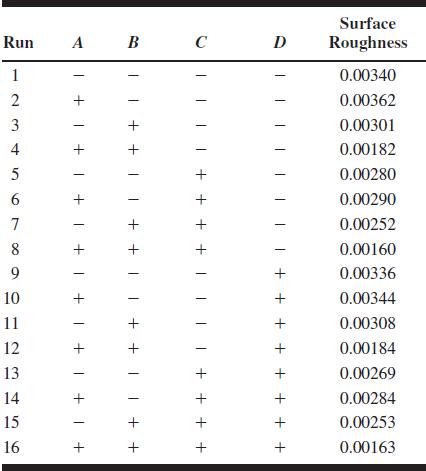
6.35. An engineer has performed an experiment to study the effect of four factors on the surface roughness of a machined part. The factors (and their levels) are A $ tool angle (12, 15°), B $ cutting fluid viscosity (300, 400), C $feed rate (10 and 15 in./min), and D $ cutting fluid cooler used
6.33. Consider the single replicate of the 24 design in Example 6.2. Suppose that we ran five points at the center(0, 0, 0, 0) and observed the responses 93, 95, 91, 89, and 96. Test for curvature in this experiment. Interpret the results.
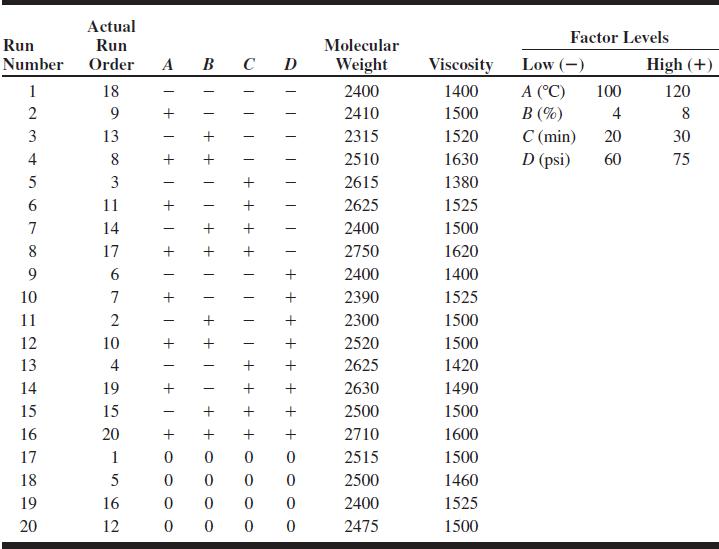
6.32. Continuation of Problem 6.31. Use the regression models for molecular weight and viscosity to answer the following questions.(a) Construct a response surface contour plot for molecular weight. In what direction would you adjust the process variables to increase molecular weight?(b) Construct
6.31. An experiment was conducted on a chemical process that produces a polymer. The four factors studied were temperature(A), catalyst concentration (B), time (C), and pressure(D). Two responses, molecular weight and viscosity, were observed. The design matrix and response data are shown in Table
6.29. Continuation of Problem 6.28. Use the regression model in part (c) of Problem 6.28 to generate a response surface contour plot of yield. Discuss the practical value of this response surface plot.
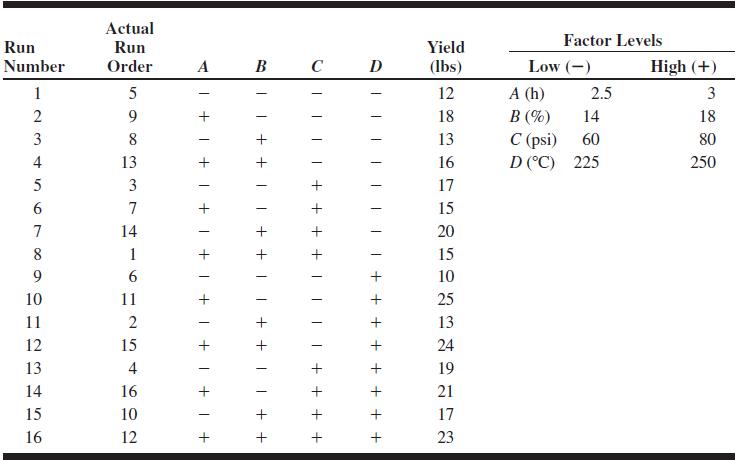
6.28. In a process development study on yield, four factors were studied, each at two levels: time (A), concentration(B), pressure (C), and temperature (D). A single replicate of a 24 design was run, and the resulting data are shown in Table P6.7.(a) Construct a normal probability plot of the
6.27. Continuation of Problem 6.26. Suppose that the experimenter had run four center points in addition to the 32 trials in the original experiment. The yields obtained at the center point runs were 68, 74, 76, and 70.(a) Reanalyze the experiment, including a test for pure quadratic curvature.(b)
6.25. Consider the single replicate of the 24 design in Example 6.2. Suppose that we had arbitrarily decided to analyze the data assuming that all three- and four-factor interactions were negligible. Conduct this analysis and compare your results with those obtained in the example. Do you think
6.24. A company markets its products by direct mail. An experiment was conducted to study the effects of three factors on the customer response rate for a particular product. The three factors are A $ type of mail used (3rd class, 1st class), B $ type of descriptive brochure (color,
6.23. Reconsider the experiment described in Problem 6.20.Suppose that four center points are available and that the UEC response at these four runs is 0.98, 0.95, 0.93, and 0.96, respectively.Reanalyze the experiment incorporating a test for curvature into the analysis. What conclusions can you
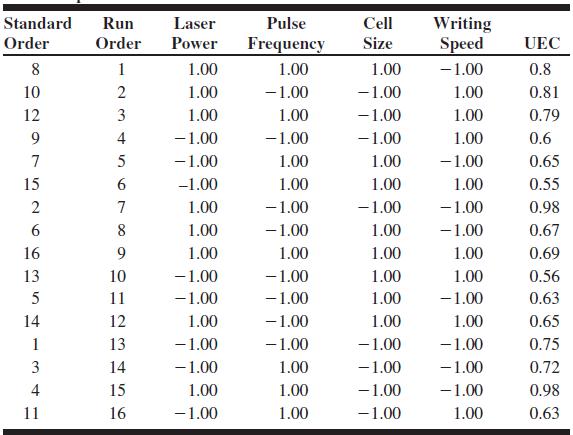
6.22. Semiconductor manufacturing processes have long and complex assembly flows, so matrix marks and automated 2d-matrix readers are used at several process steps throughout factories. Unreadable matrix marks negatively affect factory run rates because manual entry of part data is required before
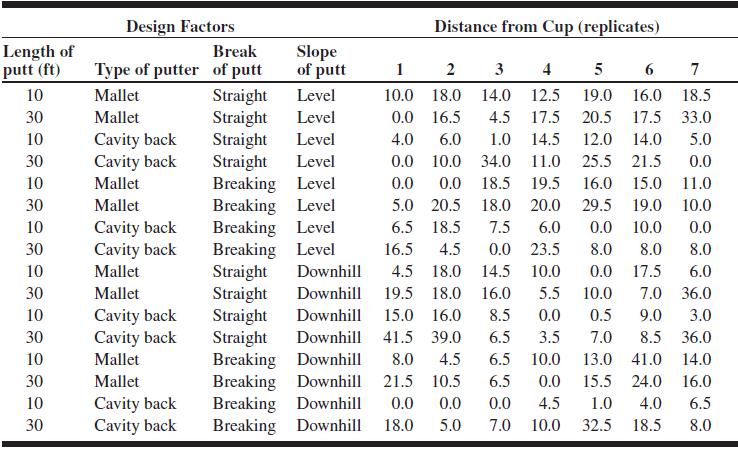
6.21. I am always interested in improving my golf scores.Since a typical golfer uses the putter for about 35–45 percent of his or her strokes, it seems reasonable that improving one’s putting is a logical and perhaps simple way to improve a golf score (“The man who can putt is a match for any
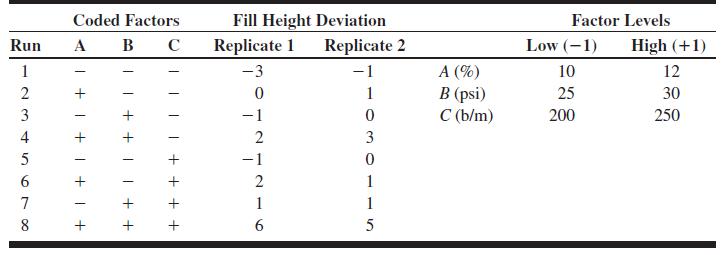
6.20. Consider a variation of the bottle filling experiment from Example 5.3. Suppose that only two levels of carbonation are used so that the experiment is a 23 factorial design with two replicates. The data are shown in Table P6.3.(a) Analyze the data from this experiment. Which factors
6.19. The effect estimates from a 24 factorial experiment are listed here. Are any of the effects significant? ABCD$ !2.5251, BCD $ 4.4054, ACD $ !0.4932, ABD$ !5.0842, ABC $ !5.7696, CD $ 4.6707, BD $!4.6620, BC $!0.7982, AD $!1.6564,AC $ 1.1109, AB$ !10.5229, D $ !6.0275, C $ !8.2045, B $
6.18. The effect estimates from a 24 factorial design are as follows:ABCD $!1.5138, ABC $!1.2661, ABD $!0.9852, ACD $ !0.7566, BCD $ !0.4842, CD $ !0.0795, BD$ !0.0793, AD $ 0.5988, BC $ 0.9216, AC $ 1.1616, AB $ 1.3266, D $ 4.6744, C $ 5.1458, B $ 8.2469, and A $ 12.7151. Are you comfortable with
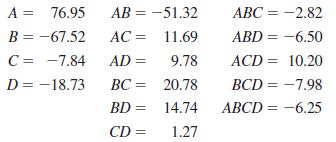
6.17. An experimenter has run a single replicate of a 24 design. The following effect estimates have been calculated:(a) Construct a normal probability plot of these effects.(b) Identify a tentative model, based on the plot of the effects in part (a). A = 76.95 B = -67.52 C = -7.84 AB = -51.32 AC =
6.16. Continuation of Problem 6.15. One of the variables in the experiment described in Problem 6.15, heat treatment method (C), is a categorical variable. Assume that the remaining factors are continuous.(a) Write two regression models for predicting crack length, one for each level of the heat
6.15. A nickel–titanium alloy is used to make components for jet turbine aircraft engines. Cracking is a potentially serious problem in the final part because it can lead to nonrecoverable failure. A test is run at the parts producer to determine the effect of four factors on cracks. The four
6.14. Continuation of Problem 6.13. How would your answer to Problem 6.13 change if arsenic flow rate was more difficult to control in the process than the deposition time?
6.13. Continuation of Problem 6.12. Use the regression model in part (c) of Problem 6.12 to generate a response surface contour plot for epitaxial layer thickness. Suppose it is critically important to obtain layer thickness of 14.5$m. What settings of arsenic flow rate and decomposition time would
6.12. An article in the AT&T Technical Journal (March/April 1986,Vol. 65, pp. 39–50) describes the application of two-level factorial designs to integrated circuit manufacturing. A basic processing step is to grow an epitaxial layer on polished silicon wafers. The wafers mounted on a
6.11. Calculate approximate 95 percent confidence limits for the factor effects in Problem 6.10. Do the results of this analysis agree with the analysis of variance performed in Problem 6.10?
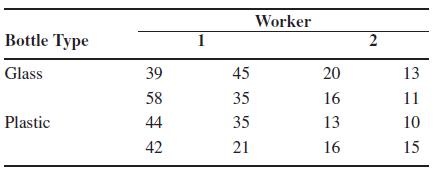
6.10. In Problem 6.9, the engineer was also interested in potential fatigue differences resulting from the two types of bottles.As a measure of the amount of effort required, he measured the elevation of the heart rate (pulse) induced by the task. The results follow. Analyze the data and draw
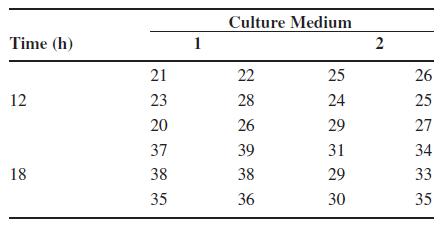
6.8. A bacteriologist is interested in the effects of two different culture media and two different times on the growth of a particular virus. He or she performs six replicates of a 22 design, making the runs in random order. Analyze the bacterial growth data that follow and draw appropriate
6.6. Reconsider the experiment described in Problem 6.1.Suppose that the experimenter only performed the eight trials from replicate I. In addition, he ran four center points and obtained the following response values: 36, 40, 43, 45.(a) Estimate the factor effects. Which effects are large?(b)
6.4. Plot the factor effects from Problem 6.1 on a graph relative to an appropriately scaled t distribution. Does this graphical display adequately identify the important factors?Compare the conclusions from this plot with the results from the analysis of variance.
6.3. Find the standard error of the factor effects and approximate 95 percent confidence limits for the factor effects in Problem 6.1. Do the results of this analysis agree with the conclusions from the analysis of variance?
6.2. Reconsider part (c) of Problem 6.1. Use the regression model to generate response surface and contour plots of the tool life response. Interpret these plots. Do they provide insight regarding the desirable operating conditions for this process?
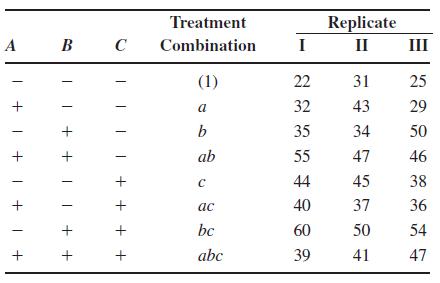
6.1. An engineer is interested in the effects of cutting speed (A), tool geometry (B), and cutting angle (C) on the life(in hours) of a machine tool. Two levels of each factor are chosen, and three replicates of a 23 factorial design are run.The results are as follows:(a) Estimate the factor
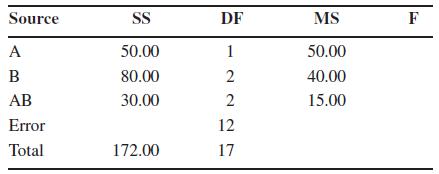
5.46. Consider the following incomplete ANOVA table:In addition to the ANOVA table, you know that the experiment has been replicated three times and that the totals of the three replicates are 10, 12, and 14, respectively. The original experiment was run as a completely randomized design.Answer the
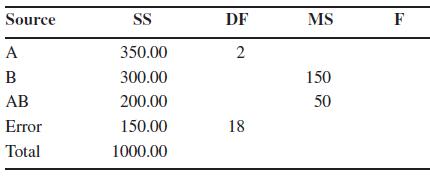
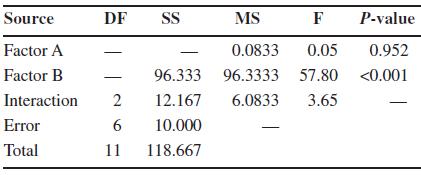
5.45. Consider the following ANOVA for a two-factor factorial experiment:In addition to the ANOVA, you are given the following data totals. Row totals (factor A) $ 18, 10, 14; column totals (factor B) $ 16, 26; cell totals $ 10, 8, 2, 8, 4, 10; and replicate totals $ 19, 23. The grand total is 42.
5.44. Continuation of Problem 5.43. Suppose that Laura did actually conduct the experiment in Problem 5.43 as a randomized complete block design. Assume that the block sum of squares is 60.00. Reconstruct the ANOVA display under this new set of assumptions.
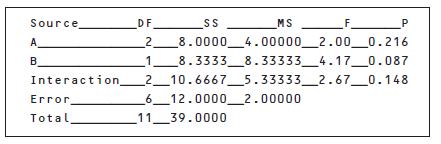
5.43. In Problem 4.53 you met physics PhD student Laura Van Ertia who had conducted a single-factor experiment in her pursuit of the unified theory. She is at it again, and this time she has moved on to a two-factor factorial conducted as a completely randomized deesign. From her experiment, Laura
5.42. Reconsider the lens polishing experiment in Problem 5.41. Suppose that this experiment had been conducted as a randomized complete block design. The sum of squares for blocks is 4.00. Reconstruct the ANOVA given this new information.What impact does the blocking have on the conclusions from
5.41. The C. F. Eye Care company manufactures lenses for transplantation into the eye following cataract surgery. An engineering group has conducted an experiment involving two factors to determine their effect on the lens polishing process. The results of this experiment are summarized in the
5.40. Reconsider the keyboard experiment in Problem 5.30.Suppose that this experiment had been conducted in three blocks, with each replicate a block. Assume that the observations in the data table are given in order, that is, the first observation in each cell comes from the first replicate, and
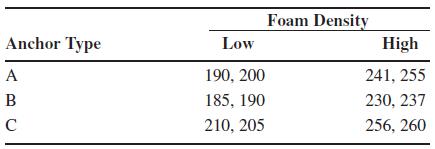
5.39. Reconsider the bone anchor experiment in Problem 5.29. Suppose that this experiment had been conducted in two blocks, with each replicate a block. Assume that the observations in the data table are given in order, that is, the first observation in each cell comes from the first replicate, and
5.38. Reconsider the three-factor factorial experiment in Problem 5.19. Suppose that this experiment had been conducted in three blocks, with each replicate a block.Assume that the observations in the data table are given in order, that is, the first observation in each cell comes from the first
5.37. Reconsider the three-factor factorial experiment in Problem 5.18. Suppose that this experiment had been conducted in two blocks, with each replicate a block. Assume that the observations in the data table are given in order, that is, the first observation in each cell comes from the first
5.36. Reconsider the experiment in Problem 5.8. Suppose that this experiment had been conducted in two blocks, with each replicate a block. Assume that the observations in the data table are given in order, that is, the first observation in each cell comes from the first replicate, and so on.
5.35. Reconsider the experiment in Problem 5.6. Suppose that this experiment had been conducted in three blocks, with each replicate a block. Assume that the observations in the data table are given in order, that is, the first observation in each cell comes from the first replicate, and so on.
5.34. Reconsider the experiment in Problem 5.4. Suppose that this experiment had been conducted in three blocks, with each replicate a block. Assume that the observations in the data table are given in order, that is, the first observation in each cell comes from the first replicate, and so on.
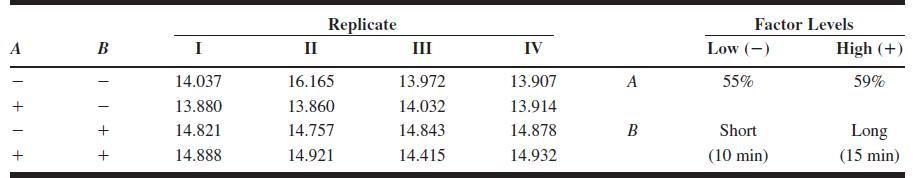
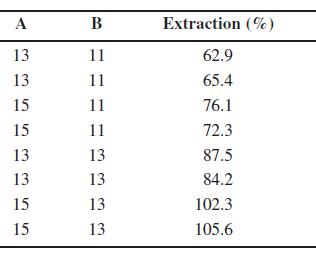
5.33. An article in Biotechnology Progress (2001, Vol. 17, pp. 366–368) described an experiment to investigate nisin extraction in aqueous two-phase solutions. A two-factor factorial experiment was conducted using factors A = concentration of PEG and B = concentration of Na2SO4. Data similar to
5.32. Continuation of Problem 5.31. Suppose that the specifications require that surface area must be between 0.3 and 0.6 cm2/g and that density must be less than 14 g/cm3.Find a set of operating conditions that will result in a product that meets these requirements.
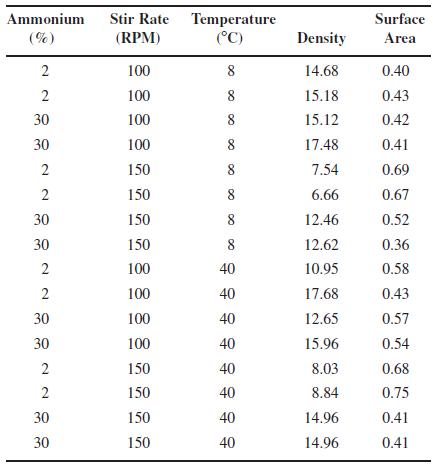
5.31. An article in Quality Progress (May 2011, pp. 42–48)describes the use of factorial experiments to improve a silver powder production process. This product is used in conductive pastes to manufacture a wide variety of products ranging from silicon wafers to elastic membrane switches. Powder
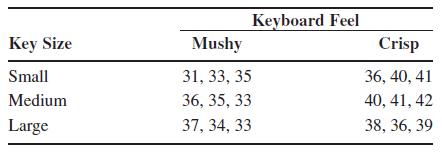
5.30. An experiment was performed to investigate the keyboard feel on a computer (crisp or mushy) and the size of the keys (small, medium, or large). The response variable is typing speed. Three replicates of the experiment were performed.The experimental design and the data are as follow.(a)
5.29. Bone anchors are used by orthopedic surgeons in repairing torn rotator cuffs (a common shoulder tendon injury among baseball players). The bone anchor is a threaded insert that is screwed into a hole that has been drilled into the shoulder bone near the site of the torn tendon. The torn
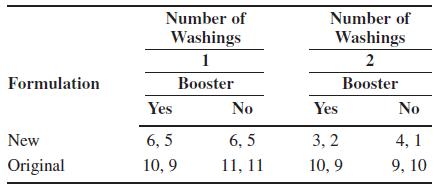
5.28. A manufacturer of laundry products is investigating the performance of a newly formulated stain remover. The new formulation is compared to the original formulation with respect to its ability to remove a standard tomato-like stain in a test article of cotton cloth using a factorial
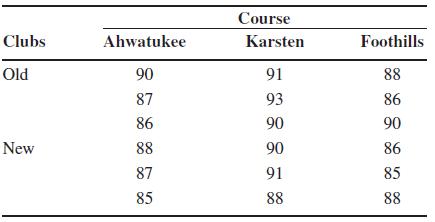
5.27. I have recently purchased new golf clubs, which I believe will significantly improve my game. Below are the scores of three rounds of golf played at three different golf courses with the old and the new clubs.(a) Conduct an analysis of variance. Using ( $ 0.05, what conclusions can you
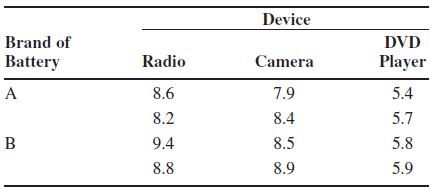
5.26. An experiment was conducted to study the life (in hours) of two different brands of batteries in three different devices (radio, camera, and portable DVD player). A completely randomized two-factor factorial experiment was conducted and the following data resulted.(a) Analyze the data and
5.23. Consider the data in Problem 5.8. Analyze the data, assuming that replicates are blocks.
5.22. Consider the data in Problem 5.7. Analyze the data, assuming that replicates are blocks.
Showing 1700 - 1800
of 2697
First
11
12
13
14
15
16
17
18
19
20
21
22
23
24
25
Last
Step by Step Answers