New Semester
Started
Get
50% OFF
Study Help!
--h --m --s
Claim Now
Question Answers
Textbooks
Find textbooks, questions and answers
Oops, something went wrong!
Change your search query and then try again
S
Books
FREE
Study Help
Expert Questions
Accounting
General Management
Mathematics
Finance
Organizational Behaviour
Law
Physics
Operating System
Management Leadership
Sociology
Programming
Marketing
Database
Computer Network
Economics
Textbooks Solutions
Accounting
Managerial Accounting
Management Leadership
Cost Accounting
Statistics
Business Law
Corporate Finance
Finance
Economics
Auditing
Tutors
Online Tutors
Find a Tutor
Hire a Tutor
Become a Tutor
AI Tutor
AI Study Planner
NEW
Sell Books
Search
Search
Sign In
Register
study help
business
systems analysis and design using matlab
Design And Analysis Of Experiments 8th Edition Douglas C. Montgomery - Solutions
11.6. The region of experimentation for two factors are temperature (100 # T # 300°F) and catalyst feed rate (10 #C # 30 lb/in). A first-order model in the usual )1 coded variables has been fit to a molecular weight response, yielding the following model:(a) Find the path of steepest ascent.(b) It
11.5. The region of experimentation for three factors are time (40 # T1 # 80 min), temperature (200 # T2 # 300°C), and pressure (20 # P # 50 psig). A first-order model in coded variables has been fit to yield data from a 23 design. The model isIs the point T1 $ 85, T2 $ 325, P $ 60 on the path of
11.4. For the first-order modelfind the path of steepest ascent. The variables are coded as !1 # xi # 1. == = 60+ 1.5x - 0.8x2 + 2.0x3
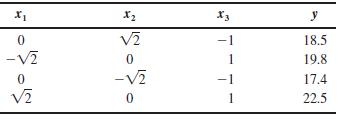
11.3. Verify that the following design is a simplex. Fit the first-order model and find the path of steepest ascent. x1 x2 X3 y 0 2 18.5 -2 0 1 19.8 0 -2 1 17.4 VE 0 1 22.5
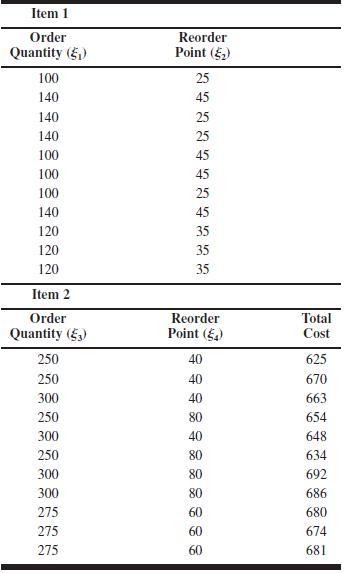
11.2. An industrial engineer has developed a computer simulation model of a two-item inventory system. The decision variables are the order quantity and the reorder point for each item. The response to be minimized is total inventory cost. The simulation model is used to produce the data shown in
10.18. Consider a design. Suppose after running the experiment, the largest observed effects are A % BD, B % AD, and D % AB. You wish to augment the original design with a group of four runs to de-alias these effects.(a) Which four runs would you make?(b) Find the variances and covariances of the
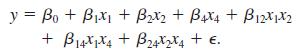
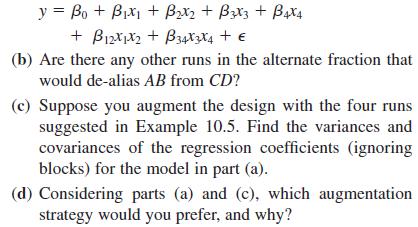
10.17. Consider the design discussed in Example 10.5.(a) Suppose you elect to augment the design with the single run selected in that example. Find the variances and covariances of the regression coefficients in the model(ignoring blocks): y= Bo+Bx + B2x2 + B3x3 + 4x4 + B12x1x2+3x3x4 + (b) Are
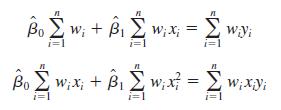
10.16. Weighted least squares. Suppose that we are fitting the straight line y $ "0 % "1x % ', but the variance of the y’s now depends on the level of x; that is,where the wi are known constants, often called weights. Show that if we choose estimates of the regression coefficients to minimize the
10.15. Suppose that we are fitting a straight line and we desire to make the variance of as small as possible.Restricting ourselves to an even number of experimental points, where should we place these points so as to minimize V( )? [Note: Use the design called for in this exercise with great
10.14. Relationship between analysis of variance and regression. Any analysis of variance model can be expressed in terms of the general linear model y $ x& % (, where the X matrix consists of 0s and 1s. Show that the single-factor model yij $ $ % .i % 'ij , i $ 1, 2, 3, j $ 1, 2, 3, 4 can be
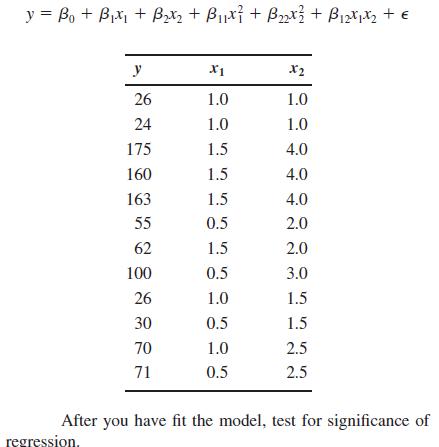
(a) Consider the quadratic regression model from Problem 10.12. Compute t statistics for each model parameter and comment on the conclusions that follow from these quantities.(b) Use the extra sum of squares method to evaluate the value of the quadratic terms , and x1x2 to the model.
10.12. Given the following data, fit the second-order polynomial regression model y = B + Bx + x + B x + B2x + x + y x1 x2 26 1.0 1.0 24 1.0 1.0 175 1.5 4.0 160 1.5 4.0 163 1.5 4.0 55 0.5 2.0 62 1.5 2.0 100 0.5 3.0 26 1.0 1.5 30 0.5 1.5 70 1.0 2.5 71 0.5 2.5 After you have fit the model, test for
10.11. Consider the 24 factorial experiment in Example 6.2.Suppose that the last two observations are missing. Reanalyze the data and draw conclusions. How do these conclusions compare with those from the original example?
10.10. Consider the 24 factorial experiment in Example 6.2.Suppose that the last observation is missing. Reanalyze the data and draw conclusions. How do these conclusions compare with those from the original example?
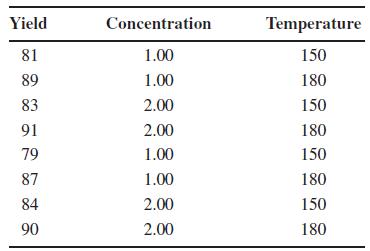
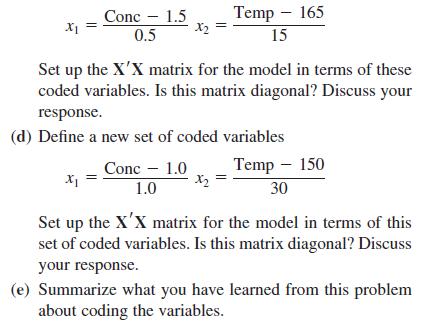
10.9. The yield of a chemical process is related to the concentration of the reactant and the operating temperature. An experiment has been conducted with the following results.(a) Suppose we wish to fit a main effects model to this data. Set up the X6X matrix using the data exactly as it appears
10.8. Analyze the residuals from the regression model in Problem 10.7. Comment on model adequacy.
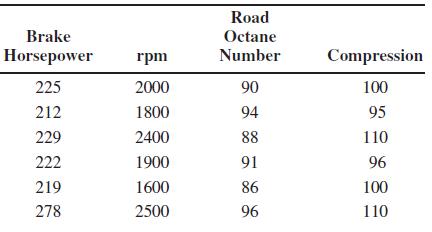
10.7. The brake horsepower developed by an automobile engine on a dynamometer is thought to be a function of the engine speed in revolutions per minute (rpm), the road octane number of the fuel, and the engine compression. An experiment is run in the laboratory and the data that follow are
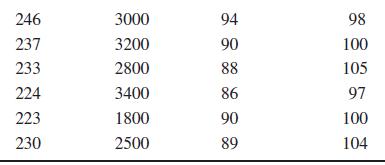
10.6. A study was performed on wear of a bearing y and its relationship to x1 $ oil viscosity and x2 $ load. The following data were obtained:(a) Fit a multiple linear regression model to the data.(b) Test for significance of regression.(c) Compute t statistics for each model parameter. What
10.5. Using the results of Problem 10.1, test the regression model for lack of fit.
10.4. Plot the residuals from Problem 10.2 and comment on model adequacy.
10.3. Plot the residuals from Problem 10.1 and comment on model adequacy.
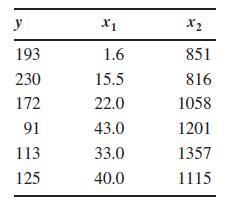
10.2. A plant distills liquid air to produce oxygen, nitrogen, and argon. The percentage of impurity in the oxygen is thought to be linearly related to the amount of impurities in the air as measured by the “pollution count” in parts per million(ppm). A sample of plant operating data is shown
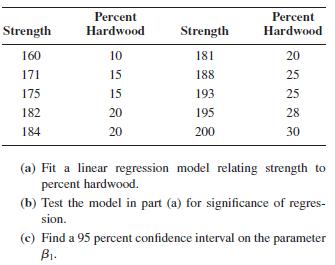
10.1. The tensile strength of a paper product is related to the amount of hardwood in the pulp. Ten samples are produced in the pilot plant, and the data obtained are shown in the following table. Strength Percent Hardwood Strength Percent Hardwood 160 10 181 20 171 15 188 25 175 15 193 25 182 20
9.34. Suppose that you must design an experiment with six categorical factors. Factor A has six levels, factor B has five levels, factor C has five levels, factor D has three levels, and factors E and F have two levels. You are interested in main effects and two-factor interactions.(a) How many
9.33. Suppose that you must design an experiment to investigate six continuous factors. It is thought that running all factors at two levels is adequate but that only the AB, AC, and AD two-factor interactions are of interest.(a) How many runs are required to estimate all of the effects that are of
9.32. Suppose that you must design an experiment to investigate seven continuous factors. Running all factors at two levels is thought to be appropriate but that only the twofactor interactions involving factor A are of interest.(a) How many runs are required to estimate all of the relevant
9.31. Suppose that you must design an experiment to investigate nine continuous factors. It is thought that running all factors at two levels is adequate but that all two-factor interactions are of interest.(a) How many runs are required to estimate all main effects and two-factor interactions?(b)
9.30. Construct a minimum-run D-optimal resolution IV design for 12 factors. Find the alias relationships. What approach would you recommend for analyzing the data from this experiment?
9.29. Construct a minimum-run D-optimal resolution IV design for 10 factors. Find the alias relationships. What approach would you recommend for analyzing the data from this experiment?
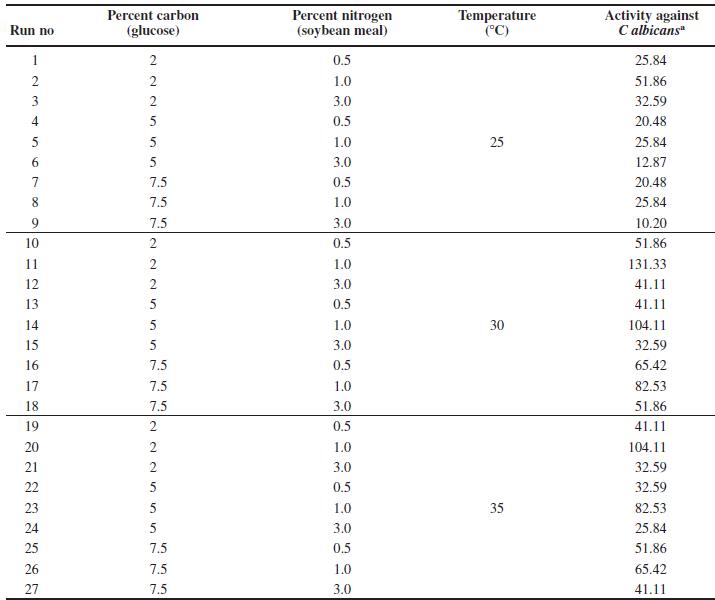
9.28. An article in the Journal of Chemical Technology and Biotechnology (“A Study of Antifungal Antibiotic Production by Thermomonospora sp MTCC 3340 Using Full Factorial Design,” 2003, Vol. 78, pp. 605–610) investigated three independent variables—concentration of carbon source
9.27. Reconsider the experiment in Problem 9.25. Suppose that you are only interested in main effects. Construct a design with N $ 12 runs for this experiment.
9.26. Reconsider the experiment in Problem 9.25.Construct a design with N $ 48 runs and compare it to the design you constructed in Problem 9.25.
9.25. Suppose there are four three-level categorical factor and a single two-level continuous factor. What is the minimum number of runs required to estimate all main effects and twofactor interactions? Construct this design.
9.24. Reconsider the experiment in Problem 9.23. Suppose that it was necessary to estimate all main effects and two-factor interactions, but the full factorial with 24 runs (not counting replication)was too expensive. Recommend an alternative design.
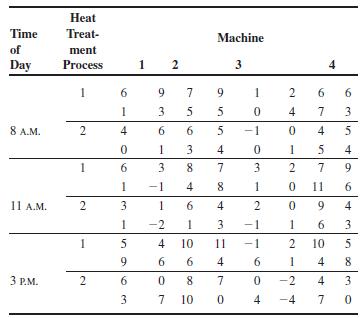
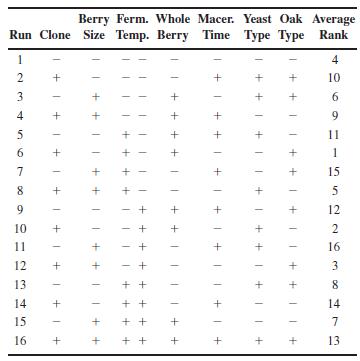
9.23. An article by W. D. Baten in the 1956 volume of Industrial Quality Control described an experiment to study the effect of three factors on the lengths of steel bars. Each bar was subjected to one of two heat treatment processes and was cut on one of four machines at one of three times during
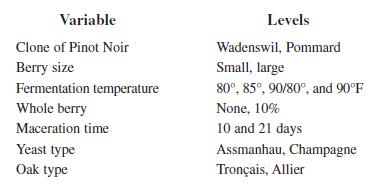
9.22. In Problem 8.30, you met Harry Peterson-Nedry, a friend of the author who has a winery and vineyard in Newberg, Oregon. That problem described the application of two-level fractional factorial designs to their 1985 Pinot Noir product. In 1987, he wanted to conduct another Pinot Noir
9.21. Starting with a 16-run 24 design, show how one three-level factor and three two-level factors can be accommodated and still allow the estimation of two-factor interactions.
9.19. Outline the analysis of variance table for a 2232 factorial design. Discuss how this design may be confounded in blocks.
9.18. Construct a 4 & 23 design confounded in two blocks of 16 observations each. Outline the analysis of variance for this design.
9.17. Construct a 39!6 design and verify that it is a resolution III design.
9.16. Construct a 35!2 design with I $ ABC and I $ CDE.Write out the alias structure for this design. What is the resolution of this design?
9.15. Verify that the design in Problem 9.14 is a resolution IV design.
9.14. Construct a design with I $ ABCD. Write out the alias structure for this design.
9.13. From examining Figure 9.9, what type of design would remain if after completing the first nine runs, one of the three factors could be dropped?
9.12. Consider the data from replicate I of Problem 9.3.Suppose that only a one-third fraction of this design with I $ABC is run. Construct the design, determine the alias structure, and analyze the data.
9.11. Consider the data in Problem 9.3. If ABC is confounded in replicate I and ABC2 is confounded in replicate II, perform the analysis of variance.
9.10. Outline the analysis of variance table for the 34 design in nine blocks. Is this a practical design?
9.9. Consider the data from the first replicate of Problem 9.3. Assuming that not all 27 observations could be run on the same day, set up a design for conducting the experiment over three days with AB2C confounded with blocks. Analyze the data.
9.8. Confound a 34 design in three blocks using the AB2CD component of the four-factor interaction.
9.7.(a) Confound a 33 design in three blocks using the ABC2 component of the three-factor interaction. Compare your results with the design in Figure 9.7.(b) Confound a 33 design in three blocks using the AB2C component of the three-factor interaction. Compare your results with the design in Figure
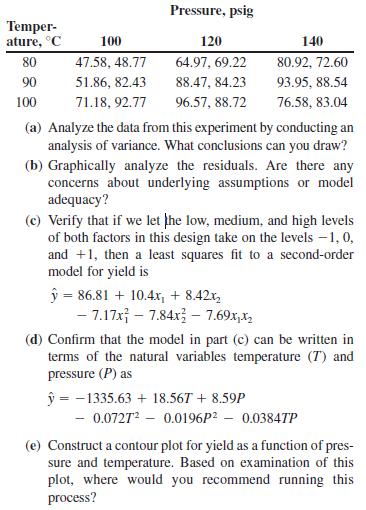
9.6. An experiment is run in a chemical process using a 32 factorial design. The design factors are temperature and pressure, and the response variable is yield. The data that result from this experiment are as follows. Temper- ature, C 100 Pressure, psig 120 140 80 47.58, 48.77 64.97, 69.22 80.92,
9.5. Compute the I and J components of the two-factor interactions for Problem 9.4.
9.2. Compute the I and J components of the two-factor interaction in Problem 9.1.
9.1. The effects of developer strength (A) and development time (B) on the density of photographic plate film are being studied. Three strengths and three times are used, and four replicates of a 32 factorial experiment are run. The data from this experiment follow. Analyze the data using the
8.65. Construct a supersaturated design for h $ 12 factors in N $ 10 runs.8.66. How could an “optimal design” approach be used to augment a fractional factorial design to de-alias effects of potential interest?
8.64. Consider the 28!3 design in Problem 8.37. Suppose that the alias chain involving the AB interaction was large.Recommend a partial fold-one design to resolve the ambiguity about this interaction.
8.63. Construct a supersaturated design for k $ 8 factors in P $ 6 runs.
8.62. Reconsider the 24!1 design in Example 8.1. The significant factors are A, C, D, AC % BD, and AD % BC. Find a partial fold-over design that will allow the AC, BD, AD, and BC interactions to be estimated.
8.61. Consider a partial fold over for the design.Suppose that the partial fold over of this design is constructed using column A ( % signs only). Determine the alias relationships in the combined design.
8.60. Consider a partial fold over for the design.Suppose that the partial fold over of this design is constructed using column A ( % signs only). Determine the alias relationships in the combined design.27!4 III 26!2 IV 27!3 IV
8.59. Consider a partial fold over for the design. Suppose that the signs are reversed in column A, but the eight runs that are retained are the runs that have positive signs in column C.Determine the alias relationships in the combined design.
8.58. Consider the design.(a) Suppose that a partial fold over of this design is run using column A (% signs only). Determine the alias relationships in the combined design.(b) Rework part (a) using the negative signs to define the partial fold over. Does it make any difference which signs are used
8.57. Reconsider the design in Problem 8.56.(a) Suppose that a fold over of this design is run by changing the signs in column B. Determine the alias relationships in the combined design.(b) Compare the aliases from this combined design to those from the combined design from Problem 8.35.What
8.56. Consider the design. Suppose that a fold over of this design is run by changing the signs in column A.Determine the alias relationships in the combined design.
8.55. Consider the design.(a) Suppose that the design had been folded over by changing the signs in column B instead of column A.What changes would have resulted in the effects that can be estimated from the combined design?(b) Suppose that the design had been folded over by changing the signs in
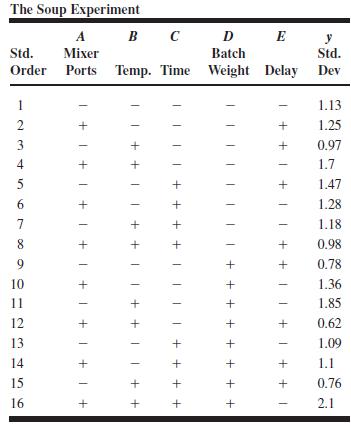
8.54. An article by L. B. Hare (“In the Soup: A Case Study to Identify Contributors to Filling Variability,” Journal of Quality Technology, Vol. 20, pp. 36–43) describes a factorial experiment used to study the filling variability of dry soup mix packages. The factors are A $ number of mixing
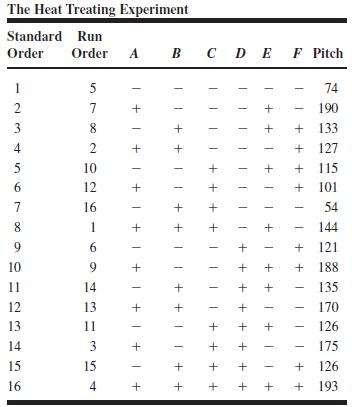
8.53. Heat treating is often used to carbonize metal parts, such as gears. The thickness of the carbonized layer is a critical output variable from this process, and it is usually measured by performing a carbon analysis on the gear pitch (the top of the gear tooth). Six factors were studied in a
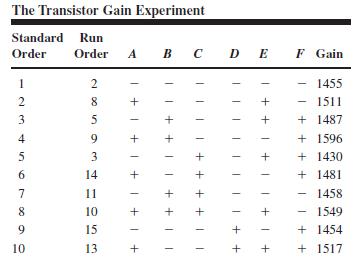
8.52. An experiment is run in a semiconductor factory to investigate the effect of six factors on transistor gain. The design selected is the shown in Table P8.15.(a) Use a normal plot of the effects to identify the significant factors.(b) Conduct appropriate statistical tests for the model
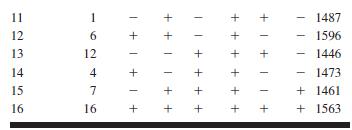
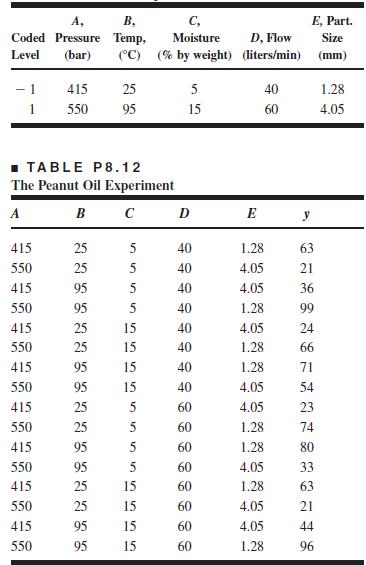
8.49. In an article in Quality Engineering (“An Application of Fractional Factorial Experimental Designs,” 1988, Vol. 1, pp.19–23), M. B. Kilgo describes an experiment to determine the effect of CO2 pressure (A), CO2 temperature (B), peanut moisture(C), CO2 flow rate (D), and peanut particle
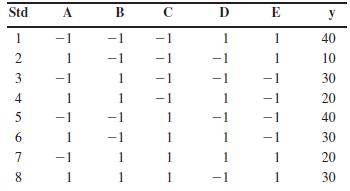
8.48. Consider the following design:(a) What is the generator for column D?(b) What is the generator for column E?(c) If this design were folded over, what is the resolution of the combined design? Std A B C E y 1 1 1 1 40 234567 1 1 10 1 30 1 1 20 -1 1 40 1 1 1 30 -1 1 1 1 1 20 1 1 1 1 1 30
8.47. Consider the following design:(a) What is the generator for column D?(b) What is the generator for column E?(c) If this design were run in two blocks with the AB interaction confounded with blocks, the run d would be in the block where the sign on AB is ______. Answer either ! or %. Run A B C
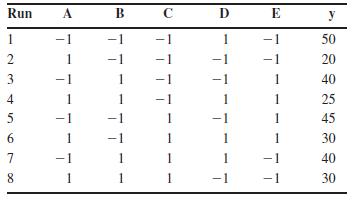
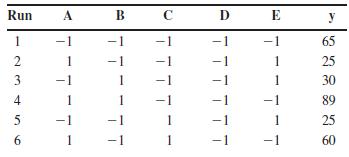
8.46. Consider the following design:(a) What is the generator for column E?(b) If ABE is confounded with blocks, run 16 goes in the ______ block. Answer either ! or %.(c) The resolution of this design is ______.(d) Find the estimates of the main effects and their aliases. Run A B C DE y 1 T -1 65
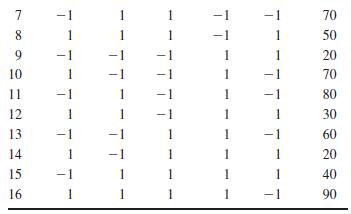
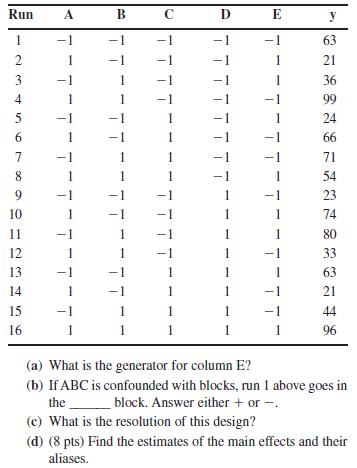
8.45. Consider the following design: Run A B C D E y 11 -2345678901 T 63 1 1 21 1 36 -1 99 24 1 1 66 1 1 71 1 54 1 23 1 74 1 80 12 1 1 1 33 13 1 1 63 14 1 1 -1 21 15 1 1 44 16 1 1 1 1 1 96 (a) What is the generator for column E? (b) If ABC is confounded with blocks, run 1 above goes in the _ block.
8.44. A 26!2 factorial experiment with three replicates has been run in a pharmaceutical drug manufacturing process.The experimenter has used the following factors:(a) If two main effects and one two-factor interaction are included in the final model, how many degrees of freedom for error will be
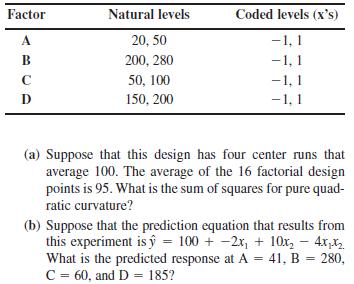
8.43. An unreplicated 24!1 fractional factorial experiment has been run. The experimenter has used the following factors: Factor Natural levels Coded levels (x's) A 20,50 -1,1 B 200, 280 -1,1 C 50, 100 -1,1 D 150, 200 -1, 1 (a) Suppose that this design has four center runs that average 100. The
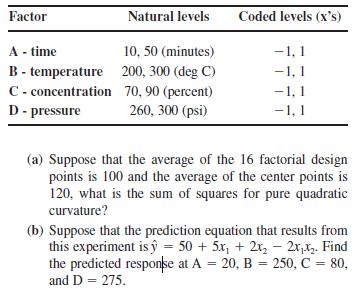
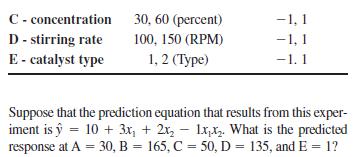
8.42. An unreplicated 24!1 fractional factorial experiment with four center points has been run. The experimenter has used the following factors: Factor Natural levels Coded levels (x's) A - time 10, 50 (minutes) -1,1 B-temperature 200, 300 (deg C) C-concentration 70,90 (percent) -1,1 -1, 1
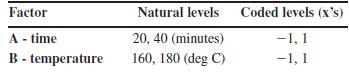
8.41. An unreplicated 25!1 fractional factorial experiment with four center points has been run in a chemical process.The response variable is molecular weight. The experimenter has used the following factors: Factor A - time Natural levels Coded levels (x's) 20, 40 (minutes) -1, 1 B-temperature
8.40. Consider the following experiment:Answer the following questions about this experiment:(a) How many factors did this experiment investigate?(b) What is the resolution of this design?(c) Calculate the estimates of the main effects.(d) What is the complete defining relation for this design? Run
8.39. Consider the following experiment:Answer the following questions about this experiment:(a) How many factors did this experiment investigate?(b) How many factors are in the basic design?(c) Assume that the factors in the experiment are represented by the initial letters of the alphabet (i.e.,
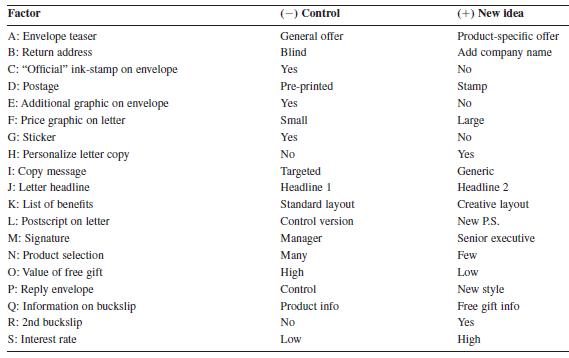
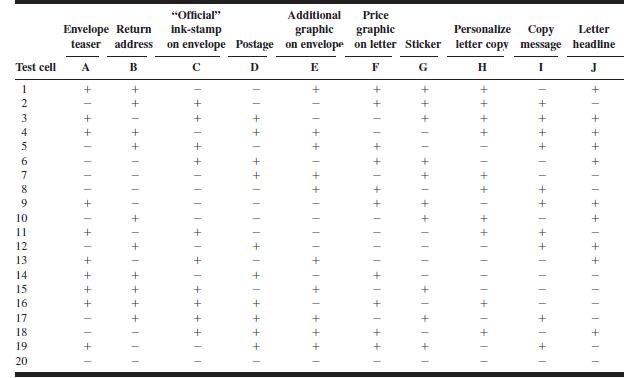
8.38. An article in the International Journal of Research in Marketing (“Experimental design on the front lines of marketing:Testing new ideas to increase direct mail sales,” 2006, Vol. 23, pp. 309–319) describes the use of a 20-run Plackett–Burman design to investigate the effects of 19
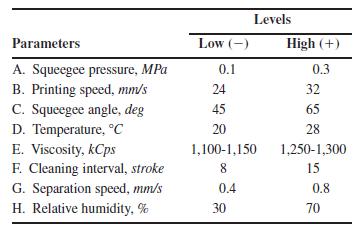
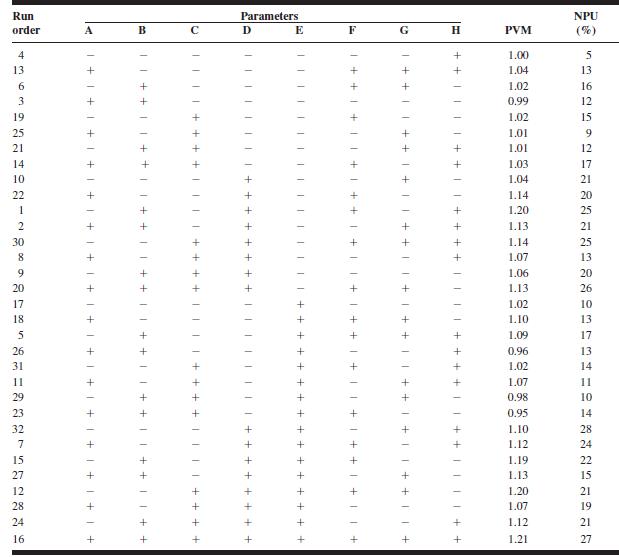
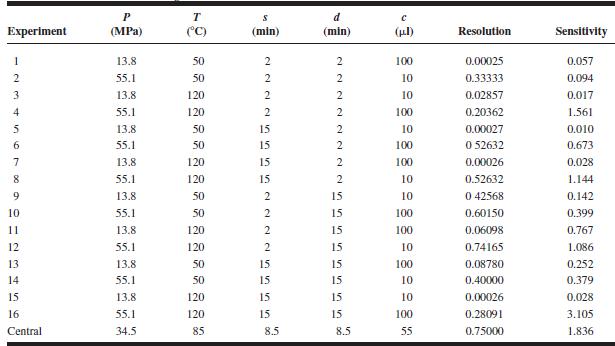
8.37. An article in Soldering & Surface Mount Technology (“Characterization of a Solder Paste Printing Process and Its Optimization,” 1999, Vol. 11, No. 3, pp. 23–26) describes the use of a 28!3 fractional factorial experiment to study the effect of eight factors on two responses;
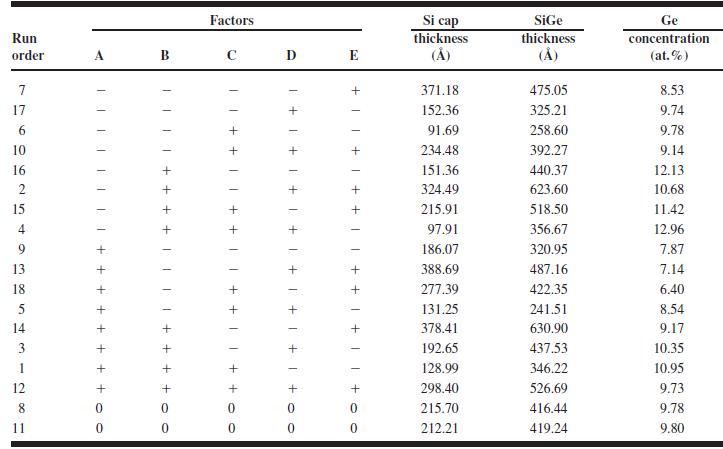
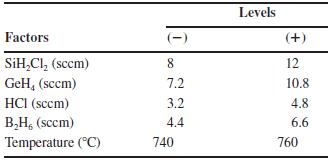
8.36. An article in Thin Solid Films (504, “A Study of Si/SiGe Selective Epitaxial Growth by Experimental Design Approach,” 2006, Vol. 504, pp. 95–100) describes the use of a fractional factorial design to investigate the sensitivity of low-temperature (740–760 'C) Si/SiGe selective
8.35. An article in the Journal of Chromatography A(“Simultaneous Supercritical Fluid Derivatization and Extraction of Formaldehyde by the Hantzsch Reaction,” 2000, Vol. 896, pp. 51–59) describes an experiment where the Hantzsch reaction is used to produce the chemical derivatization of
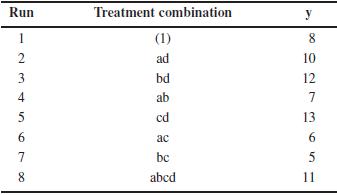
8.34. Consider the 24 factorial experiment in Problem 6.42.Suppose that the experimenters could only afford eight runs.Set up the 24!1 fractional factorial design with I $ ABCD and select the responses for the runs from the full factorial data in Example 6.42.(a) Analyze the data for all of the
8.33. Consider the 24 factorial experiment for surfactin production in Problem 6.40. Suppose that the experimenters could only afford eight runs. Set up the 24!1 fractional factorial design with I $ ABCD and select the responses for the runs from the full factorial data in Example 6.40.(a) Analyze
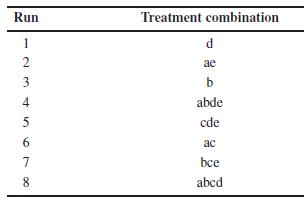
8.32. Consider the 25 factorial in Problem 6.39. Suppose that the experimenters could only afford 16 runs. Set up the 25!1 fractional factorial design with I $ ABCDE and select the responses for the runs from the full factorial data in Example 6.39.(a) Analyze the data and draw conclusions.(b)
8.31. Consider the isatin yield data from the experiment described in Problem 6.38. The original experiment was a 24 full factorial. Suppose that the original experimenters could only afford eight runs. Set up the 24!1 fractional factorial design with I $ ABCD and select the responses for the runs
8.30. Harry Peterson-Nedry (a friend of the author) owns a vineyard and winery in Newberg, Oregon. He grows several varieties of grapes and produces wine. Harry has used factorial designs for process and product development in the winemaking segment of the business. This problem describes the
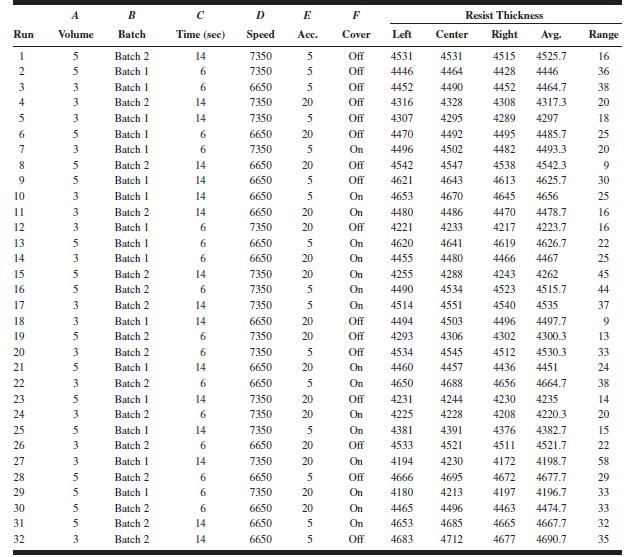
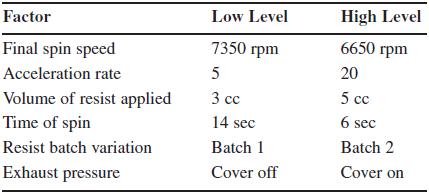
8.29. A spin coater is used to apply photoresist to a bare silicon wafer. This operation usually occurs early in the semiconductor manufacturing process, and the average coating thickness and the variability in the coating thickness have an important impact on downstream manufacturing steps. Six
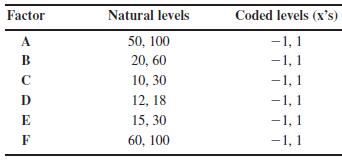
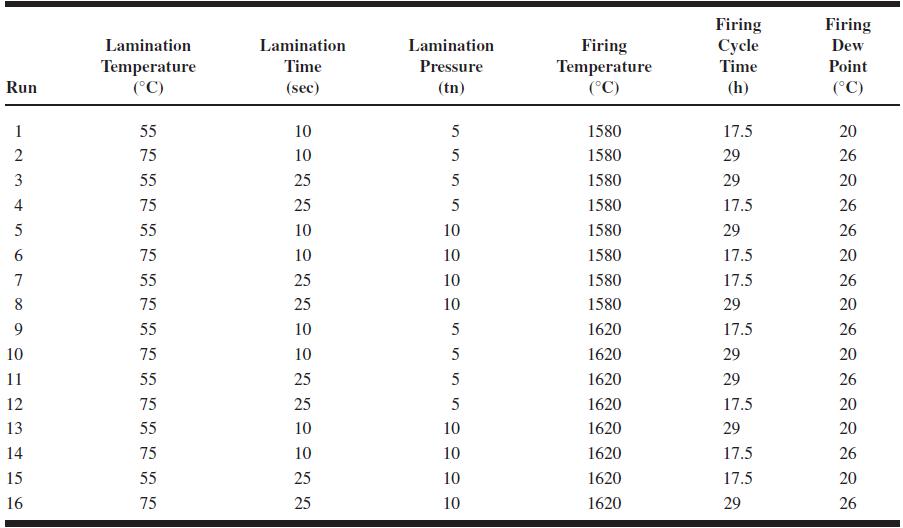
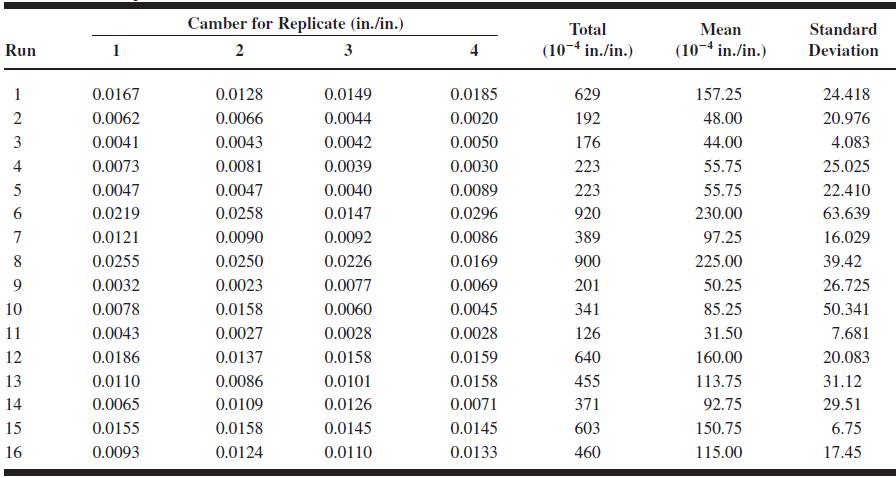
8.28. A 16-run experiment was performed in a semiconductor manufacturing plant to study the effects of six factors on the curvature or camber of the substrate devices produced.The six variables and their levels are shown in Table P8.2.Each run was replicated four times, and a camber measurement was
8.26. Nonregular fractions of the 2k [John (1971)].Consider a 24 design. We must estimate the four main effects and the six two-factor interactions, but the full 24 factorial cannot be run. The largest possible block size contains 12 runs. These 12 runs can be obtained from the four one-quarter
8.25. Construct a 27!2 design. Show how the design may be run in four blocks of eight observations each. Are any main effects or two-factor interactions confounded with blocks?
8.24. Construct a 25!1 design. Show how the design may be run in two blocks of eight observations each. Are any main effects or two-factor interactions confounded with blocks?
8.22. Fold over a design to produce a six-factor design.Verify that the resulting design is a design. Compare this design to the design in Table 8.10.
8.21. Fold over the design in Table 8.19 to produce an eight-factor design. Verify that the resulting design is a design. Is this a minimal design?
8.20. Consider the design in Problem 8.18. Determine the effects that may be estimated if a single factor fold over of this design is run with the signs for factor A reversed.
8.19. Construct a design. Determine the effects that may be estimated if a full fold over of this design is performed.
8.18. Construct a design. Determine the effects that may be estimated if a full fold over of this design is performed.
8.17. Project the design in Example 8.1 into two replicates of a 22 design in the factors A and B. Analyze the data and draw conclusions.
8.16. Repeat Problem 8.15 using I$ !ABCD. Does the use of the alternate fraction change your interpretation of the data?
Showing 1600 - 1700
of 2697
First
10
11
12
13
14
15
16
17
18
19
20
21
22
23
24
Last
Step by Step Answers