

The relative tracer concentrations obtained from pulse tracer tests on a commercial packed-bed desulfurization reactor are shown
Question:
The relative tracer concentrations obtained from pulse tracer tests on a commercial packed-bed desulfurization reactor are shown in Figure P17-18B. After studying the RTD, what problems are occurring with the reactor during the period of poor operation (thin line)? The bed was repacked and the pulse tracer test again carried out with the results shown in Figure P17-18B (thick line). Calculate the conversion that could be achieved in the commercial desulfurization reactor during poor operation and during good operation (Figure P17-18B) for the following reactions:
a. A first-order isomerization with a specific reaction rate of 0.1 h–1
b. A first-order isomerization with a specific reaction rate of 2.0 h–1
c. What do you conclude upon comparing the four conversions in parts (a) and (b)?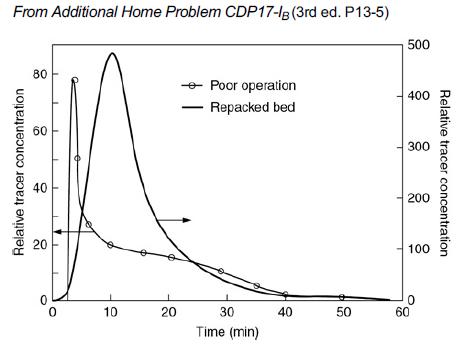
The relative tracer concentrations for poor operation and repacked bed are shown. The vertical axis on the left represents the relative tracer concentration for poor operation ranging from 0 to 80, in increments of 20. The vertical axis on the right represents the relative tracer concentration for repacked bed ranging from 0 to 500, in increments of 100. The curve for repacked bed starts from the origin, increases to a maximum value (85), and decreases to 0 at 57 minutes. The curve for poor operation starts at (2,0), increases to a maximum value of (78), and decreases gradually to a minimum value. Note: All values taken are approximate.
Step by Step Answer:
a b The tracer experiment for the poor operation indicate ...View the full answer


