

Question: The graph in Figure P22.66 shows the current through a (1.0 Omega) resistor as a function of time. a. How much charge flowed (I(mathrm{~A})) through
The graph in Figure P22.66 shows the current through a \(1.0 \Omega\) resistor as a function of time.
a. How much charge flowed \(I(\mathrm{~A})\)
through the resistor during the \(10 \mathrm{~s}\) interval shown?
b. What was the total energy dissipated by the resistor during this time?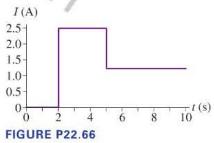
I(A) 2.5- 2.0- 1.5- 1.0- 0.5- 0- t(s) 0 2 4 8 10 FIGURE P22.66
Step by Step Solution
★★★★★
3.42 Rating (155 Votes )
There are 3 Steps involved in it
1 Expert Approved Answer
Step: 1 Unlock

a To find the total charge that flowed through the resistor during the given interval we need to cal... View full answer
Question Has Been Solved by an Expert!
Get step-by-step solutions from verified subject matter experts
Step: 2 Unlock
Step: 3 Unlock