New Semester
Started
Get
50% OFF
Study Help!
--h --m --s
Claim Now
Question Answers
Textbooks
Find textbooks, questions and answers
Oops, something went wrong!
Change your search query and then try again
S
Books
FREE
Study Help
Expert Questions
Accounting
General Management
Mathematics
Finance
Organizational Behaviour
Law
Physics
Operating System
Management Leadership
Sociology
Programming
Marketing
Database
Computer Network
Economics
Textbooks Solutions
Accounting
Managerial Accounting
Management Leadership
Cost Accounting
Statistics
Business Law
Corporate Finance
Finance
Economics
Auditing
Tutors
Online Tutors
Find a Tutor
Hire a Tutor
Become a Tutor
AI Tutor
AI Study Planner
NEW
Sell Books
Search
Search
Sign In
Register
study help
business
bayesian statistics an introduction
Statistics For Business And Economics 14th Edition David R. Anderson, Dennis J. Sweeney, Thomas A. Williams, Jeffrey D. Camm, James J. Cochran, Michael J. Fry, Jeffrey W. Ohlmann - Solutions
42. Cost of Backyard Structure. Many families in California are using backyard structures for home offices, art studios, and hobby areas as well as for additional storage. Suppose that the mean price for a customized wooden, shingled backyard structure is $3100. Assume that the standard deviation
41. GMAT Exam Scores. The Graduate Management Admission Test (GMAT) is a standardized exam used by many universities as part of the assessment for admission to graduate study in business. The average GMAT score is 547 (Magoosh website).Assume that GMAT scores are bell-shaped with a standard
40. Price per Liter of Gasoline. Suppose that the mean retail price per liter of regular grade gasoline in the United States is $0.91 with a standard deviation of $.03 and that the retail price per liter has a bell-shaped distribution.a. What percentage of regular grade gasoline sold between $0.88
39. Amount of Sleep per Night. The results of a national survey showed that on average, adults sleep 6.9 hours per night. Suppose that the standard deviation is 1.2 hours.a. Use Chebyshev’s theorem to calculate the percentage of individuals who sleep between 4.5 and 9.3 hours.b. Use Chebyshev’s
38. Suppose the data have a bell-shaped distribution with a mean of 30 and a standard deviation of 5. Use the empirical rule to determine the percentage of data within each of the following ranges:a. 20 to 40b. 15 to 45c. 25 to 35
37. Consider a sample with a mean of 30 and a standard deviation of 5. Use Chebyshev’s theorem to determine the percentage of the data within each of the following ranges:a. 20 to 40b. 15 to 45c. 22 to 38d. 18 to 42e. 12 to 48
36. Consider a sample with a mean of 500 and a standard deviation of 100. What are the z-scores for the following data values: 520, 650, 500, 450, and 280?
35. Consider a sample with data values of 10, 20, 12, 17, and 16. Compute the z-score for each of the five observations.
34. Consistency of Running Times. The following times were recorded by the quarter-mile and mile runners of a university track team (times are in minutes).Quarter-Mile Times: .92 .98 1.04 .90 .99 Mile Times: 4.52 4.35 4.60 4.70 4.50 After viewing this sample of running times, one of the coaches
33. Amateur Golfer Scores. Scores turned in by an amateur golfer at the Bonita Fairways Golf Course in Bonita Springs, Florida, during 2017 and 2018 are as follows:2017 Season: 74 78 79 77 75 73 75 77 2018 Season: 71 70 75 77 85 80 71 79a. Use the mean and standard deviation to evaluate the
32. Advertising Spend by Companies. Advertising Age annually compiles a list of the 100 companies that spend the most on advertising. Consumer-goods company Procter& Gamble has often topped the list, spending billions of dollars annually. Consider the data found in the file Advertising. It contains
31. Cellular Phone Spending. According to the 2016 Consumer Expenditure Survey, Americans spend an average of $1124 on cellular phone service annually (U.S. Bureau of Labor Statistics website). Suppose that we wish to determine if there are differences in cellular phone expenditures by age group.
30. Reliability of Delivery Service. The following data were used to construct the histograms of the number of days required to fill orders for Dawson Supply, Inc., and J.C. Clark Distributors (see Figure 3.2).Dawson Supply Days for Delivery: 11 10 9 10 11 11 10 11 10 10 Clark Distributors Days for
29. Air Quality Index. The Los Angeles Times regularly reports the air quality index for various areas of Southern California. A sample of air quality index values for Pomona provided the following data: 28, 42, 58, 48, 45, 55, 60, 49, and 50.a. Compute the range and interquartile range.b. Compute
28. Annual Sales Amounts. Varatta Enterprises sells industrial plumbing valves. The following table lists the annual sales amounts for the different salespeople in the organization for the most recent fiscal year.Salesperson Sales Amount ($1000) Salesperson Sales Amount ($1000)Joseph Jennifer
27. Round-Trip Flight Prices. The following table displays round-trip flight prices from 14 major U.S. cities to Atlanta and Salt Lake City.Round-Trip Cost ($)Departure City Atlanta Salt Lake City Cincinnati New York Chicago Denver Los Angeles Seattle Detroit Philadelphia Washington, D.C.Miami San
26. Price of Unleaded Gasoline. Data collected by the Oil Price Information Service from more than 90,000 gasoline and convenience stores throughout the U.S. showed that the average price for a liter of unleaded gasoline was $0.87 (MSN Auto website).The following data show the price per liter ($)
25. Consider a sample with data values of 27, 25, 20, 15, 30, 34, 28, and 25. Compute the range, interquartile range, variance, and standard deviation.
24. Consider a sample with data values of 10, 20, 12, 17, and 16. Compute the variance and standard deviation.
23. Consider a sample with data values of 10, 20, 12, 17, and 16. Compute the range and interquartile range.
22. Company Value Growth Rate. The current value of a company is $25 million. If the value of the company six year ago was $10 million, what is the company’s mean annual growth rate over the past six years?
21. Asset Growth Rate. If an asset declines in value from $5000 to $3500 over nine years, what is the mean annual growth rate in the asset’s value over these nine years?
20. Mutual Fund Comparison. Suppose that at the beginning of Year 1 you invested$10,000 in the Stivers mutual fund and $5000 in the Trippi mutual fund. The value of each investment at the end of each subsequent year is provided in the table below.Which mutual fund performed better?Year Stivers
19. Revenue Growth Rate. Annual revenue for Corning Supplies grew by 5.5% in 2014, 1.1% in 2015, −3.5% in 2016, −1.1% in 2017, and 1.8% in 2018. What is the mean growth annual rate over this period?
18. Business School Ranking. Based on a survey of master’s programs in business administration, magazines such as U.S. News & World Report rank U.S. business schools. These types of rankings are based in part on surveys of business school deans and corporate recruiters. Each survey respondent is
17. Mutual Fund Rate of Return. The following table shows the total return and the number of funds for four categories of mutual funds.Type of Fund Number of Funds Total Return (%)Domestic Equity 9191 4.65 International Equity 2621 18.15 Specialty Stock 1419 11.36 Hybrid 2900 6.75a. Using the
16. Calculating Grade Point Averages. The grade point average for college students is based on a weighted mean computation. For most colleges, the grades are given the following data values: A (4), B (3), C (2), D (1), and F (0). After 60 credit hours of course work, a student at State University
15. Motor Oil Prices. Martinez Auto Supplies has retail stores located in eight cities in California. The price they charge for a particular product in each city varies because of differing competitive conditions. For instance, the price they charge for a case of a popular brand of motor oil in
14. Unemployment Rates by State. The U.S. Bureau of Labor Statistics collects data on unemployment rates in each state. The data contained in the file UnemploymentRates show the unemployment rate for every state and the District of Columbia over two consecutive years. To compare unemployment rates
13. Automobile Fuel Efficiencies. In automobile testing, 13 automobiles were road tested for 500 kilometers in both city and highway driving conditions. The following data were recorded for kilometers-per-liter performance.City: 6.9 7.1 6.7 6.1 5.6 6.5 7.1 6.8 6.8 6.5 6.4 6.5 6.9 Highway: 8.2 8.7
12. Online Multiplayer Game Downloads. The creator of a new online multiplayer survival game has been tracking the monthly downloads of the newest game. The following table shows the monthly downloads (in thousands) for each month of the current and previous year.Month(previous
11. Time Spent Watching Traditional TV. Nielsen tracks the amount of time that people spend consuming media content across different platforms (digital, audio, television) in the United States. Nielsen has found that traditional television viewing habits vary based on the age of the consumer as an
10. Hardshell Jacket Ratings. OutdoorGearLab is an organization that tests outdoor gear used for climbing, camping, mountaineering, and backpacking. Suppose that the following data show the ratings of hardshell jackets based on the breathability, durability, versatility, features, mobility, and
9. Advertising Spending. Which companies spend the most money on advertising?Business Insider maintains a list of the top-spending companies. In 2014, Procter &Gamble spent more than any other company, a whopping $5 billion. In second place was Comcast, which spent $3.08 billion (Business Insider
8. Middle-Level Manager Salaries. Suppose that an independent study of middle-level managers employed at companies located in Atlanta, Georgia, was conducted to compare the salaries of managers working at firms in Atlanta to the salaries of middle-level managers across the nation. The following
7. eICU Waiting Times. There is a severe shortage of critical care doctors and nurses to provide intensive-care services in hospitals. To offset this shortage, many hospitals, such as Emory Hospital in Atlanta, are using electronic intensive-care units (eICUs) to help provide this care to patients
6. Consider a sample with data values of 53, 55, 70, 58, 64, 57, 53, 69, 57, 68, and 53.Compute the mean, median, and mode.Applications
5. Consider a sample with data values of 27, 25, 20, 15, 30, 34, 28, and 25. Compute the 20th, 25th, 65th, and 75th percentiles.
4. Consider the following data.Period Rate of Return (%)1 26.0 2 28.0 3 24.0 4 2.0 5 5.4 What is the mean growth rate over these five periods?
3. Consider the following data and corresponding weights.xi Weight (wi )3.2 6 2.0 3 2.5 2 5.0 8a. Compute the weighted mean.b. Compute the sample mean of the four data values without weighting. Note the difference in the results provided by the two computations.
2. Consider a sample with data values of 10, 20, 21, 17, 16, and 12. Compute the mean and median.
1. Consider a sample with data values of 10, 20, 12, 17, and 16. Compute the mean and median.
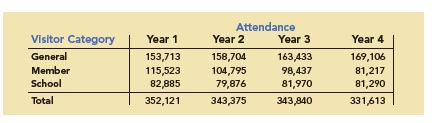
58. Zoo Member Types and Attendance. A zoo has categorized its visitors into three categories: member, school, and general. The member category refers to visitors who pay an annual fee to support the zoo. Members receive certain benefits such as discounts on merchandise and trips planned by the
57. Electric Vehicle Sales. Electric plug-in vehicle sales have been increasing worldwide. The table below displays data collected by the U.S. Department of Energy on electric plug-in vehicle sales in the words top markets in 2013 and 2015. (Data compiled by Argonne National Laboratory, U.S.
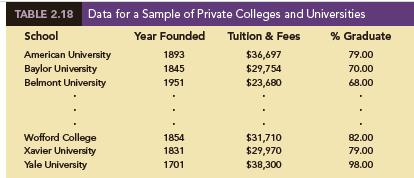
56. Colleges’ Cost and Percent Graduated. Refer to the data set in Table 2.18.a. Prepare a scatter diagram to show the relationship between Tuition & Fees and %Graduate.b. Comment on any relationship between the variables.
55. Colleges’ Year Founded and Cost. Refer to the data set in Table 2.18.a. Construct a scatter diagram to show the relationship between Year Founded and Tuition & Fees.b. Comment on any relationship between the variables.
54. Colleges’ Year Founded and Percent Graduated. Refer to the data set in Table 2.18.a. Construct a crosstabulation with Year Founded as the row variable and % Graduate as the column variable. Use classes starting with 1600 and ending with 2000 in increments of 50 for Year Founded. For %
53. Colleges’ Year Founded and Cost. Table 2.18 shows a portion of the data for a sample of 103 private colleges and universities. The complete data set is contained in the file Colleges. The data include the name of the college or university, the year the institution was founded, the tuition and
52. Best Places to Work. Fortune magazine publishes an annual survey of the 100 best companies to work for. The data in the file FortuneBest100 shows the rank, company name, the size of the company, and the percentage job growth for full-time employees for 98 of the Fortune 100 companies for which
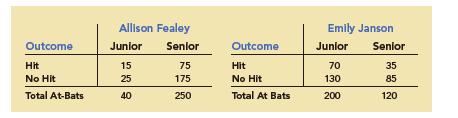
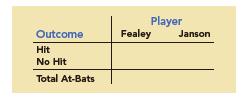
51. Softball Players Batting Averages. Western University has only one women’s softball scholarship remaining for the coming year. The final two players that Western is considering are Allison Fealey and Emily Janson. The coaching staff has concluded that the speed and defensive skills are
50. Education Level and Household Income. The U.S. Census Bureau serves as the leading source of quantitative data about the nation’s people and economy. The following crosstabulation shows the number of households (1000s) and the household income by the level of education for heads of household
49. Stock Price Volatility. The term “beta” refers to a measure of a stock’s price volatility relative to the stock market as a whole. A beta of 1 means the stock’s price moves exactly with the market. A beta of 1.6 means the stock’s price would increase by 1.6%for an increase of 1% in
48. Complaints Reported to BBB. Consumer complaints are frequently reported to the Better Business Bureau (BBB). Some industries against whom the most complaints are reported to the BBB are banks; cable and satellite television companies; collection agencies; cellular phone providers; and new car
47. Startup Company Funds. According to the Wall Street Journal, a startup company’s ability to gain funding is a key to success. The funds raised (in millions of dollars) by 50 startup companies appear below.81 61 103 166 168 80 51 130 77 78 69 119 81 60 20 73 50 110 21 60 192 18 54 49 63 91 272
46. State Populations. Data showing the population by state in millions of people follow (The World Almanac).State Population State Population State Population Alabama Alaska Arizona Arkansas California Colorado Connecticut Delaware Florida Georgia Hawaii Idaho Illinois Indiana Iowa Kansas Kentucky
45. Median Household Incomes. The file MedianHousehold contains the median household income for a family with two earners for each of the fifty states (American Community Survey).a. Construct a frequency and a percent frequency distribution of median household income. Begin the first class at 65.0
44. SAT Scores. The SAT is a standardized test used by many colleges and universities in their admission decisions. More than one million high school students take the SAT each year. The current version of the SAT includes three parts: reading comprehension, mathematics, and writing. A perfect
43. Store Managers Time Study. The Northwest regional manager of an outdoor equipment retailer conducted a study to determine how managers at three store locations are using their time. A summary of the results are shown in the following table.Percentage of Manager’s Work Week Spent on Store
42. Smartphone Ownership. Consider the following survey results that show smartphone ownership by age.Age Category Smartphone (%) Other Cell Phone (%) No Cell Phone (%)18–24 25–34 35–44 45–54 55–64 65+49 58 44 28 22 11 46 35 45 58 59 45 5 7 11 14 19 44a. Construct a stacked bar chart to
41. Hypertension and Heart Disease. People often wait until middle age to worry about having a healthy heart. However, many studies have shown that earlier monitoring of risk factors such as blood pressure can be very beneficial (The Wall Street Journal).Having higher than normal blood pressure, a
40. Low Temperatures and Snowfall. The file Snow contains temperature and snowfall data for 51 major U.S. cities over 30 years. For example, the average low temperature for Columbus, Ohio, is 6.7 degrees and the average annual snowfall is 69.9 centimeters.a. Construct a scatter diagram with the
39. Driving Speed and Fuel Efficiency. A study on driving speed (kilometers per hour) and fuel efficiency (kilometers per liter) for midsize automobiles resulted in the following data:Driving Speed 50 80 65 90 50 40 95 40 80 90 Fuel Efficiency 11.8 10.6 10.6 9.7 12.7 13.5 8.9 14.8 11.0 10.6a.
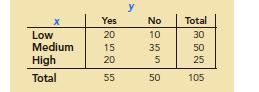
38. The following crosstabulation summarizes the data for two categorical variables, x and y. The variable x can take on values low, medium, or high and the variable y can take on values yes or no.a. Compute the row percentages.b. Construct a stacked percent frequency bar chart with x on the
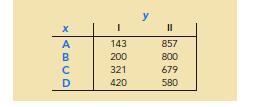
37. Consider the following data on two categorical variables. The first variable, x, can take on values A, B, C, or D. The second variable, y, can take on values I or II. The following table gives the frequency with which each combination occurs.a. Construct a side-by-side bar chart with x on the
36. The following 20 observations are for two quantitative variables, x and y.Observation x y Observation x y 1 2 3 4 5 6 7 8 9 10 222 233 2 29 213 21 213 223 14 3 22 49 8 216 10 228 27 35 25 23 11 12 13 14 15 16 17 18 19 20 237 34 9 233 20 23 215 12 220 27 48 229 218 31 216 14 18 17 211 222a.
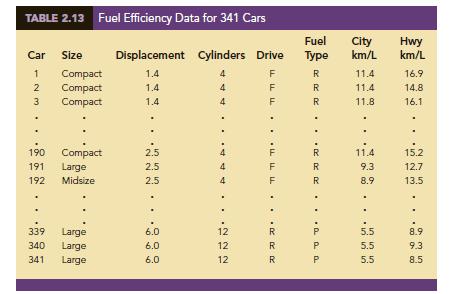
35. Car Fuel Efficiencies. The U.S. Department of Energy’s Fuel Economy Guide provides fuel efficiency data for cars and trucks (Fuel Economy website). A portion of the data from 2018 for 341 compact, midsize, and large cars is shown in Table 2.13.The data set contains the following
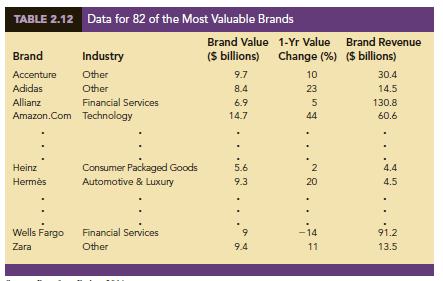
34. Revenue of World’s Most Valuable Brands. Refer to Table 2.12.a. Prepare a crosstabulation of the data on Industry (rows) and Brand Revenue($ billions). Use class intervals of 25 starting at 0 for Brand Revenue ($ billions).b. Prepare a frequency distribution for the data on Brand Revenue ($
33. Values of World’s Most Valuable Brands. Each year Forbes ranks the world’s most valuable brands. A portion of the data for 82 of the brands in the 2013 Forbes list is shown in Table 2.12 (Forbes website). The data set includes the following variables:Brand: The name of the brand.Industry:
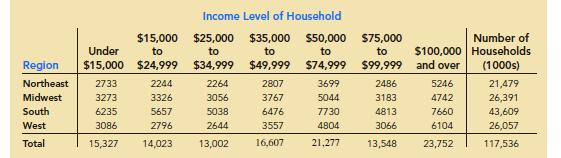
32. Household Income Levels. The following crosstabulation shows the number of households (1000s) in each of the four regions of the United States and the number of households at each income level (U.S. Census Bureau website,
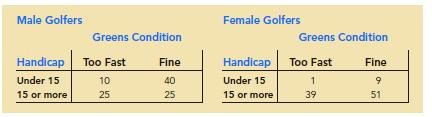
31. Golf Course Complaints. Recently, management at Oak Tree Golf Course received a few complaints about the condition of the greens. Several players complained that the greens are too fast. Rather than react to the comments of just a few, the Golf Association conducted a survey of 100 male and 100
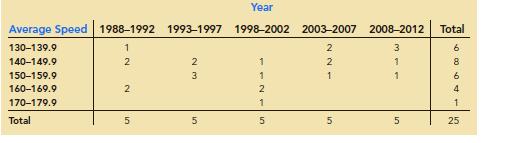
30. Daytona 500 Average Speeds of Winners. The following crosstabulation shows the average speed of the 25 winners by year of the Daytona 500 automobile race (The World Almanac).a. Calculate the row percentages.b. What is the apparent relationship between average winning speed and year? What might
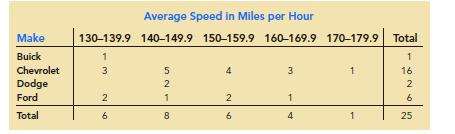
29. Daytona 500 Automobile Makes Average Speeds. The Daytona 500 is a 500-mile automobile race held annually at the Daytona International Speedway in Daytona Beach, Florida. The following crosstabulation shows the automobile make by average speed of the 25 winners over a 25 year period (The World
28. The following observations are for two quantitative variables, x and y.Observation x y Observation x y 1 2 3 4 5 6 7 8 9 10 28 17 52 79 37 71 37 27 64 53 72 99 58 34 60 22 77 85 45 47 11 12 13 14 15 16 17 18 19 20 13 84 59 17 70 47 35 62 30 43 98 21 32 81 34 64 68 67 39 28a. Develop a
27. The following data are for 30 observations involving two categorical variables, x and y.The categories for x are A, B, and C; the categories for y are 1 and 2.Observation x y Observation x y 12 34 56 78 910 11 12 13 14 15 AB BC BC BC AB AB CC C1 11 21 21 21 11 12 22 16 17 18 19 20 21 22 23 24
26. Marathon Runner Ages. The Flying Pig is a marathon (26.2 mile long) running race held every year in Cincinnati, Ohio. Suppose that the following data show the ages for a sample of 40 marathon runners.49 33 40 37 56 44 46 57 55 32 50 52 43 64 40 46 24 30 37 43 31 43 50 36 61 27 44 35 31 43 52 43
25. Best Paying College Degrees. Each year America.EDU ranks the best paying college degrees in America. The following data show the median starting salary, the mid- career salary, and the percentage increase from starting salary to mid- career salary for the 20 college degrees with the hi ghest
24. Engineering School Graduate Salaries. The file EngineeringSalary contains the median starting salary and median mid-career salary (measured 10 years after graduation)for graduates from 19 engineering schools (The Wall Street Journal). Develop a stem-and-leaf display for both the median starting
23. Percent Change in Stock Market Indexes. The following data show the year to date percent change (YTD % Change) for 30 stock-market indexes from around the world(The Wall Street Journal).a. What index has the largest positive YTD % Change?b. Using a class width of 5 beginning with −20 and
22. Top U.S. Franchises. Entrepreneur magazine ranks franchises using performance measures such as growth rate, number of locations, startup costs, and financial stability. The number of locations for 20 U.S. franchises follows (The World Almanac).Use classes 0–4999, 5000–9999, 10,000–14,999
21. Largest University Endowments. University endowments are financial assets that are donated by supporters to be used to provide income to universities. There is a large discrepancy in the size of university endowments. The following table provides a listing of many of the universities that have
20. CEO Time in Meetings. The London School of Economics and the Harvard Business School have conducted studies of how chief executive officers (CEOs)spend their time. These studies have found that CEOs spend many hours per week in meetings that include conference calls, business meals, and public
19. Busiest North American Airports. Based on the total passenger traffic, the airports in the following list are the 20 busiest airports in North America in 2018 (The World Almanac).a. Which is busiest airport in terms of total passenger traffic? Which is the least busy airport in terms of total
18. NBA Total Player Ratings. CBSSports.com developed the Total Player Ratings system to rate players in the National Basketball Association (NBA) based upon various offensive and defensive statistics. The following data show the average number of points scored per game (PPG) for 50 players with
17. Patient Waiting Times. A doctor’s office staff studied the waiting times for patients who arrive at the office with a request for emergency service. The following data with waiting times in minutes were collected over a one-month period.2 5 10 12 4 4 5 17 11 8 9 8 12 21 6 8 7 13 18 3 Use
16. Construct a stem-and-leaf display for the following data. Use a leaf unit of 10.1161 1206 1478 1300 1604 1725 1361 1422 1221 1378 1623 1426 1557 1730 1706 1689 Applications
15. Construct a stem-and-leaf display for the following data.11.3 9.6 10.4 7.5 8.3 10.5 10.0 9.3 8.1 7.7 7.5 8.4 6.3 8.8
14. Consider the following data.8.9 10.2 11.5 7.8 10.0 12.2 13.5 14.1 10.0 12.2 6.8 9.5 11.5 11.2 14.9 7.5 10.0 6.0 15.8 11.5a. Construct a dot plot.b. Construct a frequency distribution.c. Construct a percent frequency distribution.
13. Construct a histogram for the data in exercise 12.
12. Consider the following frequency distribution.Class Frequency 10–19 10 20–29 14 30–39 17 40–49 7 50–59 2 Construct a cumulative frequency distribution and a cumulative relative frequency distribution.
11. Consider the following data.14 21 23 21 16 19 22 25 16 16 24 24 25 19 16 19 18 19 21 12 16 17 18 23 25 20 23 16 20 19 24 26 15 22 24 20 22 24 22 20a. Develop a frequency distribution using classes of 12–14, 15–17, 18–20, 21–23, and 24–26.b. Develop a relative frequency distribution
10. Online Hotel Ratings. TripAdvisor is one of many online websites that provides ratings for hotels throughout the world. Ratings provided by 649 guests at the Lakeview Hotel can be found in the file HotelRatings. Possible responses were Excellent, Very Good, Average, Poor, and Terrible.a.
9. Degrees Awarded Annually. Nearly 1.9 million bachelor’s degrees and over 758,000 master’s degrees are awarded annually by U.S. postsecondary institutions as of 2018(National Center for Education Statistics website). The Department of Education tracks the field of study for these graduates in
8. Baseball Hall of Fame Positions. Data for a sample of 55 members of the Baseball Hall of Fame in Cooperstown, New York, are shown here. Each observation indicates the primary position played by the Hall of Famers: pitcher (P), catcher (H), 1st base (1), 2nd base (2), 3rd base (3), shortstop (S),
7. Airline Customer Satisfaction Survey. Many airlines use surveys to collect data on customer satisfaction related to flight experiences. Completing a flight, customers receive an email asking them to rate a variety of factors, including the reservation process, the check-in process, luggage
6. Top Rated Television Show Networks. Nielsen Media Research tracks the top-rated television shows. The following data show the television network that produced each of the 25 top-rated shows in the history of television.CBS CBS ABC CBS NBC CBS NBC NBC NBC CBS NBC NBC ABC CBS CBS FOX NBC ABC ABC
5. Most Popular Last Names. In alphabetical order, the six most common last names in the United States in 2018 are Brown, Garcia, Johnson, Jones, Smith, and Williams(United States Census Bureau website). Assume that a sample of 50 individuals with one of these last names provided the following
4. Most Visited Websites. In a recent report, the top five most-visited English-language websites were google.com (GOOG), facebook.com (FB), youtube.com (YT), yahoo.com (YAH), and wikipedia.com (WIKI). The most-visited websites for a sample of 50 Internet users are shown in the following table:YAH
3. A questionnaire provides 58 Yes, 42 No, and 20 no-opinion answers.a. In the construction of a pie chart, how many degrees would be in the section of the pie showing the Yes answers?b. How many degrees would be in the section of the pie showing the No answers?c. Construct a pie chart.d. Construct
2. A partial relative frequency distribution is given.a. What is the relative frequency of class D?b. The total sample size is 200. What is the frequency of class D?c. Show the frequency distribution.d. Show the percent frequency distribution.Class Relative Frequency A .22 B .18 C .40 D
1. The response to a question has three alternatives: A, B, and C. A sample of 120 responses provides 60 A, 24 B, and 36 C. Show the frequency and relative frequency distributions.
Showing 900 - 1000
of 2867
First
3
4
5
6
7
8
9
10
11
12
13
14
15
16
17
Last
Step by Step Answers