

Question: Using the data below, schedule the problem in MS Project. Display and print the schedule in a Gantt chart showing the critical path and the
Using the data below, schedule the problem in MS Project. Display and print the schedule in a Gantt chart showing the critical path and the predecessors.
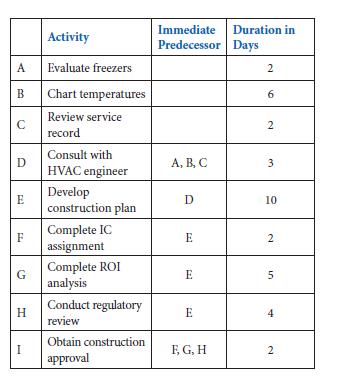
A B D E F G H I Activity Evaluate freezers Chart temperatures Review service record Consult with HVAC engineer Develop construction plan Complete IC assignment Complete ROI analysis Conduct regulatory review Obtain construction approval Immediate Predecessor Days A, B, C D E E E F, G, H Duration in 2 6 2 3 10 2 5 4 2
Step by Step Solution
★★★★★
3.41 Rating (154 Votes )
There are 3 Steps involved in it
1 Expert Approved Answer
Step: 1 Unlock

Question Has Been Solved by an Expert!
Get step-by-step solutions from verified subject matter experts
Step: 2 Unlock
Step: 3 Unlock