

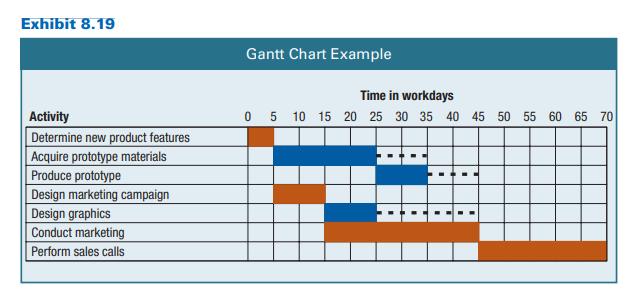
Question: Using the information for Exercise 8.8, input the data into MS Project. Display and print the schedule in Gantt chart format, as shown in Exhibit
Using the information for Exercise 8.8, input the data into MS Project. Display and print the schedule in Gantt chart format, as shown in Exhibit 8.19
Exercise 8.8
Given the information below, create the project schedule network. Then, using the two-pass method, calculate and show the early and late starts and float for each activity and the critical path. Show the schedule on a Gantt chart showing critical and non-critical activities and float.
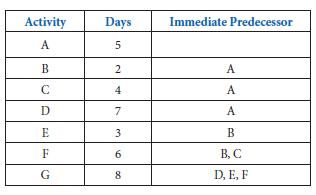
Activity A B C D E F G Days 5 2 4 7 3 6 8 Immediate Predecessor A A A B B, C D, E, F
Step by Step Solution
★★★★★
3.42 Rating (149 Votes )
There are 3 Steps involved in it
1 Expert Approved Answer
Step: 1 Unlock

Question Has Been Solved by an Expert!
Get step-by-step solutions from verified subject matter experts
Step: 2 Unlock
Step: 3 Unlock