

Question: Use MATLAB to simulate the following system and plot the output, y(t), for a step input. Mark on the plot the steady-state value, percent overshoot,
Use MATLAB to simulate the following system and plot the output, y(t), for a step input. Mark on the plot the steady-state value, percent overshoot, and the rise time, peak time, and settling time.
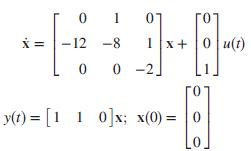
1 07 X = | - 12 -8 1 x+ 0 u(t) 0 -2. y(1) = [1 1 0]x; x(0) = 0
Step by Step Solution
★★★★★
3.41 Rating (160 Votes )
There are 3 Steps involved in it
1 Expert Approved Answer
Step: 1 Unlock

To simulate the given system in MATLAB and plot the output for a step input we first need ... View full answer
Question Has Been Solved by an Expert!
Get step-by-step solutions from verified subject matter experts
Step: 2 Unlock
Step: 3 Unlock