

Question: In Exercises, a. Obtain and interpret the quartiles. b. Determine and interpret the interquartile range. c. Find and interpret the five-number summary. d. Identify potential
In Exercises,
a. Obtain and interpret the quartiles.
b. Determine and interpret the interquartile range.
c. Find and interpret the five-number summary.
d. Identify potential outliers, if any.
e. Construct and interpret a boxplot.
Water parks are a huge summer attraction for vacationers in the United States. The Global Attractions Attendance Report, published by the Themed Entertainment Association, provides the attendance report for theme parks and water parks around the world. The following table provides the total yearly attendance for the top 20 water parks in the United States, in thousands, during one year.
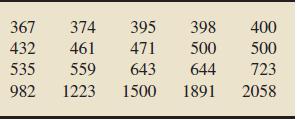
367 374 432 461 535 559 982 1223 395 471 643 1500 1891 398 500 644 400 500 723 2058
Step by Step Solution
3.49 Rating (149 Votes )
There are 3 Steps involved in it
a Step 1 First arrange the data in increasing order Step 2 Since this data set has an odd number of ... View full answer

Get step-by-step solutions from verified subject matter experts