New Semester
Started
Get
50% OFF
Study Help!
--h --m --s
Claim Now
Question Answers
Textbooks
Find textbooks, questions and answers
Oops, something went wrong!
Change your search query and then try again
S
Books
FREE
Study Help
Expert Questions
Accounting
General Management
Mathematics
Finance
Organizational Behaviour
Law
Physics
Operating System
Management Leadership
Sociology
Programming
Marketing
Database
Computer Network
Economics
Textbooks Solutions
Accounting
Managerial Accounting
Management Leadership
Cost Accounting
Statistics
Business Law
Corporate Finance
Finance
Economics
Auditing
Tutors
Online Tutors
Find a Tutor
Hire a Tutor
Become a Tutor
AI Tutor
AI Study Planner
NEW
Sell Books
Search
Search
Sign In
Register
study help
engineering
statistics for engineering and the sciences
Statistics For Engineering And The Sciences 6th Edition William M. Mendenhall, Terry L. Sincich - Solutions
The Ohio Environmental Protection Agency used the Index of Biotic Integrity (IBI) to measure the biological condition or health of an aquatic region. The IBI is the sum of metrics which measure the presence, abundance, and health of fish in the region. (Higher values of the IBI correspond to
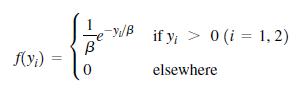
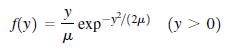
Let Y1 and Y2 be a sample of n = 2 observations from a gamma random variable with parameters α = 1 and arbitrary β, and corresponding density functionShow that the sum W = (Y1 + Y2) is also a gamma random variable with parameters α = 2 and β. [Hint: You may use the resultThen use the fact that
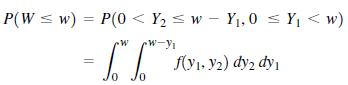
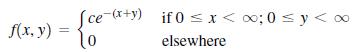
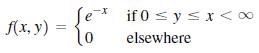
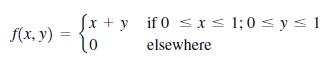
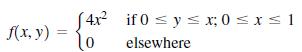
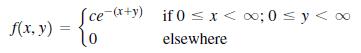
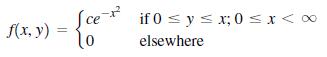
Let X and Y be two continuous random variables with joint probability densitya. Find the value of c.b. Find f1(x).c. Find f2(y).d. Find f1 (x Ι y).e. Find f2 (x Ι y).f. Find P (X ≤ 1 and Y ≤ 1). (ce-(*+y) if 0
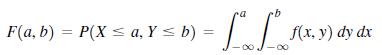
Let X and Y be two continuous random variables with joint probability density f(x, y). The joint distribution function F(a, b) is defined as follows:Verify each of the following:a. F (-∞, -∞) = F(-∞, y) = F(x, -∞) = 0b. F (∞, ∞) = 1c. If a2 ≥ a1 and b2 ≥ b1 ,then F (a2, b2) - F
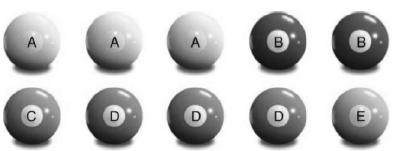
Refer to the IEEE Transactions on Information Forensics and Security (March 2013) study of wireless identify theft using cloned credit or debit cards, Exercise 6.3. On average, how many genuine balls will be drawn when 2 balls are randomly selected from the 10 balls?Data from Exercise 6.3Refer to
Refer to the Canadian Journal of Civil Engineering (Jan. 2013) study, Exercise 6.5.Data from Exercise 6.5Refer to the Canadian Journal of Civil Engineering (Jan. 2013) investigation of the use of variable speed limits to control freeway traffic congestion. Recall that the study site was an urban
Refer to Exercise 6.7.Data from Exercise 6.7A special delivery truck travels from point A to point B and back over the same route each day. There are three traffic lights on this route. Let X be the number of red lights the truck encounters on the way to delivery point B and let Y be the number of
Refer to Exercise 6.12.a. Find E (Y - 10).b. Find E(3Y).Data from Exercise 6.12The Department of Transportation (DOT) monitors sealed bids for new road construction. For new access roads in a certain state, let X = low bid (thousands of dollars) and let Y = DOT estimate of fair cost of
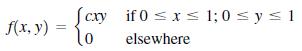
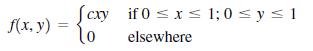
Refer to Exercise 6.16.a. Find E(X).b. Find E(Y).c. Find E (X + Y).d. Find E(XY).Data from Exercise 6.16Let X and Y have the joint density Scxy if 0 s x < 1; 0 s ys 1 lo f(x, y) elsewhere
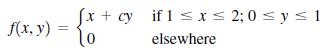
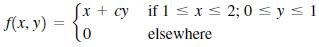
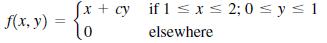
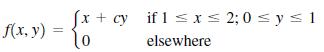
Refer to Exercise 6.17.a. Find E(X).b. Find E(Y).c. Find E (X + Y).d. Find E(XY).Data from Exercise 6.17Let X and Y have the joint density fx + cy if 1 sIS 2;0 s y
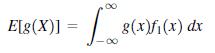
Let X and Y be two continuous random variables with joint probability distribution f(x, y). Consider the function g(X). Show that 00 E[g(X)] = 8(x)fi(x) dx
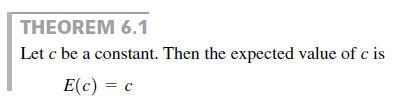
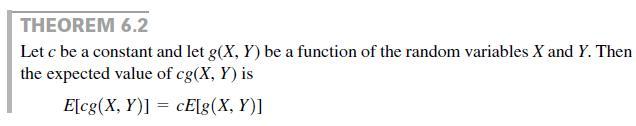
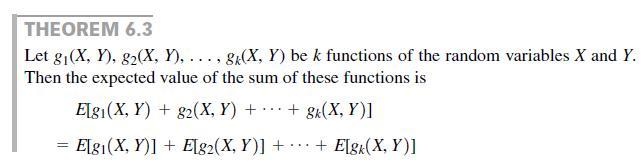
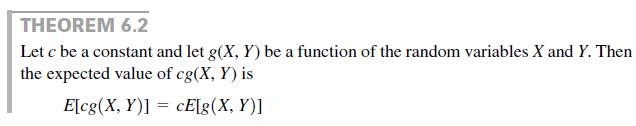
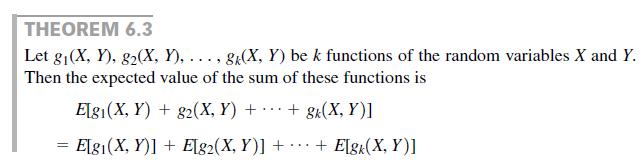
Prove Theorems 6.1–6.3 for discrete random variables X and Y. THEOREM 6.1 Let c be a constant. Then the expected value of c is E(c) = c
Prove Theorems 6.1–6.3 for continuous random variables X and Y. THEOREM 6.1 Let c be a constant. Then the expected value of c is E(c) = c
Find the covariance of the random variables X and Y in Exercise 6.2.Data from Exercise 6.2Consider the experiment of tossing a pair of dice. Let X be the outcome (i.e., the number of dots appearing face up) on the first die and let Y be the outcome on the second die.
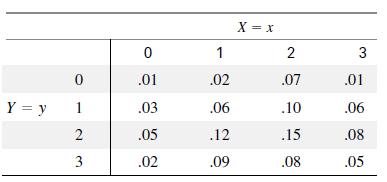
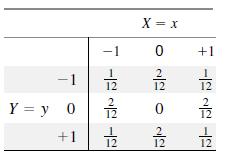
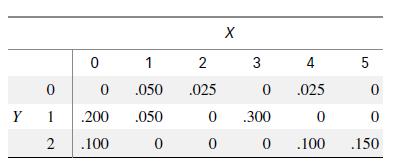
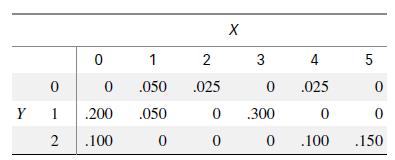
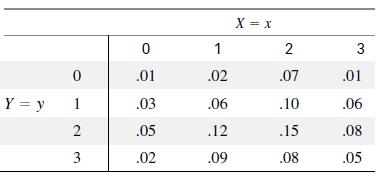
As an illustration of why the converse of Theorem 6.6 is not true, consider the joint distribution of two discrete random variables, X and Y, shown in the accompanying table. Show that Cov (X, Y) = 0, but that X and Y are dependent. X = x +1 Y = y 0 +1 12 O Ne o 2
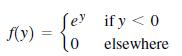
Use Theorem 6.7 to draw a random sample of n = 5observations from a distribution with probability density function Se if y < 0 elsewhere
Use Theorem 6.7 to draw a random sample of n = 5 observations from a beta distribution with α = 2 and β = 1. THEOREM 6.7 Let Y be a continuous random variable with density function f( y) and cumulative dis- tribution F(y). Then the density function of W = F(y) will be a uniform distribution
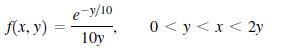
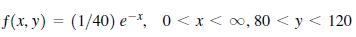
The total time X (in minutes) from the time a supercomputer job is submitted until its run is completed and the time Y the job waits in the job queue before being run have the joint density functionThe CPU time for the job (i.e., the length of time the job is in control of the supercomputer’s
A large freight elevator can transport a maximum of 10,000 pounds (5 tons). Suppose a load of cargo containing 45 boxes must be transported via the elevator. Experience has shown that the weight Y of a box of this type of cargo follows a probability distribution with mean μ = 200 pounds and
Refer to the Earthquake Engineering and Engineering Vibration (March 2013) study of the structural damage to a three-story building caused by seismic ground noise, Exercise 5.33. Recall that the acceleration Y (in meters per second-squared) of the seismic ground noise was modeled using a normal
Refer to the Electrical Engineering (March 2013) assessment of the quality of electrical power, Exercise 5.37. Recall that a measure of quality is the degree to which voltage fluctuations cause light flicker in the system. The perception of light flicker Y in a system (measured periodically over
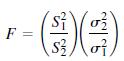
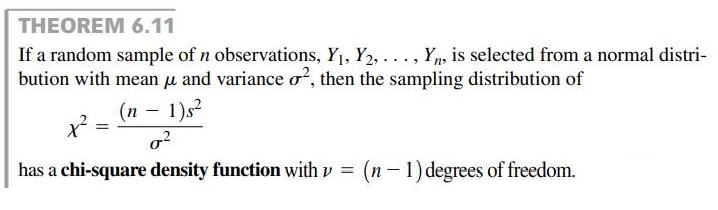
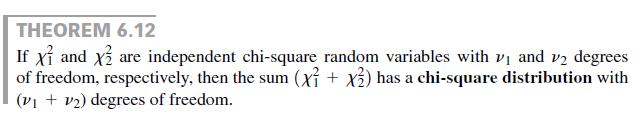
Let Y1 Y2, . . . , Yn1, be a random sample of n1 observations from a normal distribution with mean μ1 and variance σ12. Let X1, X2, . . . , Xn2 be a random sample of n2 observations from a normal distribution with mean μ2 and variance σ22. Assuming the samples were independently selected, show
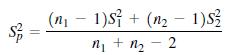
Let S12 and S22 be the variances of independent random samples of sizes n1 and n2 selected from normally distributed populations with parameters (μ1, σ2) and (μ2, σ2), respectively. Thus, the populations have different means, but a common variance σ2. To estimate the common variance, we can
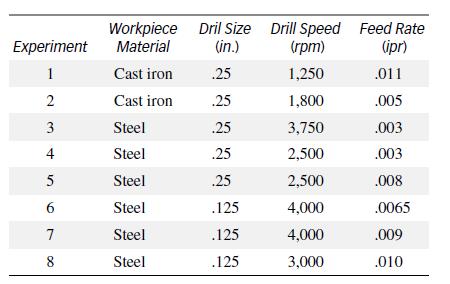
Refer to the Journal of Engineering for Industry (Aug. 1993) study of an automated drilling machine, Exercise 3.67. The eight machining conditions used in the study are reproduced here.Suppose that two of the machining conditions listed will detect a flaw in the automated system. Define X as the
Refer to the U.S. Army Corps of Engineers data on contaminated fish saved in the DDT file. Recall that the length (in centimeters), weight (in grams), and DDT level (in parts per million) were measured for each of 144 fish caught from the polluted Tennessee River in Alabama. a. An analysis of
The management of a bank must decide whether to install a commercial loan decision-support system (an online management information system) to aid its analysts in making commercial loan decisions. Past experience shows that X, the additional number (per year) of correct loan decisions—accepting
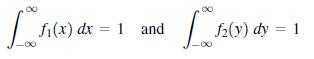
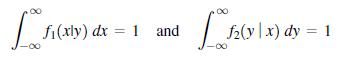
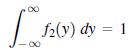
Suppose that X and Y, the proportions of an 8-hour workday that two quality control inspectors actually spend on performing their assigned duties, have joint probability densitya. Find the marginal probability distributions, f1(x) and f2(y).b. Verify thatc. Find the conditional probability
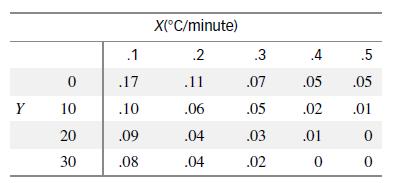
Studies by neuroscientists at the Massachusetts Institute of Technology (MIT) reveal that melatonin, which is secreted by the pineal gland in the brain, functions naturally as a sleep-inducing hormone. Male volunteers were given various doses of melatonin or placebos and then placed in a dark room
The merging process from an acceleration lane to the through lane of a freeway constitutes an important aspect of traffic operation at interchanges. A study of parallel interchange ramps in Israel revealed that many drivers do not use the entire length of parallel lanes for acceleration, but seek
Concrete experiences a characteristic marked increase in “creep” when it is heated for the first time under load. An experiment was conducted to investigate the transient thermal strain behavior of concrete (Magazine of Concrete Research, Dec. 1985). Two variables thought to affect thermal
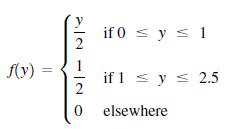
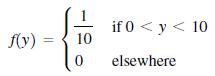
A supplier of home heating oil has a 250-gallon tank that is filled at the beginning of each week. Since the weekly demand for the oil increases steadily up to 100 gallons and then levels off between 100 and 250 gallons, the probability distribution of the weekly demand Y (in hundreds of gallons)
Dioxin, often described as the most toxic chemical known, is created as a by-product in the manufacture of herbicides such as Agent Orange. Scientists have found that .000005 gram (five-millionths of a gram) of dioxin—a dot barely visible to the human eye—is a lethal dose for experimental
The determination of the percent canopy closure of a forest is essential for wildlife habitat assessment, watershed runoff estimation, erosion control, and other forest management activities. One way in which geoscientists estimate percent forest canopy closure is through the use of a satellite
Refer to Exercise 6.113. Let S2 be the variance of the TMS readings for the 32 sampled forest sites. Assuming the sample is from a normal population, estimate the probability that S2 exceeds 1,311.Data from Exercise 6.113The determination of the percent canopy closure of a forest is essential for
Quality control is a problem with items that are mass-produced. The production process must be monitored to ensure that the rate of defective items is kept at an acceptably low level. One method of dealing with this problem is lot acceptance sampling, in which a random sample of items produced is
IEEE Transactions (June 1990) presented a hybrid algorithm for solving polynomial 0–1 mathematical programming problems. The solution time (in seconds) for a randomly selected problem solved using the hybrid algorithm has a normal probability distribution with mean μ = .8 second and σ = 1.5
An article in Industrial Engineering (August 1990) discussed the importance of modeling machine downtime correctly in simulation studies. As an illustration, the researcher considered a single-machine tool system with repair times (in minutes) that can be modeled by an exponential distribution with
Let X and Y be uncorrelated random variables. Verify each of the following:a. V(X + Y) = V(X - Y)b. Cov[(X + Y), (X - Y)] = V(X) - V(Y)
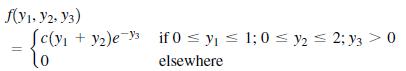
Suppose three continuous random variables Y1, Y2, Y3 have the joint distributiona. Find the value of c that makes f(y1, y2, y3) a probability density.b. Are the three variables independent? fy1. V2. y3) + y2)e y if 0 s y, s 1; 0 s y2 = 2; y3 > 0 lo elsewhere
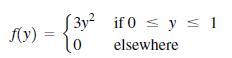
Consider the density functionFind the density function of W, where:a. W = √Yb. W = 3 - Yc. W = - ln (Y) S3y if 0 < ys 1 if 0 s y s 1 f(y) to elsewhere
Let Y have an exponential density with mean β. Show that W = 2Y/β has a x2 density with v = 2 degrees of freedom.
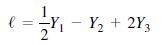
Suppose that Y1, Y2, and Y3 are random variables with (μ1 = 0, σ12 = 2), (μ2 = 1, σ22 = 3), (μ3 = 5, σ32 = 9), Cov (Y1, Y2) = 1, Cov (Y1, Y3) = 4, and Cov (Y2, Y3) = -2Find the mean and variance of l = Y, - Y, + 2Y3
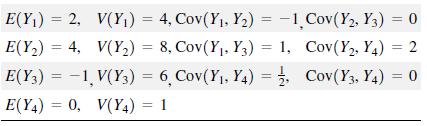
Suppose that Y1, Y2, Y3, and Y4 are random variables withFind the mean and variance ofl = -3Y1 + 2Y2 + 6Y3 - Y4 E(Y¡) = 2, V(Y1) = 4, Cov(Y1, Y2) = -1 Cov(Y2, Y3) = 0 E(Y,) = 4, V(Y2) = 8, Cov(Y,, Y3) = 1, Cov(Y,, Y4) = 2 E(Y3) = -1, V(Y3) = 6, Cov(Y, Y4) = Cov(Y3, Y4) = 0 %3D E(Y4) = 0, V(Y4) = 1
Let Y1, Y2, . . . , Yn be a sample of n independent observations selected from a gamma distribution with α = 1 and β = 2 . Show that the expected value and variance of the sample mean Y̅ are identical to the expected value and variance of a gamma distribution with parameters α = n and β
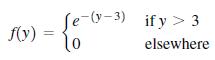
Consider the density functionFind the density function of W, where:a. W = e-Yb. W = Y - 3c. W = Y/3 fe-o-3) to if y > 3 f(y) %3D elsewhere
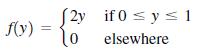
Consider the density functionFind the density function of W, where:a. W = Y2b. W = 2Y -1c. W = 1/Y S2y if 0 s y s 1 lo elsewhere (v)
Refer to the American Mineralogist (October 2009) study of the evolution of uranium minerals in the Earth’s crust, Exercise 5.17. Recall that researchers estimate that the trace amount of uranium Y in reservoirs follows a uniform distribution ranging between 1 and 3 parts per million. In a random
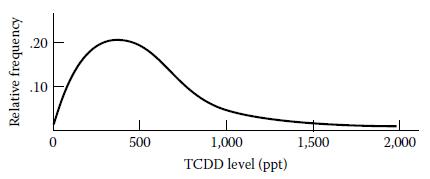
The National Institute for Occupational Safety and Health (NIOSH) evaluated the level of exposure of workers to the chemical dioxin, 2,3,7,8-TCDD. The distribution of TCDD levels in parts per trillion (ppt) of production workers at a Newark, New Jersey, chemical plant had a mean of 293 ppt and a
Use Monte Carlo simulation to approximate the sampling distribution of s2, the variance of a sample of n = 100 observations from a.a. Uniform distribution on the interval (0, 1).b. Normal distribution, with mean 0 and variance 1.c. Exponential distribution with mean 1.
Use Monte Carlo simulation to approximate the sampling distribution of M, the median of a sample of n = 50 observations from a uniform distribution on the interval (0, 1).
Use Monte Carlo simulation to approximate the sampling distribution of R, the range of a sample of n = 10 observations from a normal distribution, with mean 0 and variance 1.
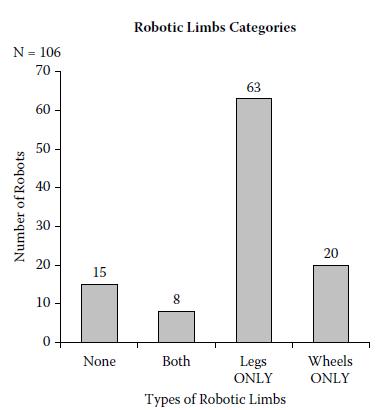
Refer to the International Conference on Social Robotics (Vol. 6414, 2010), study of the trend in the design of social robots, Exercise 2.1. The researchers obtained a random sample of 106 social robots obtained through a web search and determined the number that were designed with legs, but no
The British Medical Journal (August 17, 2002) published a study to compare the effectiveness of handwashing with soap and hand rubbing with alcohol. Health care workers who used hand rubbing had a mean bacterial count of 35 per hand with a standard deviation of 59. Health care workers who used
The U.S. Army Engineering and Housing Support Center recently sponsored a study of the reliability, availability, and maintainability (RAM) characteristics of small diesel and gas-powered systems at commercial and military facilities (IEEE Transactions on Industry Applications, July/Aug. 1990). The
The computer chips in notebook and laptop computers are produced from semiconductor wafers. Certain semiconductor wafers are exposed to an environment that generates up to 100 possible defects per wafer. The number of defects per wafer, Y, was found to follow a binomial distribution if the
According to the International Association of Women in Fire and Protection Services, 4% of all fire fighters in the world are female.a. Approximate the probability that more than 100 of a random sample of 500 fire fighters are female.b. Approximate the probability that 5 or fewer of a random sample
If Y has a x2 distribution with n degrees of freedom then Y could be represented by ∑x = in xi, where the xi's are independent x2 distributions, each with degree of freedom.a. Show that Z = (Y - n)/√2n has approximately a standard normal distribution for large values of n.b. If y has a x2
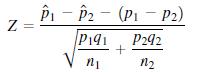
Let p̂1 be the sample proportion of successes in a binomial experiment with n1 trials and let p̂2 be the sample proportion of successes in a binomial experiment with n2 trials, conducted independently of the first. Let p1 and p2 be the corresponding population parameters. Show thathas
Refer to the Journal of Agricultural, Biological and Environmental Sciences (Sep. 2000) evaluation of the risk posed by hazardous pollutants, Exercise 4.28. In the experiment, guppies (all the same age and size) were released into a tank of natural seawater polluted with the pesticide dieldrin and
Consumer Reports found widespread contamination of seafood in New York and Chicago supermarkets. For example, 40% of the swordfish pieces available for sale have a level of mercury above the Food and Drug Administration (FDA) limit. Consider a random sample of 20 swordfish pieces from New York and
Refer to the Scientific American (July 2003) report on whether bottled water is really purified water, Exercise 4.29. Recall that the Natural Resources Defense Council found that 25% of bottled water brands fill their bottles with just tap water. In a random sample of 65 bottled water brands, is it
Refer to the Journal of Performance of Constructed Facilities (Feb. 2005) study of inspection ratings of all major Denver bridges, Exercise 4.30. Recall that the National Bridge Inspection Standard (NBIS) rating scale ranges from 0 (poorest rating) to 9 (highest rating). Engineers forecast that 9%
New Jersey Business reports that Newark International Airport’s terminal handles an average of 3,000 international passengers an hour but is capable of handling twice that number. Also, after scanning all luggage, 20% of arriving international passengers are detained for intrusive luggage
Refer to the Transactions of the ASME (June 2004) study on predicting daily natural gas consumption using temperature, Exercise 5.32. Recall that the researchers showed that the daily July temperature in Buenos Aires, Argentina, is normally distributed with and . Consider a random sample of n daily
Refer to Exercise 6.95. Find the exact probabilities using statistical software.Data from Exercise 6.95Refer to the Transactions of the ASME (June 2004) study on predicting daily natural gas consumption using temperature, Exercise 5.32. Recall that the researchers showed that the daily July
Refer to the IEICE Transactions on Information & Systems (Jan. 2005) study of impedance to leg movements, Exercise 2.46. Recall that engineers attached electrodes to the ankles and knees of volunteers and measured the signal-to noise ratio (SNR) of impedance changes. For a particular ankle-knee
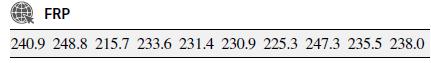
Refer to the Composites Fabrication Magazine (Sept. 2004) evaluation of a new method of fastening fiber-reinforced polymer (FRP) strips to concrete, Exercise 2.47. Recall that a sample of 10 FRP strips mechanically fastened to highway bridges were tested for bearing strength. The strength
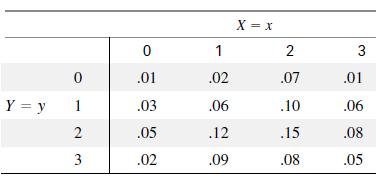
Refer to Exercise 6.1. Are X and Y independent?Data from Exercise 6.1A software program is designed to perform two tasks, A and B. Let X represent the number of IF-THEN statements in the code for task A and let Y represent the number of IF-THEN statements in the code for task B. The joint
Refer to Exercise 6.2. Are X and Y independent?Data from Exercise 6.2Consider the experiment of tossing a pair of dice. Let X be the outcome (i.e., the number of dots appearing face up) on the first die and let Y be the outcome on the second die.
Refer to Exercise 6.3. Are X and Y independent?Data from Exercise 6.3Refer to the IEEE Transactions on Information Forensics and Security (March 2013) study of wireless identify theft using cloned credit or debit cards. A cloning detection method was illustrated using a simple ball drawing game.
Refer to Exercise 6.6. Are X and Y independent?Data from Exercise 6.6Refer to The International Journal of Robotics Research (Dec. 2004) study of a robot-sensor system in an unknown environment. In the three-point, single-link robotic system shown in the accompanying figure, each point (A, B, or C)
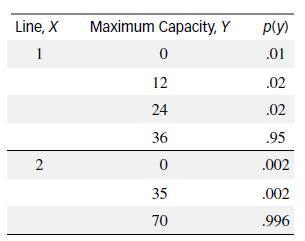
Refer to the Journal of Systems Sciences & Systems Engineering (March 2013) study of the reliability of a manufacturing system for producing integrated circuit (IC) cards that involves two production lines, Exercise 4.6. Recall that items (IC cards) first pass through Line 1, then are processed
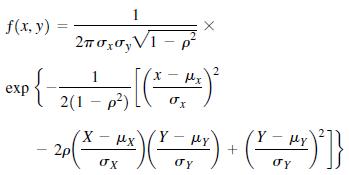
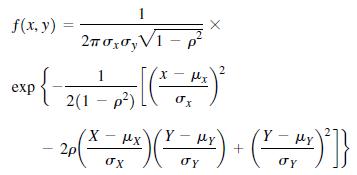
In the Journal of Hydrological Sciences (April 2000), the bivariate normal distribution was used to model the joint distribution of annual storm peak (i.e., maximum rainfall intensity) and total yearly rainfall amount in Tokushima, Japan. Let X represent storm peak and Y represent total amount of
The life length Y (in hundreds of hours) for fuses used in a tele video computer terminal has an exponential distribution with mean β = 5. Each terminal requires two such fuses—one acting as a backup that comes into use only when the first fuse fails.a. If two such fuses have independent life
Let X and Y denote the lifetimes of two different types of components in an electronic system. The joint density of X and Y is given byShow that X and Y are independent. [Hint: A theorem in multivariate probability theory states that X and Y are independent if we can write f(x, y) = g (x)h(y) where
Refer to Exercise 6.15. Show that X and Y are independent.Data from Exercise 6.15Refer to the Journal of Engineering for Industry (May 1993) study of friction feed paper separation. Consider a system that utilizes two interrelated feed paper separators. The joint density of X and Y, the friction
Refer to Exercise 6.16. Are X and Y independent?Data from Exercise 6.16Let X and Y have the joint density Scxy if 0 < x < 1; 0 s y s 1 lo f(x, y) elsewhere
Refer to Exercise 6.17. Are X and Y independent?Data from Exercise 6.17Let X and Y have the joint density Sx + cy if 1 s xs 2; 0 s ys 1 f(x, y) = elsewhere
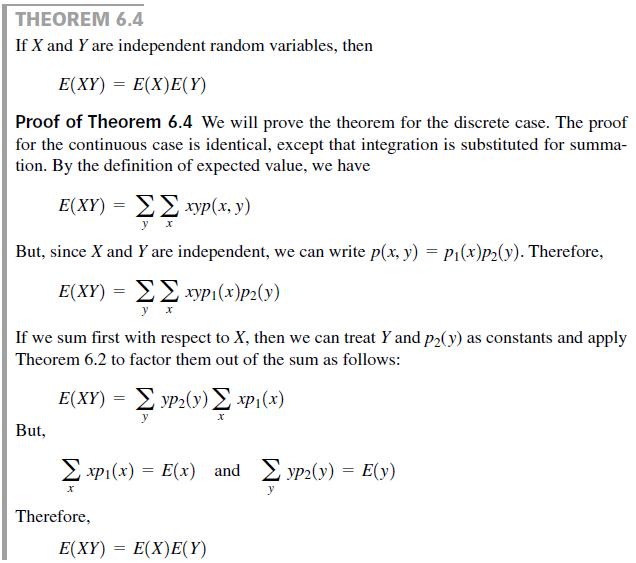
Prove Theorem 6.4 for the continuous case. THEOREM 6.4 If X and Y are independent random variables, then E(XY) = E(X)E(Y) Proof of Theorem 6.4 We will prove the theorem for the discrete case. The proof for the continuous case is identical, except that integration is substituted for summa- tion. By
Find the covariance of the random variables X and Y in Exercise 6.1.Data from Exercise 6.1A software program is designed to perform two tasks, A and B. Let X represent the number of IF-THEN statements in the code for task A and let Y represent the number of IF-THEN statements in the code for task
Find the correlation coefficient r for X and Y in Exercise 6.5.Data from Exercise 6.5Refer to the Canadian Journal of Civil Engineering (Jan. 2013) investigation of the use of variable speed limits to control freeway traffic congestion. Recall that the study site was an urban freeway divided into
Refer to Exercise 6.7.a. Find the covariance of the random variables x and y.b. Find the coefficient of correlation r for x and y.Data from Exercise 6.7A special delivery truck travels from point A to point B and back over the same route each day. There are three traffic lights on this route. Let X
Commercial kerosene is stocked in a bulk tank at the beginning of each week. Because of limited supplies, the proportion X of the capacity of the tank available for sale and the proportion Y of the capacity of the tank actually sold during the week are continuous random variables. Their joint
Refer to the Journal of Hydrological Sciences (April 2000) study of rainfall in Tokushima, Japan, Exercise 6.34. Recall that the bivariate normal distribution was used to model the joint distribution of annual storm peak X (millimeters/day) and annual rainfall amount Y (millimeters). The article
Refer to Exercise 6.16.a. Find the covariance of the random variables X and Y.b. Find the coefficient of correlation ρ for X and Y.Data from Exercise 6.16Let X and Y have the joint density f(x, y) = Scxy if 0 s x s 1; 0 s ys 1 lo elsewhere
Refer to Exercise 6.17.a. Find the covariance of the random variables X and Y.b. Find the coefficient of correlation ρ for X and YData from Exercise 6.17Let X and Y have the joint density Sx + cy if 1 sIS 2;0 s ys1 lo f(x, y) = elsewhere
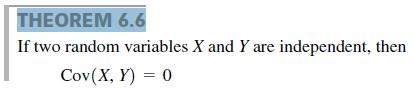
Prove Theorem 6.6 for the discrete case. THEOREM 6.6 If two random variables X and Y are independent, then Cov(X, Y) = 0
Prove Theorem 6.6 for the continuous case. THEOREM 6.6 If two random variables X and Y are independent, then Cov(X, Y) = 0
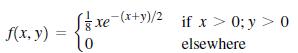
Find the covariance of X and Y for the random variables of Exercise 6.18.Data from Exercise 6.18Let X and Y be two continuous random variables with joint probability density (ce-(r+y) if 0sx< 00; 0 s y < o0 f(x, y) : elsewhere
Refer to Exercise 6.2. Find the mean and variance of (X + Y) , the sum of the dots showing on the two dice.Data from Exercise 6.2Consider the experiment of tossing a pair of dice. Let X be the outcome (i.e., the number of dots appearing face up) on the first die and let Y be the outcome on the
Refer to Exercise 6.7. Find the variance of (X + Y) . Within what range would you expect (X + Y) to fall?Data from Exercise 6.7A special delivery truck travels from point A to point B and back over the same route each day. There are three traffic lights on this route. Let X be the number of red
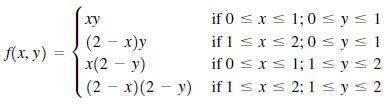
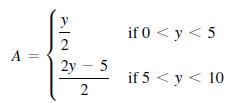
Refer to Exercise 6.14. Find the variance of (X - Y), the time it takes to actually service the car.Data from Exercise 6.14The joint density of X, the total time (in minutes) between an automobile’s arrival in the service queue and its leaving the system after servicing, and Y, the time (in
Refer to the Journal of Engineering Mechanics (Dec. 2009) study of the characteristics of a 10-bar truss subjected to loads, Exercise 6.13. Recall that the joint probability distribution of stiffness index X (pounds/sq. in.) and load Y (thousand pounds) is given by the formula, The
A particular manufacturing process yields a proportion p of defective items in each lot. The number Y of defectives in a random sample of n items from the process follows a binomial distribution. Find the expected value and variance of p̂ = Y/n , the fraction of defectives in the sample.
Researchers at the University of Kent (England) developed models for counting the number of colonies of microorganisms in liquid (Journal of Agricultural, Biological, and Environmental Statistics, June 2005). The expected number of colonies was derived under the “inhibition” model. Consider a
The amount Y of paper used per day by a laser printer at a commercial copy center has an exponential distribution with mean equal to five boxes (i.e., β = 5). The daily cost of the paper is proportional to C = (3Y + 2). Find the probability density function of the daily cost of paper used by the
An environmental engineer has determined that the amount Y (in parts per million) of pollutant per water sample collected near the discharge tubes of an island power plant has probability density functionA new cleaning device has been developed to help reduce the amount of pollution discharged into
Researchers at the University of California (Berkeley) have developed a switched-capacitor circuit for generating pseudorandom signals (International Journal of Circuit Theory and Applications, May/June 1990). The intensity of the signal (voltage), Y, is modeled using the Rayleigh probability
Let X and Y have the joint densitywhere c is a constant.a. Find the value of c that makes f(x, y) a probability density function.b. Find the marginal density for y and showc. Find f1 (x Ι y), the conditional density for X given Y. fx + cy if 1 IS 2; 0 s y s 1 f(x, y) = elsewhere
Let X and Y have the joint densitya. Find the value of c that makes f(x, y) a probability density function.b. Find the marginal densities f1(x) and f2(y).c. Find the conditional densities f1 (x Ι y) and f2 (y Ι x). Scxy if 0 s x s 1; 0 s y s 1 lo f(x, y) elsewhere
Showing 700 - 800
of 1103
1
2
3
4
5
6
7
8
9
10
11
12
Step by Step Answers