

We noted in Figure 14-17 that the liquid and vapor curves taken together outline a lens-shaped region
Question:
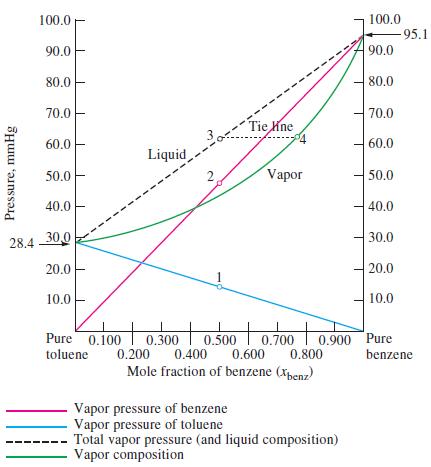
We noted in Figure 14-17 that the liquid and vapor curves taken together outline a lens-shaped region when the normal boiling points of benzene-toluene solutions are plotted as a function of mole fraction of benzene. That is, unlike Figure 14-16, the liquid curve is not a straight line. Use data from Figure 14-17 and show by calculation that this should be the case.
Figure 14-17
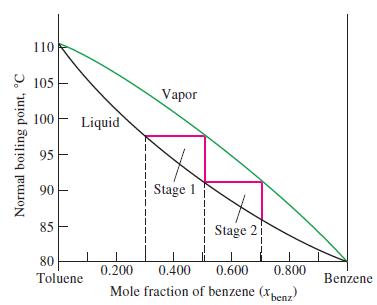
Figure 14-16
Fantastic news! We've Found the answer you've been seeking!
Step by Step Answer:

Answered By
William Otieno
I am a professional tutor and a writer with excellent skills that are important in serving the bloggers and other specialties that requires a great writer. The important aspects of being the best are that I have served so many clients with excellence
With excellent skills, I have acquired very many recommendations which have made it possible for me to survive as an excellent and cherished writer. Being an excellent content writer am also a reputable IT writer with essential skills that can make one turn papers into excellent result.
83+ Reviews
354+ Question Solved
Related Book For 
General Chemistry Principles And Modern Applications
ISBN: 9780132931281
11th Edition
Authors: Ralph Petrucci, Jeffry Madura, F. Herring, Carey Bissonnette
Question Posted:
