

Question: Shown below is a concentration versus time plot for the reaction A B. Using the data on the graph, determine the equilibrium constant for
Shown below is a concentration versus time plot for the reaction A ⇆ B. Using the data on the graph, determine the equilibrium constant for the reaction.
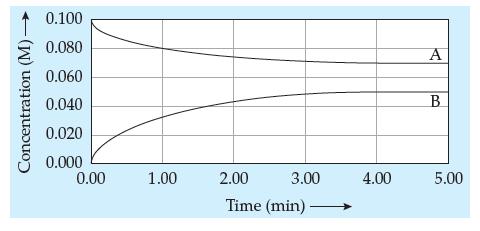
Concentration (M)- 0.100 0.080 0.060 0.040 0.020 0.000 0.00 1.00 2.00 Time (min) 3.00 4.00 A B 5.00
Step by Step Solution
★★★★★
3.36 Rating (171 Votes )
There are 3 Steps involved in it
1 Expert Approved Answer
Step: 1 Unlock

To determine the equilibrium constant for the reaction A B from the concentration versus time ... View full answer
Question Has Been Solved by an Expert!
Get step-by-step solutions from verified subject matter experts
Step: 2 Unlock
Step: 3 Unlock