New Semester
Started
Get
50% OFF
Study Help!
--h --m --s
Claim Now
Question Answers
Textbooks
Find textbooks, questions and answers
Oops, something went wrong!
Change your search query and then try again
S
Books
FREE
Study Help
Expert Questions
Accounting
General Management
Mathematics
Finance
Organizational Behaviour
Law
Physics
Operating System
Management Leadership
Sociology
Programming
Marketing
Database
Computer Network
Economics
Textbooks Solutions
Accounting
Managerial Accounting
Management Leadership
Cost Accounting
Statistics
Business Law
Corporate Finance
Finance
Economics
Auditing
Tutors
Online Tutors
Find a Tutor
Hire a Tutor
Become a Tutor
AI Tutor
AI Study Planner
NEW
Sell Books
Search
Search
Sign In
Register
study help
mathematics
applied calculus
Applied Calculus 6th Edition Deborah Hughes Hallett, Patti Frazer Lock, Andrew M. Gleason, Daniel E. Flath, Sheldon P. Gordon, David O. Lomen, David Lovelock, William G. McCallum, Brad G. Osgood, Andrew Pasquale - Solutions
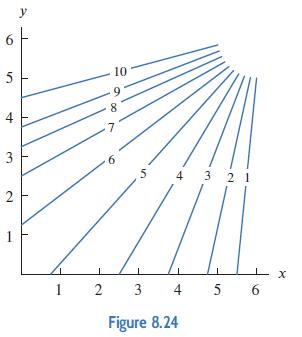
Figure 8.24 shows contours for the function z = f(x, y). Is z an increasing or a decreasing function of x? Is z an increasing or a decreasing function of y? 5 3 2 1 y 1 10 9 8 7 6 4 321 2 3 4 5 6 Figure 8.24 X
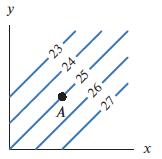
A point A is shown on a contour diagram of a function f(x, y).(a) Evaluate f(A).(b) Is fx(A) positive, negative, or zero?(c) Is fy(A) positive, negative, or zero? X A 25 26 27. - 23- y
A cable company charges $100 for a monthly subscription to its services and $5 for each special feature movie that a subscriber chooses to watch.(a) Write a formula for the monthly revenue, R in dollars, earned by the cable company as a function of s, the number of monthly subscribers it serves,
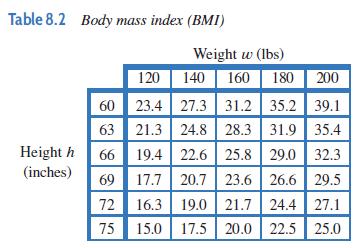
Refer to Table 8.2 which gives a person’s body mass index, BMI, in terms of their weight w (in lbs) and height ℎ (in inches).Compute a table of values of BMI, with ℎ fixed at 60 inches and ω between 120 and 200 lbs at intervals of 20. Table 8.2 Body mass index (BMI) Height h (inches) 120 60
Use Lagrange multipliers to find the maximum or minimum values of f(x, y) subject to the constraint.f(x, y) = xy, 5x + 2y = 100
Find the partial derivatives in Problems. The variables are restricted to a domain on which the function is defined.fx and fy if f(x, y) = 100x2y
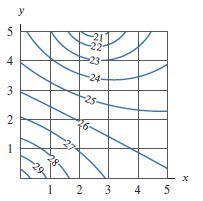
Estimate the position and approximate value of the global maxima and minima on the region shown, including its boundary. 5 4 3 2 1 28 -21 -22 23- -24- -25 26- 12 2 3 4 5 x
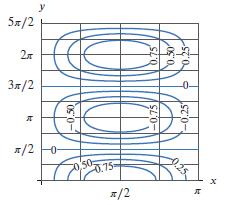
Estimate the position and approximate value of the global maxima and minima on the region shown, including its boundary. 5x/2 2x 3x/2 k y /20- -0.50 50 -0.75 x/2 0.75 -0,75 -0.25 X
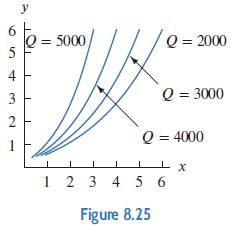
Figure 8.25 is a contour diagram for the sales of a product as a function of the price of the product and the amount spent on advertising. Which axis corresponds to the amount spent on advertising? Explain. 5 4 3 2 y Q = 5000 Q = 2000 Q = 3000 Q = 4000 Lx X 1 2 3 4 5 6 Figure 8.25
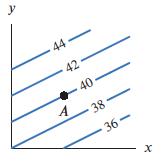
A point A is shown on a contour diagram of a function f(x, y).(a) Evaluate f(A).(b) Is fx(A) positive, negative, or zero?(c) Is fy(A) positive, negative, or zero? y 44 42 A 40 38 -36-
The number, n, of new cars sold in a year is a function of the price of new cars, c, and the average price of gas, g.(a) If c is held constant, is n an increasing or decreasing function of g? Why?(b) If g is held constant, is n an increasing or decreasing function of c? Why?
Use Lagrange multipliers to find the maximum or minimum values of f(x, y) subject to the constraint.f(x, y) = x2 + 3y2 + 100, 8x + 6y = 88
Find the partial derivatives in Problems. The variables are restricted to a domain on which the function is defined.fu and fv if f(u, v) = u2 + 5uv + v2
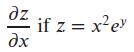
Find the partial derivatives in Problems. The variables are restricted to a domain on which the function is defined. dz if z = x²ey xe
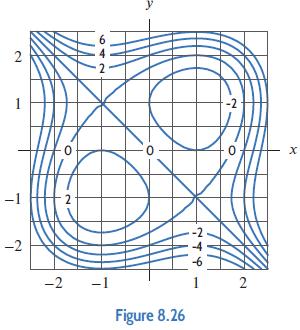
Use the contour diagram for the function z = f(x, y) in Figure 8.26.Find(a) f(1, −1) (b) f(2, −1) (c) f(−1, 0) 2 -1 0 642 -2 -1 y Figure 8.26 -6 -2 2 X
Refer to Table 8.2 which gives a person’s body mass index, BMI, in terms of their weight w (in lbs) and height ℎ (in inches).Medical evidence suggests that BMI values between 18.5 and 24.9 are healthy values. Estimate the range of weights that are considered healthy for a woman who is 6 feet
Use Lagrange multipliers to find the maximum or minimum values of f(x, y) subject to the constraint.f(x, y) = 5xy, x + 3y = 24
Find the partial derivatives in Problems. The variables are restricted to a domain on which the function is defined. до if Q = 5a²p - Зарз др
Use Lagrange multipliers to find the maximum or minimum values of f(x, y) subject to the constraint.f(x, y) = 3x − 2y, x2 + 2y2 = 44
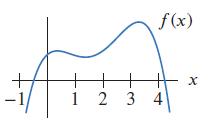
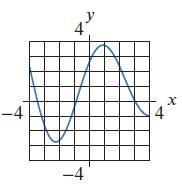
In Problems use the graph given for each function.(a) Estimate the intervals on which the derivative is positive and the intervals on which the derivative is negative.(b) Estimate the intervals on which the second derivative is positive and the intervals on which the second derivative is negative.
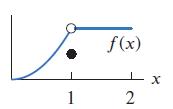
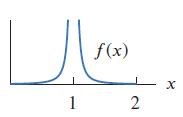
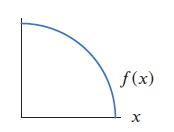
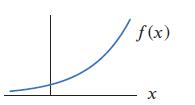
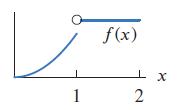
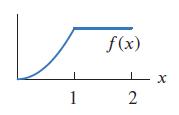
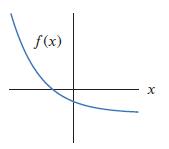
Does the function f(x) appear to be continuous on the interval 0 ≤ x ≤ 2? If not, what about on the interval 0 ≤ x ≤ 0.5? 1 f(x) 2
On May 9, 2007, CBS Evening News had a 4.3 point rating. (Ratings measure the number of viewers.) News executives estimated that a 0.1 drop in the ratings for the CBS Evening News corresponds to a $5.5 million drop in revenue.17 Express this information as a derivative. Specify the function, the
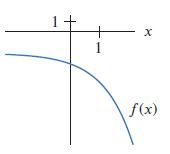
Sketch the graph of f'(x). + f(x) + x 1 2 3 4
A particle moves along a line with varying velocity. At time t the particle is at a distance s = f(t) from a fixed point on the line. Sketch a possible graph for f if the average velocity of the particle between t = 0 and t = 5 is the same as its instantaneous velocity at exactly two times between
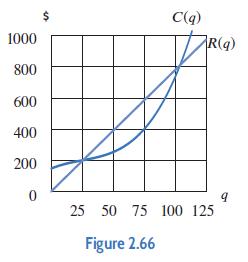
Cost and revenue functions for a charter bus company are shown in Figure 2.66. Should the company add a 50th bus? How about a 90th? Explain your answers using marginal revenue and marginal cost. 1000 800 600 400 200 0 s C(q) R(q) 9 25 50 75 100 125 Figure 2.66
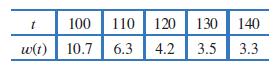
Use the values given for each function.(a) Does the derivative of the function appear to be positive or negative over the given interval? Explain.(b) Does the second derivative of the function appear to be positive or negative over the given interval? Explain. 100 110 120 130 140 3.5 3.3 t w(1)
Does the function f(x) appear to be continuous on the interval 0 ≤ x ≤ 2? If not, what about on the interval 0 ≤ x ≤ 0.5? ال 1 f(x) 2 X
Let S(t) be the amount of water, measured in acre-feet, that is stored in a reservoir in week t.(a) What are the units of S'(t)?(b) What is the practical meaning of S'(t) > 0? What circumstances might cause this situation?
Sketch the graph of f'(x). f(x) X
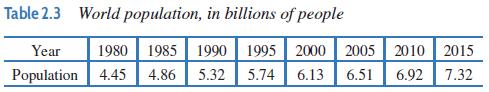
(a) Using Table 2.3, find the average rate of change in the world’s population, P, between 1980 and 2015. Give units.(b) If P = f(t) with t in years, estimate f'(2010) and give units. Table 2.3 World population, in billions of people Year Population 4.45 4.86 5.32 5.74 6.13 6.51 6.92 1980 1985
An industrial production process costs C(q) million dollars to produce q million units; these units then sell for R(q) million dollars. If C(2.1) = 5.1, R(2.1) = 6.9, MC(2.1) = 0.6, and MR(2.1) = 0.7, calculate(a) The profit earned by producing 2.1 million units(b) The approximate change in revenue
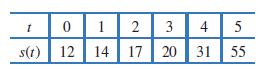
Use the values given for each function.(a) Does the derivative of the function appear to be positive or negative over the given interval? Explain.(b) Does the second derivative of the function appear to be positive or negative over the given interval? Explain. 1 s(t) 12 0 1 2 3 4 5 14 17 20 31 55
A yam has just been taken out of the oven and is cooling off before being eaten. The temperature, T, of the yam (measured in degrees Fahrenheit) is a function of how long it has been out of the oven, t (measured in minutes). Thus, we have T = f(t).(a) Is f'(t) positive or negative? Why?(b) What are
Sketch the graph of f'(x). f(x) x
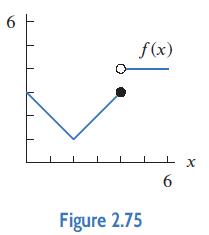
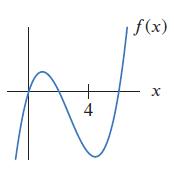
The graph of y = f(x) is in Figure 2.75. Does the function f(x) appear to be continuous on the given interval?(a) 1 ≤ x ≤ 3(b) 0.5 ≤ x ≤ 1.5(c) 3 ≤ x ≤ 5(d) 2 ≤ x ≤ 6 6 f(x) Figure 2.75 L 6 X
The size, S, of a tumor (in cubic millimeters) is given by S = 2t, where t is the number of months since the tumor was discovered. Give units with your answers.(a) What is the total change in the size of the tumor during the first six months?(b) What is the average rate of change in the size of the
A company’s cost of producing q liters of a chemical is C(q) dollars; this quantity can be sold for R(q) dollars. Suppose C(2000) = 5930 and R(2000) = 7780.(a) What is the profit at a production level of 2000?(b) If MC(2000) = 2.1 and MR(2000) = 2.5, what is the approximate change in profit if q
Sketch the graph of a function whose first derivative is everywhere negative and whose second derivative is positive for some x-values and negative for other x-values.
Let f(x) be the elevation in feet of the Mississippi River x miles from its source. What are the units of f'(x)? What can you say about the sign of f'(x)?
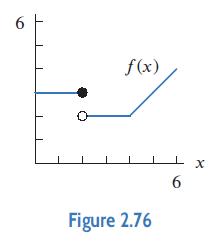
The graph of y = f(x) is in Figure 2.76. Does the function f(x) appear to be continuous on the given interval?(a) 1 ≤ x ≤ 3(b) 0.5 ≤ x ≤ 1.5(c) 3 ≤ x ≤ 5(d) 4 ≤ x ≤ 5 f(x) Figure 2.76 6 X
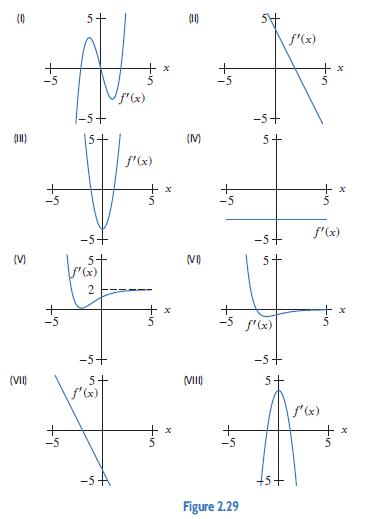
Match the functions in Problem with one of the derivatives in Figure 2.29. (III) E 3 (M) (VII) -5 15+ 2 -5+ 5+ f'(x) ƒ'(x) x x (10) (M) (VI) (MI) -5 Figure 2.29 -5+ 5+ -5+ 5 f'(x) -5+ 5+ f'(x) x f'(x) f'(x) x
Let g(x) = 4x. Use small intervals to estimate g'(1).
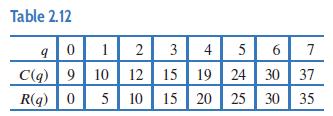
Table 2.12 shows the cost, C(q), and revenue, R(q), in terms of quantity q. Estimate the marginal cost, C'(q), and marginal revenue, R'(q), for q between 0 and 7. Table 2.12 901 2 3 4 5 6 7 C(q) 9 10 12 15 19 24 30 37 R(q) 0 5 10 15 20 25 30 35
IBM-Peru uses second derivatives to assess the relative success of various advertising campaigns. They assume that all campaigns produce some increase in sales. If a graph of sales against time shows a positive second derivative during a new advertising campaign, what does this suggest to IBM
Meteorologists define the temperature lapse rate to be −dT ∕dz where T is the air temperature in Celsius at altitude z kilometers above the ground.(a) What are the units of the lapse rate?(b) What is the practical meaning of a lapse rate of 6.5?
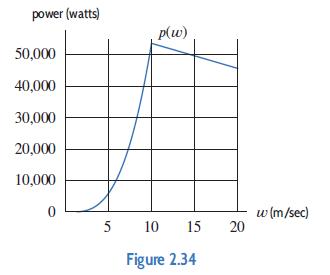
Figure 2.34 shows the power output, p(w), of a wind turbine as a function of wind speed, w.(a) At what wind speed does the turbine generate the most power?(b) The derivative p'(7) is positive but the derivative p'(15) is negative. What does this tell you?(c) Give units and interpret p(7) = 17,500
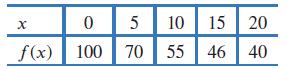
Find approximate values for f'(x) at each of the x- values given in the following table. 0 5 10 15 20 f(x) 100 70 55 46 40 x
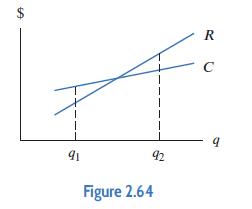
Figure 2.64 shows part of the graph of cost and revenue for a car manufacturer. Which is greater, marginal cost or marginal revenue, at(a) q1?(b) q2? 91 92 Figure 2.64 R C 9
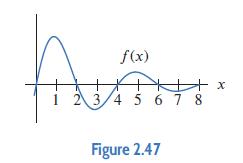
Use Figure 2.47 to determine which of the two values is greater.f'(0) or f'(4)? At f(x) + x 1 2 3 4 5 6 7 8 Figure 2.47
Estimate the limit by substituting smaller and smaller values of ℎ. For trigonometric functions, use radians. Give answers to one decimal place. lim h→0 cos h - 1 h
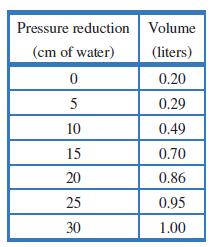
When you breathe, a muscle (called the diaphragm) reduces the pressure around your lungs and they expand to fill with air. The table shows the volume of a lung as a function of the reduction in pressure from the diaphragm. Pulmonologists (lung doctors) define the compliance of the lung as the
Using slopes to the left and right of 0, estimate R'(0) if R(x) = 100(1.1)x.
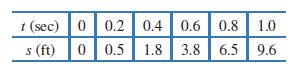
The position s of a car at time t is given in the following table.(a) Find the average velocity over the interval 0 ≤ t ≤ 0.2.(b) Find the average velocity over the interval 0.2 ≤ t ≤ 0.4.(c) Use the previous answers to estimate the instantaneous velocity of the car at t = 0.2. t (sec) 0
Let C(q) represent the total cost of producing q items. Suppose C(15) = 2300 and C'(15) = 108. Estimate the total cost of producing: (a) 16 items (b) 14 items.
Use Figure 2.47 to determine which of the two values is greater.f'(2) or f'(6)? At f(x) + x 1 2 3 4 5 6 7 8 Figure 2.47
Estimate the limit by substituting smaller and smaller values of ℎ. For trigonometric functions, use radians. Give answers to one decimal place. lim h→0 elthe h
Average leaf width, w (in mm), in tropical Australia15 is a function of the average annual rainfall, r (in mm), so w = f(r). We have f'(1500) = 0.0218.(a) What are the units of the 1500?(b) What are the units of the 0.0218?(c) About how much difference in average leaf width would you find in two
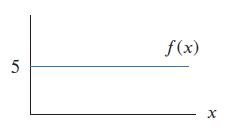
For Problem sketch the graph of f'(x). 5 f(x) X
In a time of t seconds, a particle moves a distance of s meters from its starting point, where s = 4t2 + 3.(a) Find the average velocity between t = 1 and t = 1 + ℎ if:(i) ℎ = 0.1, (ii) ℎ = 0.01, (iii) ℎ = 0.001.(b) Use your answers to part (a) to estimate the instantaneous
To produce 1000 items, the total cost is $5000 and the marginal cost is $25 per item. Estimate the costs of producing 1001 items, 999 items, and 1100 items.
Use Figure 2.47 to determine which of the two values is greater.f"(1) or f"(3)? At f(x) + x 1 2 3 4 5 6 7 8 Figure 2.47
The depth, ℎ (in mm), of the water runoff down a slope during a steady rain is a function of the distance, x (in meters), from the top of the slope,16 so ℎ = f(x). We have f'(15) = 0.02.(a) What are the units of the 15?(b) What are the units of the 0.02?(c) About how much difference in runoff
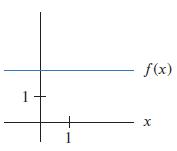
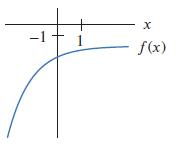
Does the function f(x) appear to be continuous on the interval 0 ≤ x ≤ 2? If not, what about on the interval 0 ≤ x ≤ 0.5? 1 f(x) 1 x 2
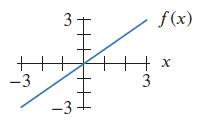
Sketch the graph of f'(x). H -3 H یرا -3 f(x) H ++ x 3
Let C(q) represent the cost and R(q) represent the revenue, in dollars, of producing q items.(a) If C(50) = 4300 and C'(50) = 24, estimate C(52).(b) If C'(50) = 24 and R'(50) = 35, approximately how much profit is earned by the 51st item?(c) If C'(100) = 38 and R'(100) = 35, should the company
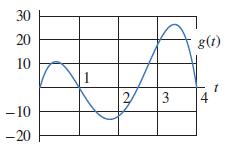
Use the graph given for each function.(a) Estimate the intervals on which the derivative is positive and the intervals on which the derivative is negative.(b) Estimate the intervals on which the second derivative is positive and the intervals on which the second derivative is negative.
When an ice dam for a glacial lake breaks, the maximal outflow rate, Q in meters3∕sec is a function of V , the volume of the lake (in millions of meters3).(a) What are the units of dQ∕dV ?(b) Observation shows that dQ∕dV |V =12 = 22. About how much is the difference in maximal outflow when
Does the function f(x) appear to be continuous on the interval 0 ≤ x ≤ 2? If not, what about on the interval 0 ≤ x ≤ 0.5? 1 f(x) 2 x
Sketch the graph of f'(x). 4 f(x) x
The distance (in feet) of an object from a point is given by s(t) = t2, where time t is in seconds.(a) What is the average velocity of the object between t = 2 and t = 5?(b) By using smaller and smaller intervals around 2, estimate the instantaneous velocity at time t = 2.
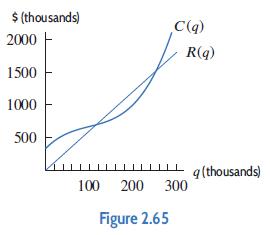
Figure 2.65 shows cost and revenue for producing q units. For the production levels in (a)–(d), is the company making or losing money? Should the company be increasing or decreasing production to increase profits?(a) q = 75 (b) q = 150(c) q = 225 (d) q = 300 $
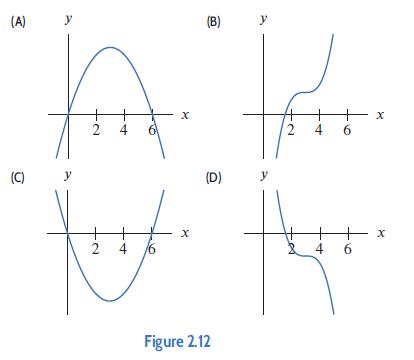
Which of the functions A, B, C, D in Figure 2.12 satisfy the given condition?f(2) > 0 (A) (C) y y +N 2 -2. + 4/6 X (B) (D) Figure 2.12 y y +N ++ 4 ए — x 6 4 6 X
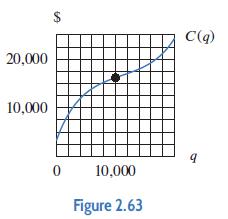
In Figure 2.63, estimate the marginal cost when the level of production is 10,000 units and interpret it. 20,000 10,000 $ 0 10,000 Figure 2.63 C(q) 9
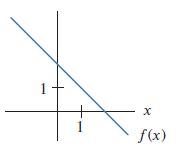
Give the signs of the first and second derivatives for the function. Each derivative is either positive everywhere, zero everywhere, or negative everywhere. 1 1 f(x) X
For the expressions in Problems(a) What is the result when we substitute ℎ = 0?(b) Find the values when we substitute ℎ = 0.1, ℎ = 0.01, ℎ = 0.001, and ℎ = 0.0001.(c) Use the results of part (b) to estimate the limit as ℎ goes to zero. In(h + 1) h
An economist is interested in how the price of a certain item affects its sales. At a price of $p, a quantity, q, of the item is sold. If q = f(p), explain the meaning of each of the following statements:(a) f(150) = 2000 (b) f'(150) = −25
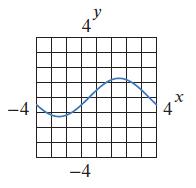
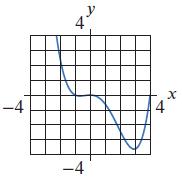
Graph the derivative of the given function. -4 T 4 Af -4 AA 4 X
Which of the functions A, B, C, D in Figure 2.12 satisfy the given condition?f'(4) < 0 (A) (C) y y +N 2 -2. + 4/6 X (B) (D) Figure 2.12 y y +N ++ 4 ए — x 6 4 6 X
For q units of a product, a manufacturer’s cost is C(q) dollars and revenue is R(q) dollars, with C(500) = 7200, R(500) = 9400, MC(500) = 15, and MR(500) = 20.(a) What is the profit or loss at q = 500?(b) If production is increased from 500 to 501 units, by approximately how much does profit
For Problems give the signs of the first and second derivatives for the function. Each derivative is either positive everywhere, zero everywhere, or negative everywhere. 1 X f(x)
For the expressions in Problems(a) What is the result when we substitute ℎ = 0?(b) Find the values when we substitute ℎ = 0.1, ℎ = 0.01, ℎ = 0.001, and ℎ = 0.0001.(c) Use the results of part (b) to estimate the limit as ℎ goes to zero. sin(3h) h (in radians)
Graph the derivative of the given function. -4 4." -4 X 4
The Arctic Sea ice extent, the area of sea covered by ice, grows over the winter months, typically from November to March. Let F(t) be the Arctic Sea ice extent, in million of square kilometers, as a function of time, t, in days since November 1, 2014. Then F'(t) = 0.073 on January 1, 2015.12(a)
Let s = f(t) give an object’s height, in feet, above the ground t seconds after it is thrown. After 2 seconds, the object’s height is 96 feet, and it is moving up at 16 ft∕sec. Fill in the blanks:(a) f(_____) = ______(b) f'(_____) = ______
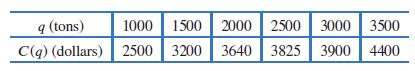
The cost of recycling q tons of paper is given in the following table. Estimate the marginal cost at q = 2000. Give units and interpret your answer in terms of cost. At approximately what production level does marginal cost appear smallest? q (tons) C(q) (dollars) 1000 1500 1500 2000 2500 3000
Give the signs of the first and second derivatives for the function. Each derivative is either positive everywhere, zero everywhere, or negative everywhere. f(x) X
Use a graph to estimate the limits in Problems lim x→0 5* − 1 X
Graph the derivative of the given function. -4 4 -4 4 x
The quantity, in gallons, of water in a tank after t minutes is w = f(t). After 20 minutes, the tank has 50 gallons of water and the quantity is increasing at 3 gal∕min.Fill in the blanks:(a) f(_____) = ______(b) f'(_____) = ______
Total cost is C = 8500 + 4.65q and total revenue is R = 5.15q, both in dollars, where q represents the quantity produced.(a) What is the fixed cost?(b) What is the marginal cost per item?(c) What is the price at which this item is sold?(d) For what production levels does this company make a
Give the signs of the first and second derivatives for the function. Each derivative is either positive everywhere, zero everywhere, or negative everywhere. -1 x f(x)
Use a graph to estimate the limits in Problems sin x lim. x-0 X (with x in radians)
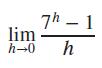
Estimate the limit by substituting smaller and smaller values of ℎ. For trigonometric functions, use radians. Give answers to one decimal place. lim h→0 7h - 1 h
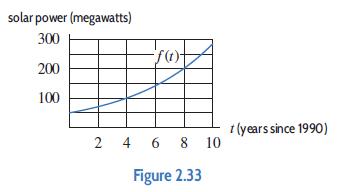
Figure 2.33 shows world solar energy output, in megawatts, as a function of years since 1990. Estimate f'(6). Give units and interpret your answer. solar power (megawatts) 300 200 100 -ƒ(1₁)+ 2 4 6 8 10 Figure 2.33 t(years since 1990)
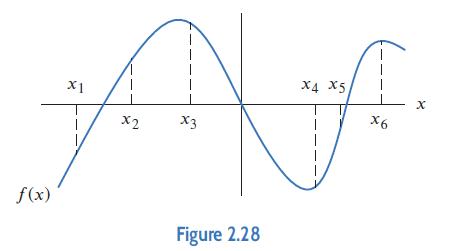
In the graph of f in Figure 2.28, at which of the labeled x-values is(a) f(x) greatest? (b) f(x) least?(c) f'(x) greatest? (d) f'(x) least? f (x) X 1 X2 A X3 Figure 2.28 X4 X5 9x X
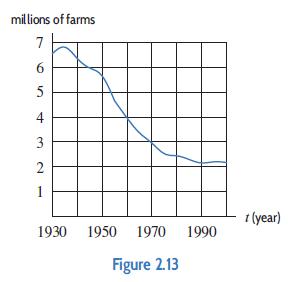
Figure 2.13 shows N = f(t), the number of farms in the US2 between 1930 and 2000 as a function of year, t.(a) Is f'(1950) positive or negative? What does this tell you about the number of farms?(b) Which is more negative: f'(1960) or f'(1980)? millions of farms 7 6 5 4 3 2 1 1930 1950 1970
When production is 4500, marginal revenue is $8 per unit and marginal cost is $9.25 per unit. Do you expect maximum profit to occur at a production level above or below 4500? Explain.
Give the signs of the first and second derivatives for the function. Each derivative is either positive everywhere, zero everywhere, or negative everywhere. 1 1 X f(x)
Estimate the limit by substituting smaller and smaller values of ℎ. For trigonometric functions, use radians. Give answers to one decimal place. lim h→0 (3 + h)³ - 27 h
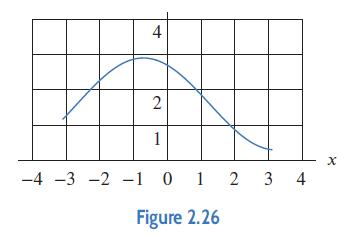
The graph of f(x) is given in Figure 2.26. Draw tangent lines to the graph at x = −2, x = −1, x = 0, and x = 2. Estimate f'(−2), f'(−1), f'(0), and f'(2). 4 2 1 -4 -3 -2 -1 0 1 2 Figure 2.26 34 X
Showing 1000 - 1100
of 5529
First
4
5
6
7
8
9
10
11
12
13
14
15
16
17
18
Last
Step by Step Answers