New Semester
Started
Get
50% OFF
Study Help!
--h --m --s
Claim Now
Question Answers
Textbooks
Find textbooks, questions and answers
Oops, something went wrong!
Change your search query and then try again
S
Books
FREE
Study Help
Expert Questions
Accounting
General Management
Mathematics
Finance
Organizational Behaviour
Law
Physics
Operating System
Management Leadership
Sociology
Programming
Marketing
Database
Computer Network
Economics
Textbooks Solutions
Accounting
Managerial Accounting
Management Leadership
Cost Accounting
Statistics
Business Law
Corporate Finance
Finance
Economics
Auditing
Tutors
Online Tutors
Find a Tutor
Hire a Tutor
Become a Tutor
AI Tutor
AI Study Planner
NEW
Sell Books
Search
Search
Sign In
Register
study help
mathematics
applied calculus
Applied Calculus 6th Edition Deborah Hughes Hallett, Patti Frazer Lock, Andrew M. Gleason, Daniel E. Flath, Sheldon P. Gordon, David O. Lomen, David Lovelock, William G. McCallum, Brad G. Osgood, Andrew Pasquale - Solutions
Find the following: (a) f(g(x)) (b) g(f(x)) (c) f(f(x))f(x) = x − 2 and g(x) = x2 + 8
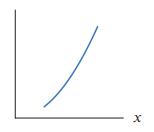
Decide whether the graph is concave up, concave down, or neither. X
Graph the function. What is the amplitude and period?y = 4 cos 2x
Solve for t using natural logarithms.5t = 7
Find k such that P = P0ekt has the given doubling time.0.4
Determine whether or not the function is a power function. If it is a power function, write it in the form y = kxp and give the values of k and p.y = 5√x
Use the description of the function to sketch a possible graph. Put a label on each axis and state whether the function is increasing or decreasing.The height of a sand dune is a function of time, and the wind erodes away the sand dune over time.
Solve for t using natural logarithms.10 = 2t
Suppose that x is the price of one brand of gasoline and y is the price of a competing brand. Then q1, the quantity of the first brand sold in a fixed time period, depends on both x and y, so q1 = f(x, y). Similarly, if q2 is the quantity of the second brand sold during the same period, q2 = g(x,
Hiking on a level trail going due east, you decide to leave the trail and climb toward the mountain on your left. The farther you go along the trail before turning off, the gentler the climb. Sketch a possible topographical map showing the elevation contours.
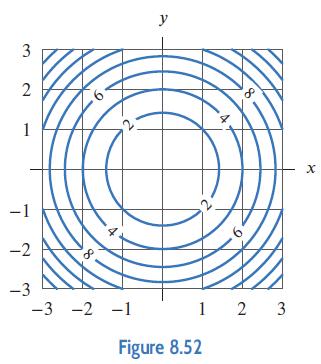
(a) Let f(x, y) = x2+y2. Estimate fx(2, 1) and fy(2, 1) using the contour diagram for f in Figure 8.52.(b) Estimate fx(2, 1) and fy(2, 1) from a table of valuesfor f with x = 1.9, 2, 2.1 and y = 0.9, 1, 1.1.(c) Compare your estimates in parts (a) and (b) with the exact values of fx(2, 1) and fy(2,
Find all the critical points and determine whether each is a local maximum, local minimum, a saddle point, or none of these.f(x, y) = x3 − 3x + y3 − 3y
A steel manufacturer can produce P(K, L) tons of steel using K units of capital and L units of labor, with production costs C(K,L) dollars. With a budget of $800,000, the maximum production is 10,000 tons, using $550,000 of capital and $150,000 of labor. The Lagrange multiplier is λ = 0.0125.(a)
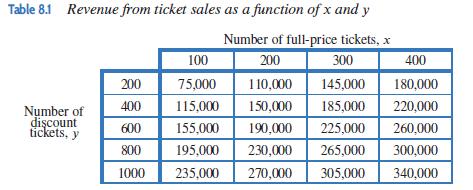
An airline’s revenue, R, is a function of the number of full-price tickets, x, and the number of discount tickets, y, sold. Values of R = f(x, y) are in Table 8.1 on page 340.(a) Evaluate f(200, 400), and interpret your answer.(b) Is fx(200, 400) positive or negative? Is fy(200, 400) positive or
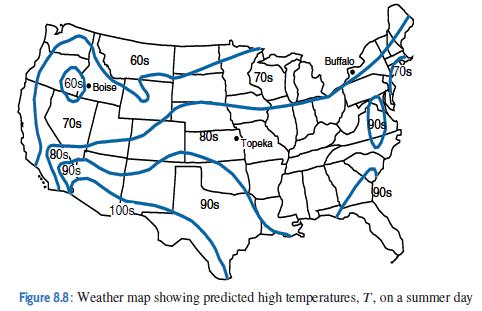
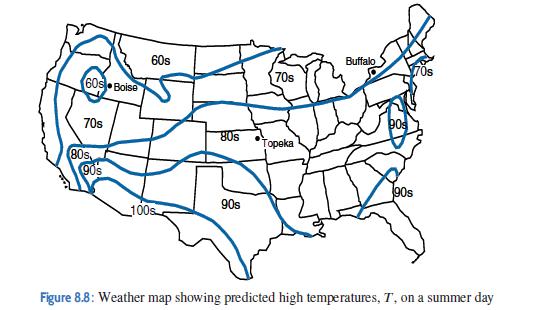
By looking at the weather map in Figure 8.8 shown below, find the maximum and minimum daily high temperatures in the states of Mississippi, Alabama, Pennsylvania, New York, California, Arizona, and Massachusetts. 60s Boise 70s 80s 90's 60s 100s 80s 90s 70s Topeka Buffalo 90s 90s Figure 8.8: Weather
A person’s body mass index (BMI) is a function of their weight W (in kg) and height H (in m) given by B(W,H) = W∕H2.For weight ω in lbs and height ℎ in inches, a persons BMI is approximated using the formula f(w, ℎ) = 703w∕ℎ2. Check this approximation by converting the formula B(W,H).
Find all the critical points and determine whether each is a local maximum, local minimum, a saddle point, or none of these.f(x, y) = 400 − 3x2 − 4x + 2xy − 5y2 + 48y
Refer to the map in Figure 8.8 shown below.Give the range of daily high temperatures for:(a) Pennsylvania (b) North Dakota(c) California 60s Boise 70s 80s 90s 60s 100s 80s 90s 70s Topeka Buffalo 90s 90s Figure 8.8: Weather map showing predicted high temperatures, T, on a summer day
The amount of money, $B, in a bank account earning interest at a continuous rate, r, depends on the amount deposited, $P, and the time, t, it has been in the bank, whereB = Pert.Find ∂B∕∂t, ∂B∕∂r and ∂B∕∂P and interpret each in financial terms.
In Problem 24 the revenue is $150,000 when 200 fullprice tickets and 400 discount tickets are sold; that is, f(200, 400) = 150,000. Use this fact and the partial derivatives fx(200, 400) = 350 and fy(200, 400) = 200 to estimate the revenue when(a) x = 201 and y = 400(b) x = 200 and y = 405(c) x =
Refer to the map in Figure 8.8 shown below.Sketch a possible graph of the predicted high temperature T on a line north-south through Topeka. 60s Boise 70s 80s 90s 60s 100s 80s 90s 70s Topeka Buffalo 90s 90s Figure 8.8: Weather map showing predicted high temperatures, T, on a summer day
Calculate all four second-order partial derivatives and confirm that the mixed partials are equal.f(x, t) = t3 − 4x2t
Give a possible contour diagram for the function f(x, y) iffx = 0, fy ≠ 0
Refer to the map in Figure 8.8 on page 346.Sketch possible graphs of the predicted high temperature on a north-south line and an east-west line through Boise. 60s Boise 70s 80s 90s 60s 100s 80s 90s 70s Topeka Buffalo 90s 90s Figure 8.8: Weather map showing predicted high temperatures, T, on a
The cost of renting a car from a certain company is $40 per day plus 15 cents per mile, and so we haveC = 40d + 0.15m.Find ∂C∕∂d and ∂C∕∂m. Give units and explain why your answers make sense.
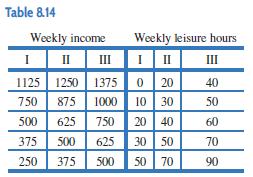
Each person tries to balance his or her time between leisure and work. The tradeoff is that as you work less your income falls. Therefore each person has in difference curves which connect the number of hours of leisure, l, and income, s. If, for example, you are indifferent between 0 hours of
For a function f(x, y), we are given f(100, 20) = 2750, and fx(100, 20) = 4, and fy(100, 20) = 7. Estimate f(105, 21).
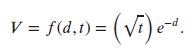
The fallout, V (in kilograms per square kilometer), from a volcanic explosion depends on the distance, d, from the volcano and the time, t, since the explosion:On the same axes, graph cross-sections of f with t = 1 and t = 2. As distance from the volcano increases, how does the fallout change? Look
A function f(x, y) has partial derivatives fx(1, 2) = 3,fy(1, 2) = 5. Explain how you know that f does not have a minimum at (1, 2).
A company’s production output, P, is given in tons, and is a function of the number of workers, N, and the value of the equipment, V, in units of $25,000. The production function for the company isP = f(N, V ) = 5N0.75V0.25.The company currently employs 80 workers, and has equipment worth
The fallout, V (in kilograms per square kilometer), from a volcanic explosion depends on the distance, d, from the volcano and the time, t, since the explosion:On the same axes, graph cross-sections of f with d = 0, d = 1, and d = 2. As time passes since the explosion, how does the fallout change?
For f(x, y) = A − (x2 + Bx + y2 + Cy), what values of A, B, and C give f a local maximum value of 15 at the point (−2, 1)?
If x1 and x2 are the number of items of two goods bought, a customer’s utility isU(x1, x2) = 2x1x2 + 3x1.The unit cost is $1 for the first good and $3 for the second. Use Lagrange multipliers to find the maximum value of U if the consumer’s disposable income is $100. Estimate the increase in
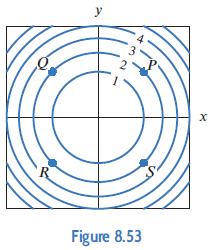
Figure 8.53 is a contour diagram of f(x, y). In each of the following cases, list the marked points in the diagram (there may be none or more than one) at which(a) fx < 0(b) fy > 0 (c) fxx > 0 (d) fyy < 0 y Figure 8.53 X
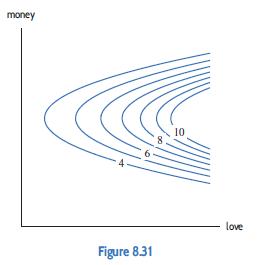
The contour diagram in Figure 8.31 shows your happiness as a function of love and money.(a) Describe in words your happiness as a function of:(i) Money, with love fixed.(ii) Love, with money fixed.(b) Graph two different cross-sections with love fixed and two different cross-sections with money
For a function f(r, s), we are given f(50, 100) = 5.67, and fr(50, 100) = 0.60, and fs(50, 100) = −0.15. Estimate f(52, 108).
A manufacturer sells two products, one at a price of $4000 a unit and the other at a price of $13,000 a unit. A quantity q1 of the first product and q2 of the second product are sold at a total cost of $(4000 + q1 + q2) to the manufacturer.(a) Express the manufacturer’s profit, π, as a function
Let f(x, y) = 3x2 +ky2 +9xy. Determine the values of k (if any) for which the critical point at (0, 0) is:(a) A saddle point(b) A local maximum(c) A local minimum
The atmospheric pressure, P = f(y, t) = (950+2t)e−y∕7, in millibars, on a weather balloon, is a function of its height y ≥ 0, in km above sea level after t hours with 0 ≤ t ≤ 48.Find f(2, 12). Give units and interpret this quantity in the context of atmospheric pressure.
Assume points P and Q are close. Estimate g(Q).P = (60, 80), Q = (60.5, 82), g(P) = 100, gx(P) = 2,gy(P) = −3.
Calculate all four second-order partial derivatives and confirm that the mixed partials are equal.f(x, y) = x2y
Let f(x, y) = x3 + ky2 − 5xy. Determine the values of k (if any) for which the critical point at (0, 0) is:(a) A saddle point(b) A local maximum(c) A local minimum
The atmospheric pressure, P = f(y, t) = (950+2t)e−y∕7, in millibars, on a weather balloon, is a function of its height y ≥ 0, in km above sea level after t hours with 0 ≤ t ≤ 48.Graph the following single-variable functions and explain the significance of the shape of the graph in terms
Assume points P and Q are close. Estimate g(Q).P = (−150, 200), Q = (−152, 203), g(P) = 2500,gx(P) = 10, gy(P) = 20.
Sketch a contour diagram for z = y − sin x. Include at least four labeled contours. Describe the contours in words and how they are spaced.
Calculate all four second-order partial derivatives and confirm that the mixed partials are equal.f(x, y) = xey
The quantity of a product demanded by consumers is a function of its price. The quantity of one product demanded may also depend on the price of other products. For example, if the only chocolate shop in town (a monopoly) sells milk and dark chocolates, the price it sets for each affects the demand
Assume points P and Q are close. Estimate g(Q).P = (5, 8),Q = (4.97, 7.99), g(P) = 12, gx(P) = −0.1,gy(P) = −0.2.
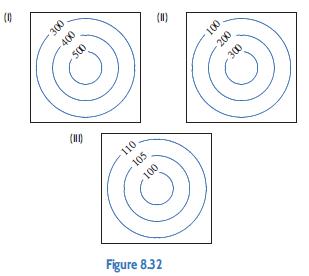
Each of the contour diagrams in Figure 8.32 shows population density in a certain region. Choose the contour diagram that best corresponds to each of the following situations. Many different matchings are possible. Pick any reasonable one and justify your choice.(a) The center of the diagram is a
Calculate all four second-order partial derivatives and confirm that the mixed partials are equal.f(x, y) = x2 + 2xy + y2
Two products are manufactured in quantities q1 and q2 and sold at prices of p1 and p2, respectively. The cost of producing them is given byC = 2q21 + 2q22 + 10.(a) Find the maximum profit that can be made, assuming the prices are fixed.(b) Find the rate of change of that maximum profit as p1
Assume points P and Q are close. Estimate g(Q).P = (30, 125), Q = (25, 135), g(P) = 840, gx(P) = 4,gy(P) = 1.5.
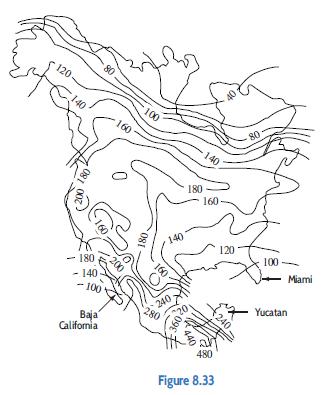
Figure 8.33 shows contours of the function giving the species density of breeding birds at each point in the US, Canada, and Mexico. Are the following statements true or false? Explain your answers.(a) Moving from south to north across Canada, the species density increases.(b) In general,
Calculate all four second-order partial derivatives and confirm that the mixed partials are equal.f(x, y) = 2x/y, y ≠ 0
A company operates two plants which manufacture the same item and whose total cost functions areC1 = 8.5 + 0.03q21 and C2 = 5.2 + 0.04q22,where q1 and q2 are the quantities produced by each plant. The company is a monopoly. The total quantity demanded, q = q1 + q2, is related to the price, p, byp =
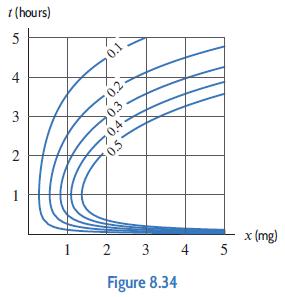
The concentration, C, of a drug in the blood is given by C = f(x, t) = xte−t, where x is the amount of drug injected (in mg) and t is the number of hours since the injection. The contour diagram of f(x, t) is given in Figure 8.34. Explain the diagram by varying one variable at a time: describe f
Calculate all four second-order partial derivatives and confirm that the mixed partials are equal.f = 5 + x2y2
Calculate all four second-order partial derivatives and confirm that the mixed partials are equal.f = exy
The cardiac output, represented by c, is the volume of blood flowing through a person’s heart per unit time. The systemic vascular resistance (SVR), represented by s, is the resistance to blood flowing through veins and arteries. Let p be a person’s blood pressure. Then p is a function of c and
Calculate all four second-order partial derivatives and confirm that the mixed partials are equal.B = 5xe−2t
In each case, give a possible contour diagram for the function f(x, y) if(a) fx > 0 and fy > 0 (b) fx > 0 and fy < 0(c) fx < 0 and fy > 0 (d) fx < 0 and fy < 0
In a small printing business, P = 2N0.6V 0.4, where N is the number of workers, V is the value of the equipment (in equipment units), and P is production, in thousands of pages per day.(a) If this company has a labor force of 300 workers and 200 units of equipment, what is production?(b) If the
Calculate all four second-order partial derivatives and confirm that the mixed partials are equal.f = 100ert
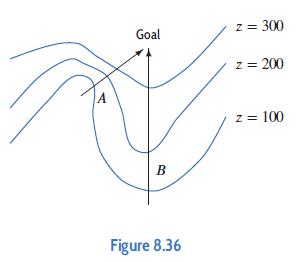
Figure 8.36 shows a contour map of a hill with two paths, A and B.(a) On which path, A or B, will you have to climb more steeply?(b) On which path, A or B, will you probably have a better view of the surrounding countryside? (Assume trees do not block your view.)(c) Alongside which path is there
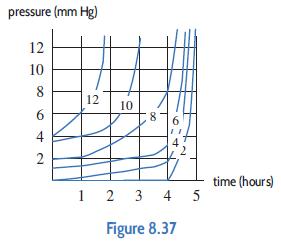
Figure 8.37 shows cardiac output (in liters per minute) in patients suffering from shock as a function of blood pressure in the central veins (in mm Hg) and the time in hours since the onset of shock.(a) In a patient with blood pressure of 4 mm Hg, what is cardiac output when the patient first goes
Give a possible contour diagram for the function f(x, y) iffy = 0, fx ≠ 0
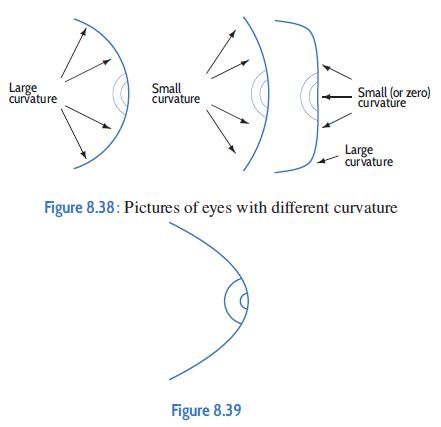
The cornea is the front surface of the eye. Corneal specialists use a TMS, or Topo graphical Modeling System, to produce a “map” of the curvature of the eye’s surface. A computer analyzes light reflected off the eye and draws level curves joining points of constant curvature. The regions
Calculate all four second-order partial derivatives and confirm that the mixed partials are equal.Q = 5p21p−12 , p2 ≠ 0
Give a possible contour diagram for the function f(x, y) iffx = 1
The power P produced by a windmill is proportional to the square of the diameter d of the windmill and to the cube of the speed v of the wind.(a) Write a formula for P as a function of d and v.(b) A windmill generates 100 kW of power at a certain wind speed. If a second windmill is built having
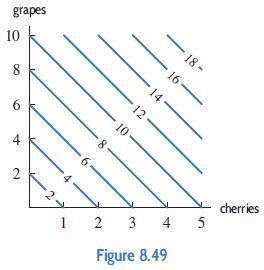
Figure 8.49 shows a contour diagram of Dan’s happiness with snacks of different numbers of cherries and grapes.(a) What is the slope of the contours?(b) What does the slope tell you? grapes 10 8 6 4 2 k ·2- 6 8 12 10 12 3 4 Figure 8.49 18- 16 14 5 cherries
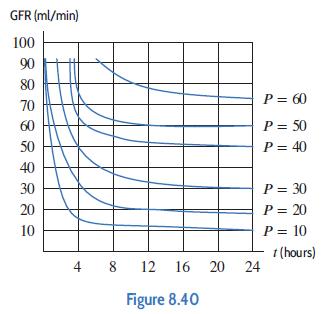
Antibiotics can be toxic in large doses. If repeated doses of an antibiotic are to be given, the rate at which the medicine is excreted through the kidneys should be monitored by a physician. One measure of kidney function is the glomerular filtration rate, or GFR, which measures the amount of
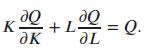
Show that the Cobb-Douglas functionQ = bKαL1−α where 0 < α < 1satisfies the equation до K дк +1001 = 0
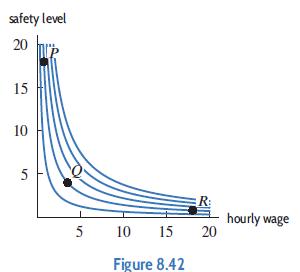
Figure 8.42 shows a contour plot of job satisfaction as a function of the hourly wage and the safety of the workplace (higher values mean safer). Match the jobs at points P, Q, and R with the three descriptions.(a) The job is so unsafe that higher pay alone would not increase my satisfaction very
Give a possible contour diagram for the function f(x, y) iffy = −2
Are about the money supply, M, which is the total value of all the cash and checking account balances in an economy. It is determined by the value of all the cash, B, the ratio, c, of cash to checking deposits, and the fraction, r, of checking account deposits that banks hold as cash:(a) Find the
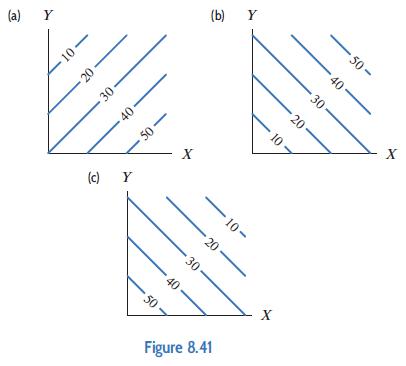
Each contour diagram (a)–(c) in Figure 8.41 shows satisfaction with quantities of two items X and Y combined. Match (a)–(c) with the items in (I)–(III).(I) X: Income; Y : Leisure time(II) X: Income; Y : Hours worked(III) X: Hours worked; Y : Time spent commuting (a) Y 10- -20- 30 40 (c)
Calculate all four second-order partial derivatives and confirm that the mixed partials are equal.V = πr2ℎ
Calculate all four second-order partial derivatives and confirm that the mixed partials are equal.P = 2KL2
Is there a function f which has the following partial derivatives? If so, what is it? Are there any others?fx(x, y) = 4x3y2 − 3y4,fy(x, y) = 2x4y − 12xy3.
Are about the money supply, M, which is the total value of all the cash and checking account balances in an economy. It is determined by the value of all the cash, B, the ratio, c, of cash to checking deposits, and the fraction, r, of checking account deposits that banks hold as cash:(a) Find the
Are about the money supply, M, which is the total value of all the cash and checking account balances in an economy. It is determined by the value of all the cash, B, the ratio, c, of cash to checking deposits, and the fraction, r, of checking account deposits that banks hold as cash:(a) Find the
The total productivity f(n, T) of an advertising agency (in ads per day) depends on the number n of workers and the temperature T of the office in degrees Fahrenheit. More workers create more ads, but the farther the temperature from 75◦F, the slower they work. Draw a possible contour diagram for
A shopper buys x units of item A and y units of item B, obtaining satisfaction s(x, y) from the purchase. (Satisfaction is called utility by economists.) The contours s(x, y) = xy = c are called indifference curves because they show pairs of purchases that give the shopper the same satisfaction.(a)
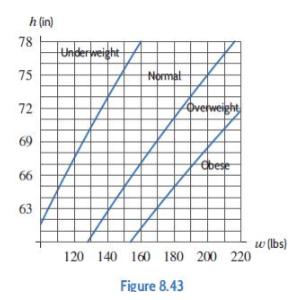
Figure 8.43 shows contours for a person’s body mass index, BMI = f(w, ℎ) = 703w∕ℎ2, where w is weight in pounds and ℎ is height in inches. Find the BMI contour values bounding the underweight and normal regions. h (in) 78 75 72 69 66 63 Underweight Normal overweight Obese 120 140 160 180
A quantity x has cumulative distribution function P(x) = x − x2∕4 for 0 ≤ x ≤ 2 and P(x) = 0 for x < 0 and P(x) = 1 for x > 2. Find the mean and median of x.
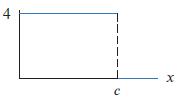
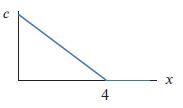
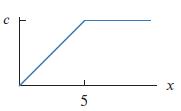
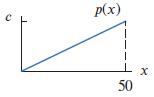
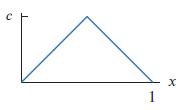
Decide if the function graphed in Problems is a probability density function (pdf) or a cumulative distribution function (cdf). Give reasons. Find the value of c. Sketch and label the other function. (That is, sketch and label the cdf if the problem shows a pdf, and the pdf if the problem shows a
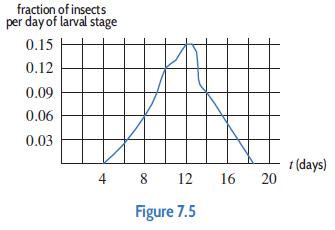
The density function p(t) for the length of the larval stage, in days, for a breed of insect is given in Figure 7.5. What fraction of these insects are in the larval stage for between 10 and 12 days? For less than 8 days? For more than 12 days? In which one-day interval is the length of a larval
Decide if the function graphed in Problems is a probability density function (pdf) or a cumulative distribution function (cdf). Give reasons. Find the value of c. Sketch and label the other function. (That is, sketch and label the cdf if the problem shows a pdf, and the pdf if the problem shows a
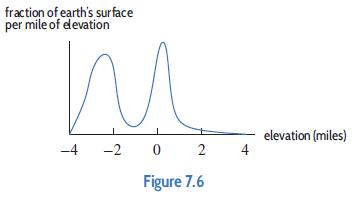
Figure 7.6 shows the distribution of elevation, in miles, across the earth’s surface. Positive elevation denotes land above sea level; negative elevation shows land below sea level (that is, the ocean floor).(a) Describe in words the elevation of most of the earth’s surface.(b) Approximately
Decide if the function graphed in Problems is a probability density function (pdf) or a cumulative distribution function (cdf). Give reasons. Find the value of c. Sketch and label the other function. (That is, sketch and label the cdf if the problem shows a pdf, and the pdf if the problem shows a
Decide if the function graphed in Problems is a probability density function (pdf) or a cumulative distribution function (cdf). Give reasons. Find the value of c. Sketch and label the other function. (That is, sketch and label the cdf if the problem shows a pdf, and the pdf if the problem shows a
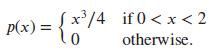
Suppose that x measures the time (in hours) it takes for a student to complete an exam. All students are done within two hours and the density function for x is(a) What proportion of students take between 1.5 and 2.0 hours to finish the exam?(b) What is the mean time for students to complete the
Calculate the value of c if p is a density function. c p(x) 50 X
Let p(t) = −0.0375t2 +0.225t be the density function for the shelf life of a brand of banana which lasts up to 4 weeks. Time, t, is measured in weeks and 0 ≤ t ≤ 4.Find the median shelf life of a banana using p(t). Plot the median on a graph of p(t). Does it look like half the area is to the
Let p(t) = −0.0375t2 +0.225t be the density function for the shelf life of a brand of banana which lasts up to 4 weeks. Time, t, is measured in weeks and 0 ≤ t ≤ 4.Find the mean shelf life of a banana using p(t). Plot the mean on a graph of p(t). Does it look like the mean is the place where
Decide if the function graphed in Problems is a probability density function (pdf) or a cumulative distribution function (cdf). Give reasons. Find the value of c. Sketch and label the other function. (That is, sketch and label the cdf if the problem shows a pdf, and the pdf if the problem shows a
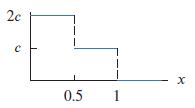
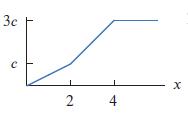
Decide if the function graphed in Problems is a probability density function (pdf) or a cumulative distribution function (cdf). Give reasons. Find the value of c. Sketch and label the other function. 3c с 2 4 X
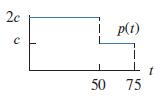
Calculate the value of c if p is a density function. 2c C ip(1) 50 75 t
The density function for heights of American men, in inches is p(x). What is the meaning of the statement p(68) = 0.2?
Showing 1700 - 1800
of 5529
First
11
12
13
14
15
16
17
18
19
20
21
22
23
24
25
Last
Step by Step Answers