New Semester
Started
Get
50% OFF
Study Help!
--h --m --s
Claim Now
Question Answers
Textbooks
Find textbooks, questions and answers
Oops, something went wrong!
Change your search query and then try again
S
Books
FREE
Study Help
Expert Questions
Accounting
General Management
Mathematics
Finance
Organizational Behaviour
Law
Physics
Operating System
Management Leadership
Sociology
Programming
Marketing
Database
Computer Network
Economics
Textbooks Solutions
Accounting
Managerial Accounting
Management Leadership
Cost Accounting
Statistics
Business Law
Corporate Finance
Finance
Economics
Auditing
Tutors
Online Tutors
Find a Tutor
Hire a Tutor
Become a Tutor
AI Tutor
AI Study Planner
NEW
Sell Books
Search
Search
Sign In
Register
study help
mathematics
applied calculus
Applied Calculus 6th Edition Deborah Hughes Hallett, Patti Frazer Lock, Andrew M. Gleason, Daniel E. Flath, Sheldon P. Gordon, David O. Lomen, David Lovelock, William G. McCallum, Brad G. Osgood, Andrew Pasquale - Solutions
Let y be the percent increase in annual US national production during a year when the unemployment rate changes by u percent. (For example, u = 2 if unemployment increases from 4% to 6%.) Okun’s law states thaty = 3.5 − 2u.(a) What is the meaning of the number 3.5 in Okun’s law?(b) What is
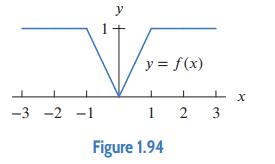
Use Figure 1.94 to graph the function.y = −2f(x − 1) -3 -2 -1 y y = f(x) 12 Figure 1.94 LX 3
Find the future value in 15 years of a $20,000 payment today, if the interest rate is 3.8% per year compounded continuously.
A tax of $8 per unit is imposed on the supplier of an item. The original supply curve is q = 0.5p − 25 and the demand curve is q = 165 − 0.5p, where p is price in dollars. Find the equilibrium price and quantity before and after the tax is imposed.
The population, P, in millions, of Nicaragua was 5.97 million in 2016 and growing at an annual rate of 0.99%. Let t be time in years since 2016. (a) Express P as a function in the form P = P0at.(b) Express P as an exponential function using base e. (c) Compare the annual and continuous
Use Figure 1.94 to graph the function.y = −f(x) + 3 -3 -2 -1 y y = f(x) 12 Figure 1.94 LX 3
A supply curve has equation q = 4p − 20, where p is price in dollars. A $2 tax is imposed on suppliers. Find the equation of the new supply curve. Sketch both curves.
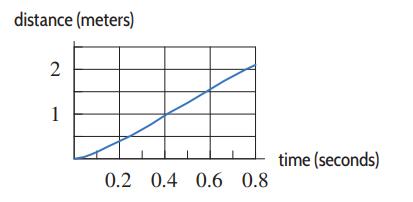
In an experiment, a lizard is encouraged to run as fast as possible. Figure 1.47 shows the distance run in meters as a function of the time in seconds.(a) If the lizard were running faster and faster, what would be the concavity of the graph? Does this match what you see? (b) Estimate the
A city’s population is 1000 and growing at 5% a year. (a) Find a formula for the population at time t years from now assuming that the 5% per year is an: (i) Annual rate (ii) Continuous annual rate (b) In each case in part (a), estimate the population of the city in 10 years.
Ask you to plot graphs based on the following story: “As I drove down the highway this morning, at first traffic was fast and uncongested, then it crept nearly bumper to-bumper until we passed an accident, after which traffic flow went back to normal until I exited.”Distance between cars vs
Whooping cough was thought to have been almost wiped out by vaccinations. It is now known that the vaccination wears off, leading to an increase in the number of cases, ω, from 1248 in 1981 to 25,827 in 2004.(a) With t in years since 1980, find an exponential function that fits this data.(b) What
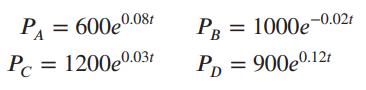
The following formulas give the populations of four different towns, A, B, C, and D, with t in years from now.(a) Which town is growing fastest (that is, has the largest percentage growth rate)?(b) Which town is the largest now?(c) Are any of the towns decreasing in size? If so, which one(s)? P₁
Let f(t) be the number of US billionaires in year t.(a) Express the following statements in terms of f. (i) In 2001 there were 272 US billionaires. (ii) In 2014 there were 525 US billionaires. (b) Find the average yearly increase in the number of US billionaires from 2001 to 2014.
Ask you to plot graphs based on the following story: “As I drove down the highway this morning, at first traffic was fast and uncongested, then it crept nearly bumper to-bumper until we passed an accident, after which traffic flow went back to normal until I exited.”Distance driven against time
Use Figure 1.94 to graph the function.y = f(x − 2) -3 -2 -1 y y = f(x) 12 Figure 1.94 LX 3
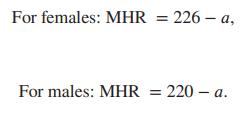
Concern the maximum heart rate (MHR), which is the maximum number of times a person’s heart can safely beat in one minute. If MHR is in beats per minute and a is age in years, the formulas used to estimate MHR areWhat can be said about the ages of a male and a female with the same maximum heart
Tiny marine organisms reproduce at different rates. Phytoplankton doubles in population twice a day, but foraminifera doubles every five days. If the two populations are initially the same size and grow exponentially, how long does it take for (a) The phytoplankton population to be double the
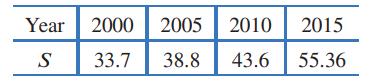
Table 1.22 gives the sales, S, of Intel Corporation, a leading manufacturer of integrated circuits.(a) Find the change in sales between 2000 and 2015. (b) Find the average rate of change in sales between 2000 and 2015. Give units and interpret your answer.Table 1.22 Intel sales, in billions of
(a) Niki invested $10,000 in the stock market. The investment was a loser, declining in value 10% per year each year for 10 years. How much was the investment worth after 10 years?(b) After 10 years, the stock began to gain value at 10% per year. After how long will the investment regain its
What continuous percent growth rate is equivalent to an annual percent growth rate of 10%?
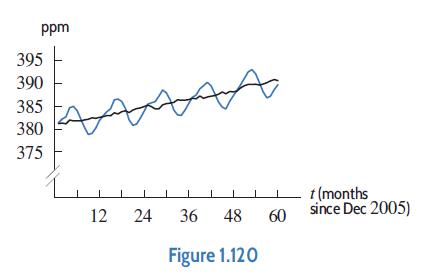
In Figure 1.120, the blue curve shows monthly mean carbon dioxide (CO2) concentration, in parts per million (ppm) at Mauna Loa Observatory, Hawaii, as a function of t, in months, since December 2005. The black curve shows the monthly mean concentration adjusted for seasonal CO2 variation.(a)
What annual percent growth rate is equivalent to a continuous percent growth rate of 8%?
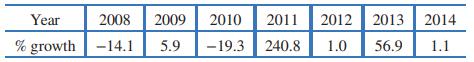
Concern biodiesel, a fuel derived from renewable resources such as food crops, algae, and animal oils. The table shows the percent growth over the previous year in US biodiesel consumption.(a) True or false: The annual US consumption of biodiesel grew exponentially from 2008 to 2010. Justify your
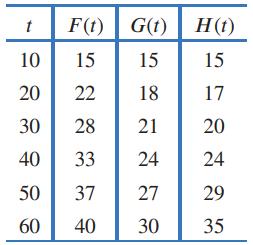
Values of F(t), G(t), and H(t) are in Table 1.23. Which graph is concave up and which is concave down? Which function is linear?Table 1.23 t F(t) G(t) H(t) 10 15 20 22 30 28 40 33 50 37 60 40 15 18 21 24 27 512126 17 20 24 29 30 35
Concern the maximum heart rate (MHR), which is the maximum number of times a person’s heart can safely beat in one minute. If MHR is in beats per minute and a is age in years, the formulas used to estimate MHR areExperiments suggest that the male MHR decreases by 9 beats per minute by age 21, and
Find the future value in 8 years of a $10,000 payment today, if the interest rate is 3% per year compounded continuously.
Use Figure 1.94 to graph the function.y = f(x + 1) − 2 -3 -2 -1 y y = f(x) 12 Figure 1.94 LX 3
Concern the maximum heart rate (MHR), which is the maximum number of times a person’s heart can safely beat in one minute. If MHR is in beats per minute and a is age in years, the formulas used to estimate MHR areExperiments suggest that the female MHR decreases by 12 beats per minute by age 21,
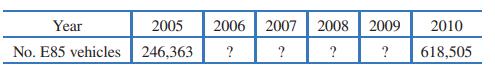
The number of alternative fuel vehicles108 running on E85, a fuel that is up to 85% plant-derived ethanol, increased exponentially in the US between 2005 and 2010. (a) Use this information to complete the missing table values. (b) How many E85-powered vehicles were there in the US in
A demand curve has equation q = 100 − 5p, where p is price in dollars. A $2 tax is imposed on consumers. Find the equation of the new demand curve. Sketch both curves.
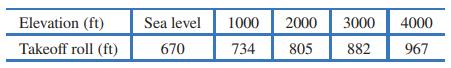
Aircraft require longer takeoff distances, called takeoff rolls, at high-altitude airports because of diminished air density. The table shows how the takeoff roll for a certain light airplane depends on the airport elevation. (Takeoff rolls are also strongly influenced by air temperature; the data
A 2008 study of 300 oil fields producing a total of 84 million barrels per day reported that daily production was decaying at a continuous rate of 9.1% per year. Find the estimated production in these fields in 2025 if the decay continues at the same rate.
Ask you to plot graphs based on the following story: “As I drove down the highway this morning, at first traffic was fast and uncongested, then it crept nearly bumper to-bumper until we passed an accident, after which traffic flow went back to normal until I exited.”Distance from my exit vs
Use Figure 1.94 to graph the function.y = 3f(x) -3 -2 -1 y y = f(x) 12 Figure 1.94 LX 3
Concern the maximum heart rate (MHR), which is the maximum number of times a person’s heart can safely beat in one minute. If MHR is in beats per minute and a is age in years, the formulas used to estimate MHR areRecently it has been suggested that a more accurate predictor of MHR for both males
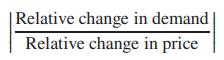
The demand for a product is given by p = 90 − 10q. Find the ratioif the price changes from p = 50 to p = 51. Interpret this ratio. Relative change in demand | Relative change in price
The world population was 6.9 billion at the end of 2010 and is predicted to reach 9 billion by the end of 2050.(a) Assuming the population is growing exponentially, what is the continuous growth rate per year? (b) The United Nations celebrated the “Day of 6 Billion” on October 12, 1999,
The 2004 US presidential debates questioned whether the minimum wage has kept pace with inflation. Decide the question using the following information: In 1938, the minimum wage was 25c/; in 2004, it was $5.15. During the same period, inflation averaged 4.3%.
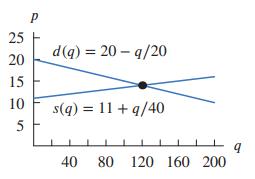
A bakery owner knows that customers buy a total of q cakes when the price, p, is no more than p = d(q) = 20 − q∕20 dollars. She is willing to make and supply as many as q cakes at a price of p = s(q) = 11 + q∕40 dollars each. The graphs of d(q) and s(q) are in Figure 1.65.(a) Why, in terms of
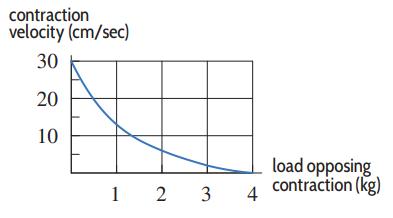
Refer to Figure 1.45, which shows the contraction velocity of a muscle as a function of the load it pulls against.(a) Find the change in muscle contraction velocity when the load changes from 1 kg to 3 kg. Give units. (b) Find the average rate of change in the contraction velocity between 1 kg
Refer to Figure 1.45, which shows the contraction velocity of a muscle as a function of the load it pulls against.In terms of the muscle, interpret the (a) Vertical intercept (b) Horizontal intercept contraction velocity (cm/sec) 30 20 10 1 2 3 4 load opposing contraction (kg)
(a) What is the annual percent decay rate for P = 25(0.88)t, with time, t, in years?(b) Write this function in the form P = P0ekt. What is the continuous percent decay rate?
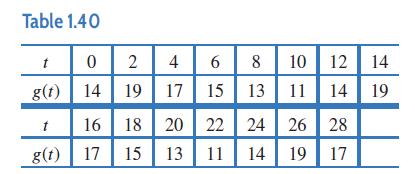
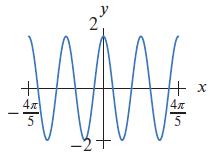
Table 1.40 gives values for g(t), a periodic function.(a) Estimate the period and amplitude for this function.(b) Estimate g(34) and g(60). Table 1.40 02 4 6 8 10 11 t g(t) 14 19 17 t 16 g(t) 17 17 18 20 20 15 13 15 13 13 12 14 14 19 22 24 26 28 11 14 19 17
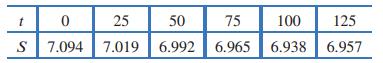
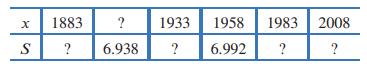
Table 1.2 shows the average annual sea level, S, in meters, in Aberdeen, Scotland, as a function of time, t, measured in years before 2008.Table 1.2(a) What was the average sea level in Aberdeen in 2008?(b) In what year was the average sea level 7.019 meters? 6.957 meters? (c) Table 1.3 gives
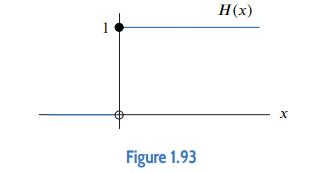
The Heaviside step function, H, is graphed in Figure 1.93. Graph the following functions.(a) 2H(x) (b) H(x) + 1 (c) H(x + 1) (d) −H(x) (e) H(−x) 1 Figure 1.93 H(x) X
Concern the maximum heart rate (MHR), which is the maximum number of times a person’s heart can safely beat in one minute. If MHR is in beats per minute and a is age in years, the formulas used to estimate MHR areWhich of the following is the correct statement? (a) As you age, your maximum
Food bank usage in Britain has grown dramatically over the past decade. The number of users, in thousands, of the largest food bank in year t is estimated to be N(t) = 1.3e0.81t , where t is the number of years since 2006.105 (a) What does the 1.3 represent in this context? Give
You have a budget of $2000 for the year to cover your books and social outings. Books cost (on average) $80 each and social outings cost (on average) $20 each. Let b denote the number of books purchased per year and s denote the number of social outings in a year.(a) What is the equation of your
The population of the world reached 1 billion in 1804, 2 billion in 1927, 3 billion in 1960, 4 billion in 1974, 5 billion in 1987 and 6 billion in 1999. Find the average rate of change of the population of the world, in people per minute, during each of these intervals (that is, from 1804 to 1927,
The desert temperature, H, oscillates daily between 40◦F at 5 am and 80◦F at 5 pm. Write a possible formula for H in terms of t, measured in hours from 5 am.
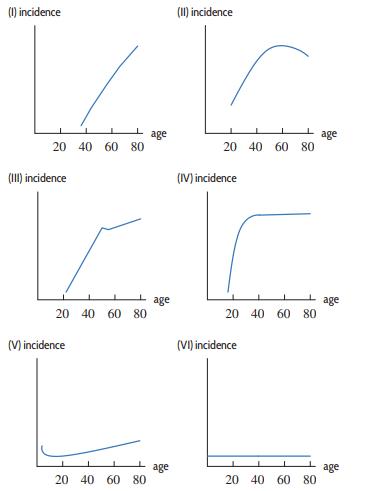
The six graphs in Figure 1.16 show frequently observed patterns of age-specific cancer incidence rates, in number of cases per 1000 people, as a function of age. The scales on the vertical axes are equal.(a) For each of the six graphs, write a sentence explaining the effect of age on the cancer
(a) What is the continuous percent growth rate for P = 100e0.06t, with time, t, in years?(b) Write this function in the form P = P0at. What is the annual percent growth rate?
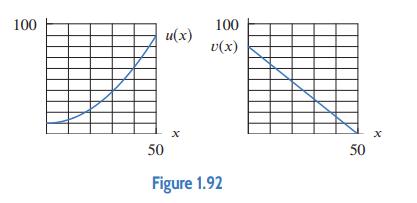
Use Figure 1.92 to estimate the function value or explain why it cannot be done.v(u(40)) 100 50 u(x) x 100 v(x) Figure 1.92 50 x
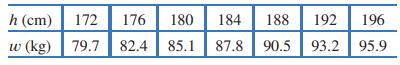
Table 1.8 gives the required standard weight, ω, in kilograms, of American soldiers, aged between 21 and 27, for height, ℎ, in centimeters.(a) How do you know that the data in this table could represent a linear function? (b) Find weight, ω, as a linear function of height, ℎ. What is the
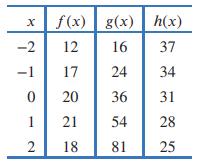
(a) Which (if any) of the functions in the following table could be linear? Find formulas for those functions.(b) Which (if any) of these functions could be exponential? Find formulas for those functions. x -2 -1 0 1 2 f(x) g(x) h(x) 12 16 37 17 24 34 20 36 31 21 54 28 18 81 25
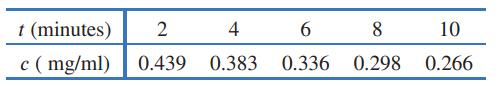
Table 1.21 shows the concentration, 푐, of creatinine in the bloodstream of a dog. (a) Including units, find the average rate at which the concentration is changing between the(i) 6th and 8th minutes.(ii) 8th and 10th minutes. (b) Explain the sign and relative magnitudes of your results
A company has a total budget of $500,000 and spends this budget on raw materials and personnel. The company uses m units of raw materials, at a cost of $100 per unit, and hires r employees, at a cost of $25,000 each.(a) What is the equation of the company’s budget constraint?(b) Solve for m as a
The depth of water in a tank oscillates once every 6 hours. If the smallest depth is 5.5 feet and the largest depth is 8.5 feet, find a possible formula for the depth in terms of time in hours.
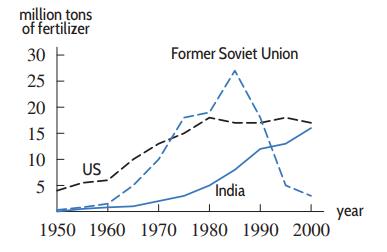
Figure 1.15 shows fifty years of fertilizer use in the US, India, and the former Soviet Union.(a) Estimate fertilizer use in 1970 in the US, India, and the former Soviet Union.(b) Write a sentence for each of the three graphs describing how fertilizer use has changed in each region over this
In Problems a quantity P is an exponential function of time t. Use the given information about the function P = P0ekt to:(a) Find values for the parameters k and P0.(b) State the initial quantity and the continuous percent rate of growth or decay.P = 40 when t = 4 and P = 50 when t = 3
Use Figure 1.92 to estimate the function value or explain why it cannot be done. v(u(10)) 100 50 u(x) x 100 v(x) Figure 1.92 50 x
In 2015, the world’s population was 7.32 billion, and the population is projected to reach approximately 8 billion by the year 2023. What annual growth rate is projected?
Worldwide, wind energy generating capacity, W, was 236,733 megawatts at the end of 2011 and 371,374 megawatts at the end of 2014. (Generating capacity is the maximum rate at which energy can be produced, measured in this problem in megawatts.)(a) Use the values given to write W, in megawatts, as a
Find a possible formula for the graph. + +x
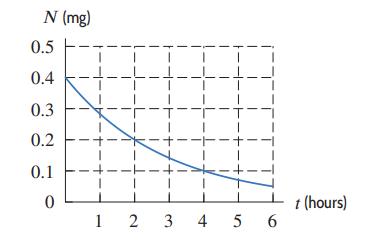
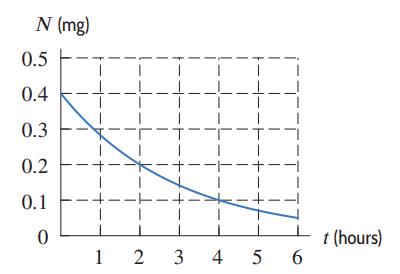
Figure 1.11 shows the amount of nicotine, N = f(t), in mg, in a person’s bloodstream as a function of the time, t, in hours, since the person finished smoking a cigarette. (a) Estimate f(3) and interpret it in terms of nicotine. (b) About how many hours have passed before the nicotine
Write the functions in Problems in the form P = P0at. Which represent exponential growth and which represent exponential decay?P = 15e0.25t
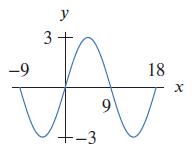
Find a possible formula for the graph. y 3- -9 tA 9 -3 18 X
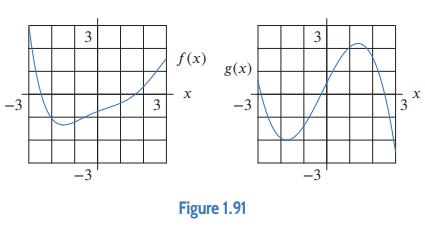
Use the graphs in Figure 1.91. Estimate f(f(1)). -3 3 دیا -3 T 3 نرا f(x) x g(x) -3 Figure 1.91 3 نیا -3 3 X
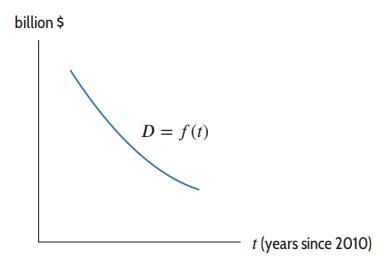
When the US Federal government spends more money than it takes in, the amount of the difference is called the deficit. In Figure 1.13, the function D = f(t) gives a good approximation of the deficit from 2011 to 2015, where D is the deficit in billions of dollars and t is the number of years since
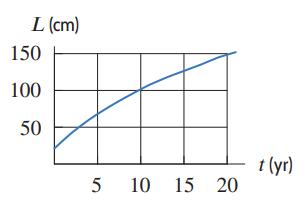
Figure 1.43 shows the length, L, in cm, of a sturgeon (a type of fish) as a function of the time, t, in years.(a) Is the function increasing or decreasing? Is the graph concave up or concave down? (b) Estimate the average rate of growth of the sturgeon between t = 5 and t = 15. Give units and
An exponentially growing animal population numbers 500 at time t = 0; two years later, it is 1500. Find a formula for the size of the population in t years and find the size of the population at t = 5.
Write the functions in Problems in the form P = P0at. Which represent exponential growth and which represent exponential decay?P = 7e−πt
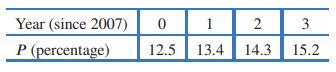
The approximate percentage of people, P, below the poverty level in the US is given in Table 1.6. (a) Find a formula for the percentage in poverty as a linear function of time in years since 2007. (b) Use the formula to predict the percentage in poverty in 2013. (c) What is the
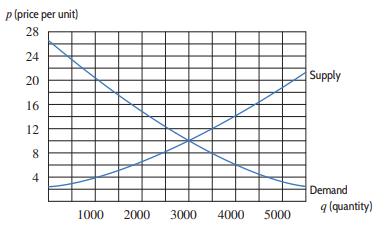
Figure 1.64 shows supply and demand for a product.(a) What is the equilibrium price for this product? At this price, what quantity is produced?(b) Choose a price above the equilibrium price—for example, p = 12. At this price, how many items are suppliers willing to produce? How many items do
A quantity P is an exponential function of time t. Use the given information about the function P = P0at to:(a) Find values for the parameters a and P0. (b) State the initial quantity and the percent rate of growth or decay.P = 1600 when t = 3 and P = 1000 when t = 1
The infrastructure needs of a region (for example, the number of miles of electrical cable, the number of miles of roads, the number of gas stations) depend on its population. Cities enjoy economies of scale. For example, the number of gas stations is proportional to the population raised to the
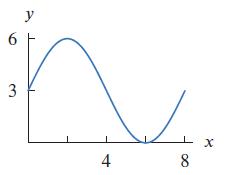
Find a possible formula for the graph. 6 3 y 4 8 X
Use the graphs in Figure 1.91. Estimate g(f(2)). -3 3 دیا -3 T 3 نرا f(x) x g(x) -3 Figure 1.91 3 نیا -3 3 X
The use of CFCs (chlorofluorocarbons) has declined since the 1987 Montreal Protocol came into force to reduce the use of substances that deplete the ozone layer. World annual CFC consumption, C = f(t), in million tons, is a function of time, t, in years since 1987. (CFCs are measured by the weight
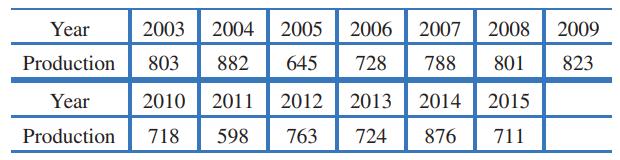
Table 1.18 shows the production of tobacco in the US.(a) What is the average rate of change in tobacco production between 2003 and 2015? Give units and interpret your answer in terms of tobacco production. (b) During this twelve-year period, are there any one-year intervals during which the
Write the functions in Problems in the form P = P0at. Which represent exponential growth and which represent exponential decay?P = P0e0.2t
On March 5, 2015, Capracotta, Italy, received 256 cm (100.787 inches) of snow in 18 hours.(a) Assuming the snow fell at a constant rate and there were already 100 cm of snow on the ground, find a formula for f(t), in cm, for the depth of snow as a function of t hours since the snowfall began on
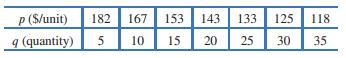
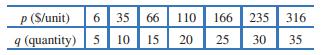
One of Tables 1.28 and 1.29 represents a supply curve; the other represents a demand curve.(a) Which table represents which curve? Why?(b) At a price of $155, approximately how many items would consumers purchase?(c) At a price of $155, approximately how many items would manufacturers supply?(d)
A quantity P is an exponential function of time t. Use the given information about the function P = P0at to:(a) Find values for the parameters a and P0. (b) State the initial quantity and the percent rate of growth or decay.P = 320 when t = 5 and P = 500 when t = 3
Zipf’s Law, developed by George Zipf in 1949, states that in a given country, the population of a city is inversely proportional to the city’s rank by size in the country. Assuming Zipf’s Law:(a) Write a formula for the population, P, of a city as a function of its rank, R.(b) If the constant
Use the graphs in Figure 1.91. Estimate f(g(1)). -3 3 دیا -3 T 3 نرا f(x) x g(x) -3 Figure 1.91 3 نیا -3 3 X
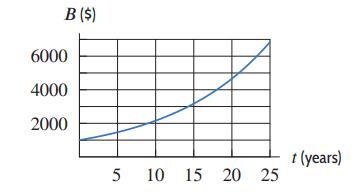
A deposit is made into an interest-bearing account. Figure 1.12 shows the balance, B, in the account t years later. (a) What was the original deposit? (b) Estimate f(10) and interpret it. (c) When does the balance reach $5000?Figure 1.12 B ($) 6000 4000 2000 5 10 15 20 25 t (years)
The number of people living with HIV increased worldwide approximately exponentially from 2.5 million in 1985 to 36.7 million in 2015. (HIV is the virus that causes AIDS.)(a) Give a formula for the number of people living with HIV, H (in millions), as a function of years, t, since 1985. Use the
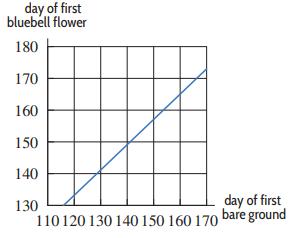
In Colorado spring has arrived when the bluebell first flowers. Figure 1.29 shows the date (days after Jan 1) that the first flower is sighted in one location as a function of the first date (days after Jan 1) of bare (snowfree) ground. (a) If the first date of bare ground is 140, how many
Do you expect the average rate of change (in units per year) of each of the following to be positive or negative? Explain your reasoning.(a) Number of acres of rain forest in the world. (b) Population of the world. (c) Number of polio cases each year in the US, since 1950. (d) Height
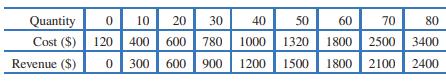
The table shows the cost of manufacturing various quantities of an item and the revenue obtained from their sale.(a) What range of production levels appears to be profitable?(b) Calculate the profit or loss for each of the quantities shown. Estimate the most profitable production level.
A quantity P is an exponential function of time t. Use the given information about the function P = P0at to:(a) Find values for the parameters a and P0. (b) State the initial quantity and the percent rate of growth or decay.P0a4 = 18 and P0a3 = 20
The circulation time of a mammal (that is, the average time it takes for all the blood in the body to circulate once and return to the heart) is proportional to the fourth root of the body mass of the mammal.(a) Write a formula for the circulation time, T, in terms of the body mass, B.(b) If an
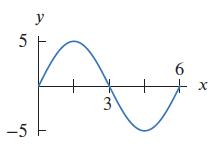
Find a possible formula for the graph. 5 -5 y 3 6 X
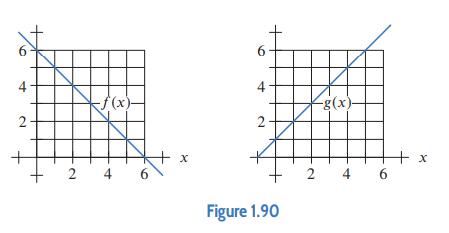
Use the graphs in Figure 1.90.Estimate g(g(2)). 2 2 -f(x)- 4 6 X 4 2 Figure 1.90 2 -g(x)- 4 6 + x
The number of species of coastal dune plants in Australia decreases as the latitude, in ◦S, increases. There are 34 species at 11◦S and 26 species at 44◦S.(a) Find a formula for the number, N, of species of coastal dune plants in Australia as a linear function of the latitude, t, in
A taxi company has an annual budget of $720,000 to spend on drivers and car replacement. Drivers cost the company $30,000 each and car replacements cost $20,000 each.(a) What is the company’s budget constraint equation? Let d be the number of drivers paid and c be the number of cars replaced.(b)
Figure 1.44 shows the amount of nicotine N = f(t), in mg, in a person’s bloodstream as a function of the time, t, in hours, since the last cigarette.(a) Is the average rate of change in nicotine level positive or negative? Explain. (b) Find the average rate of change in the nicotine level
The Bay of Fundy in Canada has the largest tides in the world. The difference between low and high water levels is 15 meters (nearly 50 feet). At a particular point the depth of the water, y meters, is given as a function of time, t, in hours since midnight by(a) What is the physical meaning of
A quantity P is an exponential function of time t. Use the given information about the function P = P0ekt to:(a) Find values for the parameters k and P0.(b) State the initial quantity and the continuous percent rate of growth or decay.P = 140 when t = 3 and P = 100 when t = 1
Showing 1200 - 1300
of 5529
First
6
7
8
9
10
11
12
13
14
15
16
17
18
19
20
Last
Step by Step Answers