New Semester
Started
Get
50% OFF
Study Help!
--h --m --s
Claim Now
Question Answers
Textbooks
Find textbooks, questions and answers
Oops, something went wrong!
Change your search query and then try again
S
Books
FREE
Study Help
Expert Questions
Accounting
General Management
Mathematics
Finance
Organizational Behaviour
Law
Physics
Operating System
Management Leadership
Sociology
Programming
Marketing
Database
Computer Network
Economics
Textbooks Solutions
Accounting
Managerial Accounting
Management Leadership
Cost Accounting
Statistics
Business Law
Corporate Finance
Finance
Economics
Auditing
Tutors
Online Tutors
Find a Tutor
Hire a Tutor
Become a Tutor
AI Tutor
AI Study Planner
NEW
Sell Books
Search
Search
Sign In
Register
study help
mathematics
calculus with applications
Calculus With Applications 10th Edition Margaret L Lial, Raymond N Greenwell, Nathan P Ritchey - Solutions
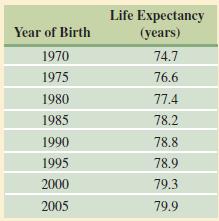
The following table gives the life expectancy at birth of females born in the United States in various years from 1970 to 2005.1. Find an equation for the least squares line for these data, using year of birth as the independent variable.2. Use your regression equation to guess a value for the life
In Exercises 15–24, find an equation in slope-intercept form for each line.Through (1, 3), m = –2
In Exercises 15–24, find an equation in slope-intercept form for each line.Through (2, 4), m = –1
In Exercises 15–24, find an equation in slope-intercept form for each line.Through (–5, –7), m = 0
In Exercises 15–24, find an equation in slope-intercept form for each line.Through (4, 2) and (1, 3)
In Exercises 15–24, find an equation in slope-intercept form for each line.Through (8, –1) and (4, 3)
In Exercises 15–24, find an equation in slope-intercept form for each line.Through (2/3, 1/2) and (1/4, –2)
In Exercises 15–24, find an equation in slope-intercept form for each line.Through (–2, 3/4) and (2/3, 5/2)
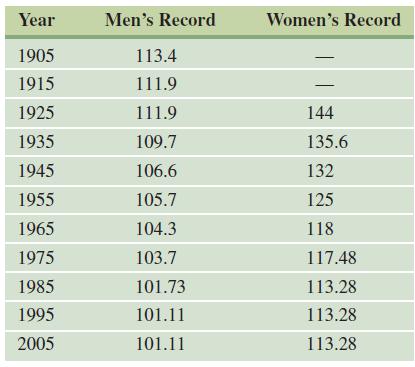
The table shows the men’s and women’s outdoor world records (in seconds) in the 800-m run.Let x be the year, with x = 0 corresponding to 1900.a. Find the equation for the least squares line for the men’s record (y) in terms of the year (x).b. Find the equation for the least squares line for
In Exercises 15–24, find an equation in slope-intercept form for each line.Through (–8, 4) and (–8, 6)
In Exercises 15–24, find an equation in slope-intercept form for each line.Through (–1, 3) and (0, 3)
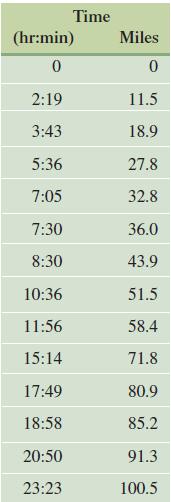
If you think a marathon is a long race, consider the Hardrock 100, a 100.5 mile running race held in southwestern Colorado. The chart at right lists the times that the 2008 winner, Kyle Skaggs, arrived at various mileage points along the way.a. What was Skagg's average speed?b. Graph the data,
The supply and demand for crabmeat in a local fish store are related by the equationsandwhere p represents the price in dollars per pound and q represents the quantity of crabmeat in pounds per day. Find the quantity supplied and demanded at each of the following prices.a. $10 b. $15c. $18d.
Graph each equation.y = x – 1
Graph each equation.y = 4x + 5
Graph each equation.y = –4x + 9
For a new diet pill, 60 pills will be supplied at a price of $40, while 100 pills will be supplied at a price of $60. Write linear supply function for this product.
Find the equilibrium price and quantity for the diet pills in Exercises 47 and 48.Data from Exercise 48.The demand for the diet pills in Exercise 47 is 50 pills at a price of $47.50 and 80 pills at a price of $32.50. Determine a linear demand function for these pills.Data from Exercises 47.For a
The demand for the diet pills in Exercise 47 is 50 pills at a price of $47.50 and 80 pills at a price of $32.50. Determine a linear demand function for these pills.Data from Exercises 47.For a new diet pill, 60 pills will be supplied at a price of $40, while 100 pills will be supplied at a price of
Graph each equation.3x – y = –9
Graph each equation.y = –2
Graph each equation.x = 4
Graph each equation.x + 5 = 0
Graph each equation.y + 8 = 0
The United States is China’s largest export market. Imports from China have grown from about 102 billion dollars in 2001 to 338 billion dollars in 2008. This growth has been approximately linear. Use the given data pairs to write a linear equation that describes this growth in imports over the
U.S. exports to China have grown (although at a slower rate than imports) since 2001. In 2001, about 19.1 billion dollars of goods were exported to China. By 2008, this amount had grown to 69.7 billion dollars. Write a linear equation describing the number of exports each year, with t = 1
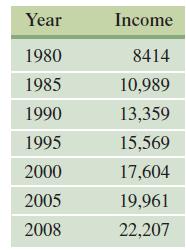
The U.S. Census Bureau reported that the median income for all U.S. households in 2008 was $50,303. In 1988, the median income (in 2008 dollars) was $47,614. The median income is approximately linear and is a function of time. Find a formula for the median income, I, as a function of the year t,
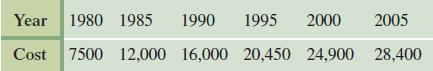
The average new car cost (in dollars) for selected years from 1980 to 2005 is given in the table.a. Find a linear equation for the average new car cost in terms of , the number of years since 1980, using the data for 1980 and 2005.b. Repeat part a, using the data for 1995 and 2005.c. Find the
Graph each equation.x + 4y = 0
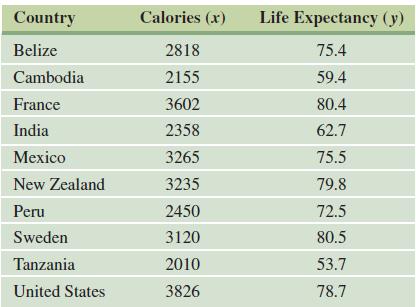
In general, people tend to live longer in countries that have a greater supply of food. Listed below is the 2003–2005 daily calorie supply and 2005 life expectancy at birth for 10 randomly selected countries.a. Find the correlation coefficient. Do the data seem to fit a straight line?b. Draw a
The following table shows the subscribership of cellular telephones in the United States (in millions) for even-numbered years between 2000 and 2008. a. Plot the data by letting t = 0 correspond to 2000. Discuss how well the data fit a straight line.b. Determine a linear equation that
The per capita consumption of beef in the United States decreased from 115.7 lb in 1974 to 92.9 lb in 2007. Assume a linear function describes the decrease. Write a linear equation defining the function. Let t represent the number of years since 1950 and y represent the number of pounds of red meat
The Consumer Price Index (CPI) is a measure of the change in the cost of goods over time. The index was 100 for the three-year period centered on 1983. For simplicity, we will assume that the CPI was exactly 100 in 1983. Then the CPI of 215.3 in 2008 indicates that an item that cost $1.00 in 1983
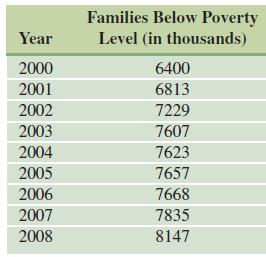
The following table gives the number of families under the poverty level in the U.S. in recent years.a. Find a linear equation for the number of families below poverty level (in thousands) in terms of , the number of years since 2000, using the data for 2000 and 2008.b. Repeat part a, using the
More people are staying single longer in the United States. In 1995, the number of never-married adults, age 15 and over, was 55.0 million. By 2009, it was 72.1 million. Assume the data increase linearly, and write an equation that defines a linear function for this data. Let t represent the number
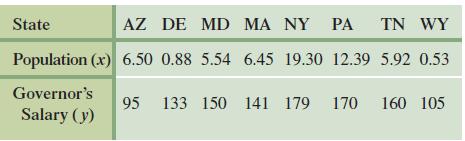
In general, the larger a state’s population, the more the governor earns. Listed in the table below are the estimated 2008 populations (in millions) and the salary of the governor (in thousands of dollars) for eight randomly selected states.a. Find the correlation coefficient. Do the data seem to
Some scientists believe there is a limit to how long humans can live. One supporting argument is that during the last century, life expectancy from age 65 has increased more slowly than life expectancy from birth, so eventually these two will be equal, at which point, according to these scientists,
The mortality rate for children under 5 years of age around the world has been declining in a roughly linear fashion in recent years. The rate per 1000 live births was 90 in 1990 and 65 in 2008.a. Determine a linear equation that approximates the mortality rate in terms of time , where t represents
The percentage of adults in the United States without health insurance increased at a roughly linear rate from 1999, when it was 17.2%, to 2008, when it was 20.3%.a. Determine a linear equation that approximates the percentage of adults in the United States without health insurance in terms of time
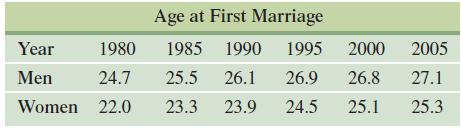
The following table lists the U.S. median age at first marriage for men and women. The age at which both groups marry for the first time seems to be increasing at a roughly linear rate in recent decades. Let t correspond to the number of years since 1980.a. Find a linear equation that approximates
In 1950, there were 249,187 immigrants admitted to the United States. In 2008, the number was 1,107,126.a. Assuming that the change in immigration is linear, write an equation expressing the number of immigrants, y, in terms of t, the number of years after 1900.b. Use your result in part a to
From 2001 to 2007, the number of stations carrying news/talk radio increased at a roughly linear rate, from 1139 in 2001 to 1370 in 2007.a. Find a linear equation expressing the number of stations carrying news/talk radio, , in terms of the years since 2000.b. Use your answer from part a to predict
Simplify each expression by removing as many factors as possible from under the radical. Assume that all variables represent positive real numbers.3√125
Simplify each expression by removing as many factors as possible from under the radical. Assume that all variables represent positive real numbers.4√1296
Simplify each expression by removing as many factors as possible from under the radical. Assume that all variables represent positive real numbers.5√–3125
Simplify each expression by removing as many factors as possible from under the radical. Assume that all variables represent positive real numbers.√50
Simplify each expression by removing as many factors as possible from under the radical. Assume that all variables represent positive real numbers.√2000
Simplify each expression by removing as many factors as possible from under the radical. Assume that all variables represent positive real numbers.√32y5
Simplify each expression by removing as many factors as possible from under the radical. Assume that all variables represent positive real numbers.√27 · √3
Simplify each expression by removing as many factors as possible from under the radical. Assume that all variables represent positive real numbers.√2 · √35
The total value of consumer durable goods has grown at an approximately linear rate in recent years. The annual data for the years 2002 through 2008 can be summarized as follows, where x represents the years since 2000 and y the total value of consumer durable goods in trillions of dollars.a. Find
Simplify each expression by removing as many factors as possible from under the radical. Assume that all variables represent positive real numbers.7√2 – 8√18 + 4√72
The number of banks in the United States has been dropping steadily since 1984, and the trend in recent years has been roughly linear. The annual data for the years 1999 through 2008 can be summarized as follows, where x represents the years since 1990 and the number of banks, in thousands, in the
Simplify each expression by removing as many factors as possible from under the radical. Assume that all variables represent positive real numbers.4√3 – 5√12 + 3√75
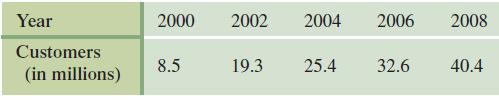
The number of subscribers to digital cable television has been growing steadily, as shown by the following table.a. Find an equation for the least squares line, letting x equal the number of years since 2000.b. Based on your answer to part a, at approximately what rate is the number of subscribers
Simplify each expression by removing as many factors as possible from under the radical. Assume that all variables represent positive real numbers.4√7 – √28 + √343
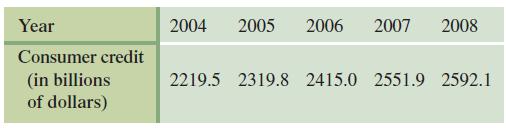
The total amount of consumer credit has been increasing steadily in recent years. The following table gives the total U.S. outstanding consumer credit.a. Find an equation for the least squares line, letting x equal the number of years since 2000.b. Based on your answer to part a, at approximately
Simplify each expression by removing as many factors as possible from under the radical. Assume that all variables represent positive real numbers.3√28 – 4√63 + √112
In Exercises 11–14, decide whether the statement is true or false.The graph of f(x) = –5 is a vertical line.
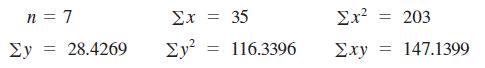
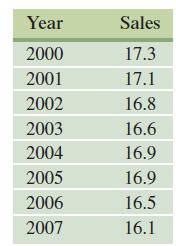
New car sales have increased at a roughly linear rate. Sales, in millions of vehicles, from 2000 to 2007, are given in the table below. Source: National Automobile Dealers Association. Let x represent the number of years since 2000.a. Find the equation of the least squares line and the correlation
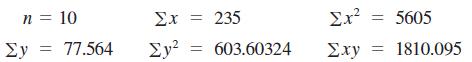
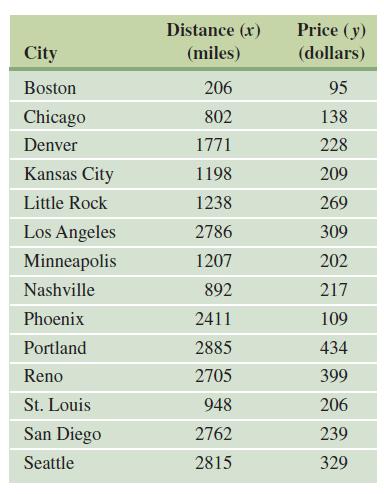
In 2006, for passengers who made early reservations, American Airlines offered lower prices on one-way fares from New York to various cities. Fourteen of the cities are listed in the following table, with the distances from New York to the cities included. Source: American Airlines.a. Plot the
Simplify each expression by removing as many factors as possible from under the radical. Assume that all variables represent positive real numbers.3√2 – 3√16 + 23√54
Simplify each expression by removing as many factors as possible from under the radical. Assume that all variables represent positive real numbers.23√5 – 43√40 + 33√135
Simplify each expression by removing as many factors as possible from under the radical. Assume that all variables represent positive real numbers. √2x³y²z²
Simplify each expression by removing as many factors as possible from under the radical. Assume that all variables represent positive real numbers. V160r¹st¹2
Simplify each expression by removing as many factors as possible from under the radical. Assume that all variables represent positive real numbers. 128x³y³z⁹
Simplify each expression by removing as many factors as possible from under the radical. Assume that all variables represent positive real numbers. 8,7 11 X
Simplify each expression by removing as many factors as possible from under the radical. Assume that all variables represent positive real numbers. Vab - 2Vab + Vab
The following table lists how poverty level income cutoffs (in dollars) for a family of four have changed over time. Let x represent the year, with x = 0 corresponding to 1980 and y represent the income in thousands of dollars.a. Plot the data. Do the data appear to lie along a straight
Simplify each expression by removing as many factors as possible from under the radical. Assume that all variables represent positive real numbers. Vp¹q³ Vpa - Vpa +Vpa 5,9 9
Simplify each expression by removing as many factors as possible from under the radical. Assume that all variables represent positive real numbers.√a · 3√a
Simplify each root, if possible. V16 - 8x + x²
Simplify each expression by removing as many factors as possible from under the radical. Assume that all variables represent positive real numbers.√b3 · 4√b3
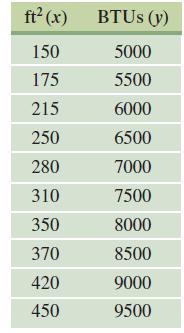
While shopping for an air conditioner, Adam Bryer consulted the following table, which gives a machine’s BTUs and the square footage (ft2) that it would cool.a. Find the equation for the least squares line for the data.b. To check the fit of the data to the line, use the results from part a to
Simplify each root, if possible. V9y2 + 30y + 25
Simplify each root, if possible. V4 - 25z²
Simplify each root, if possible. 9k² + h²
Rationalize each denominator. Assume that all radicands represent positive real numbers.5/√7
Rationalize each denominator. Assume that all radicands represent positive real numbers.5/√10
Rationalize each denominator. Assume that all radicands represent positive real numbers. –3/√12
Rationalize each denominator. Assume that all radicands represent positive real numbers. 4/√8
Rationalize each denominator. Assume that all radicands represent positive real numbers. 3 1-√2 نیا
Rationalize each denominator. Assume that all radicands represent positive real numbers. 5 2-V6
Rationalize each denominator. Assume that all radicands represent positive real numbers. 6 2 + √2
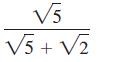
Rationalize each denominator. Assume that all radicands represent positive real numbers. V5 √5 + √2
Rationalize each denominator. Assume that all radicands represent positive real numbers. 1 √r-√3
Joanne Wendelken sells silk-screened T-shirts at community festivals and crafts fairs. Her marginal cost to produce one T-shirt is $3.50. Her total cost to produce 60 T-shirts is $300, and she sells them for $9 each.a. Find the linear cost function for Joanne’s T-shirt production.b. How many
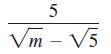
Rationalize each denominator. Assume that all radicands represent positive real numbers. 5 Vm - √5
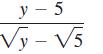
Rationalize each denominator. Assume that all radicands represent positive real numbers. y-5 Vy-√5
Alfred Juarez owns a small publishing house specializing in Latin American poetry. His fixed cost to produce a typical poetry volume is $525, and his total cost to produce 1000 copies of the book is $2675. His books sell for $4.95 each.a. Find the linear cost function for Alfred’s book
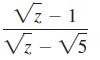
Rationalize each denominator. Assume that all radicands represent positive real numbers. √z-1 √z - √5
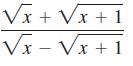
Rationalize each denominator. Assume that all radicands represent positive real numbers. √x + √x+1 √x - √x+1
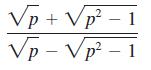
Rationalize each denominator. Assume that all radicands represent positive real numbers. Vp + Vp² - 1 Vp-Vp² - 1
Rationalize each numerator. Assume that all radicands represent positive real numbers. 1+ √₂ 2 2
Rationalize each numerator. Assume that all radicands represent positive real numbers. 3-√3 6
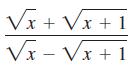
Rationalize each numerator. Assume that all radicands represent positive real numbers. √x + √x+1 √x - √x+1
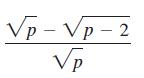
Rationalize each numerator. Assume that all radicands represent positive real numbers. Vp-Vp-2 Vp
The 2009–2010 budget for the California State University system projected a fixed cost of $486,000 at each of five off-campus centers, plus a marginal cost of $1140 per student.a. Find a formula for the cost at each center, C(x), as a linear function of , the number of students.b. The budget
Evaluate each expression. Write all answers without exponents.8–2
Evaluate each expression. Write all answers without exponents.3–4
Showing 600 - 700
of 8662
1
2
3
4
5
6
7
8
9
10
11
12
13
14
15
Last
Step by Step Answers