New Semester
Started
Get
50% OFF
Study Help!
--h --m --s
Claim Now
Question Answers
Textbooks
Find textbooks, questions and answers
Oops, something went wrong!
Change your search query and then try again
S
Books
FREE
Study Help
Expert Questions
Accounting
General Management
Mathematics
Finance
Organizational Behaviour
Law
Physics
Operating System
Management Leadership
Sociology
Programming
Marketing
Database
Computer Network
Economics
Textbooks Solutions
Accounting
Managerial Accounting
Management Leadership
Cost Accounting
Statistics
Business Law
Corporate Finance
Finance
Economics
Auditing
Tutors
Online Tutors
Find a Tutor
Hire a Tutor
Become a Tutor
AI Tutor
AI Study Planner
NEW
Sell Books
Search
Search
Sign In
Register
study help
mathematics
calculus with applications
Calculus With Applications 12th Edition Margaret L. Lial - Solutions
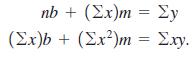
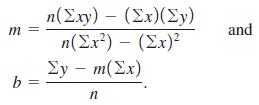
The formulas for the least squares line were found by solving the system of equationsSolve the above system for b and m to show that nb + (2x)m = Συ (Σx)b + (Σx?)m = Σχν.
Find the slope of each line.y = 8
What six quantities are needed to compute a correlation coefficient?
For exercises, let f (x) = 7 – 5x and g(x) – 2x – 3.Find the following. g(2.5)
Find the slope of each line.The x-axis
What is marginal cost? Fixed cost?
Find the slope of each line.x = 5
For exercises, let f (x) = 7 – 5x and g(x) – 2x – 3.Find the following.g(1.5)
Determine whether each statement is true or false, and explain why.It is not possible to get a correlation coefficient of -1.5 for a set of data.
For exercises, let f (x) = 7 – 5x and g(x) – 2x – 3.Find the following.ƒ(-1)
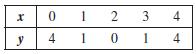
Consider the following table of data.(a) Calculate the least squares line and the correlation coefficient.(b) Sketch a graph of the data.(c) Comparing your answers to parts (a) and (b), does a correlation coefficient of 0 mean that there is no relationship between the x- and y- values? Would some
Consider the following table of data.(a) Calculate the correlation coefficient.(b) Sketch a graph of the data.(c) Based on how closely the data fit a straight line, is your answer to part (a) surprising? Discuss the extent to which the correlation coefficient describes how well the data fit a
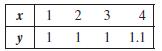
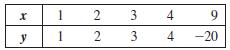
Consider the following table of data.(a) Calculate the least squares line and the correlation coefficient.(b) Repeat part (a), but this time delete the last point.(c) Draw a graph of the data, and use it to explain the dramatic difference between the answers to parts (a) and (b). ५ y 1 2 1 22 3
Determine whether each statement is true or false, and explain why.The lines 4x + 3y = 8 and 4x + y = 5 are parallel.
For exercises let f (x) = 7 – 5x and g(x) – 2x – 3.Find the following.ƒ(4)
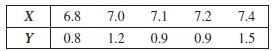
The following problem is reprinted from the Actuarial Examination on Applied Statistical Methods.You are givenDetermine r2, the coefficient of determination for the regression of Y on X. Choose one of the following.(a) 0.3 (b) 0.4 (c) 0.5 (d) 0.6 (e) 0.7 X 6.8 Y 0.8 7.0 7.1 1.2
Find the slope of each line.y = 3x - 2
Determine whether each statement is true or false, and explain why.The lines y = 3x + 17 and y = -3x + 8 are perpendicular.
For exercises, let f (x) = 7 – 5x and g(x) – 2x – 3.Find the following.ƒ(2)
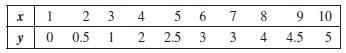
For the following table of data,(a) Draw a scatterplot.(b) Calculate the correlation coefficient.(c) Calculate the least squares line and graph it on the scatterplot.(d) Predict the y-value when x is 11. X y 2 3 1 0 0.5 4 12 5 6 2.5 3 7 3 8 9 10 4 4.5 5
Determine whether each statement is true or false, and explain why.At the break-even point, the profit is 0.
Find the slope of each line.Through (4, 5) and (-1, 2)
Suppose a positive linear correlation is found between two quantities. Does this mean that one of the quantities increasing causes the other to increase? If not, what does it mean?
Determine whether each statement is true or false, and explain why.The graph of ƒ(x) = ax is a straight line that passes through the origin.
Determine whether each statement is true or false, and explain why.The slope of the graph of a linear function cannot be undefined.
A vertical line has a slope of 0.Determine whether each statement is true or false, and explain why.
Determine whether each statement is true or false, and explain why.A positive correlation coefficient between two variables means that an increase in one causes an increase in the other.
Determine whether each statement is true or false, and explain why.The equation y = 3x + 4 represents the equation of a line with slope 4.
Determine whether each statement is true or false, and explain why.The graph of ƒ(x) = -5 is a vertical line.
Any equation of the form y = mx + b represents a line, where m and b are constants.Determine whether each statement is true or false, and explain why.
Determine whether each statement is true or false, and explain why.Knowing Σx, Σy, Σx2, Σxy, and n is sufficient for calculating the correlation coefficient.
Determine whether each statement is true or false, and explain why.A given line can have more than one slope.
Determine whether each statement is true or false, and explain why.To find the x-intercept of the graph of a linear function, we solve y = ƒ(x) = 0, and to find the y-intercept, we evaluate ƒ(0).
Any line can be represented in the form y = mx + b.Determine whether each statement is true or false, and explain why.
Determine whether each statement is true or false, and explain why.Knowing Σx, Σy, Σx2, Σxy, and n is sufficient for calculating the least squares line.
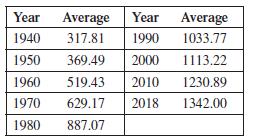
The average monthly Social Security payments (in 2018 dollars) to Old-Age, Survivors, and Disability Insurance (OASDI) recipients for selected years are given in the following table.(a) Find an equation for the least squares line, letting x equal the number of years since 1900.(b) Use your result
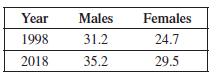
More people are staying single longer in the United States. The following table gives the percent of never-married adults, age 15 and over, by gender, for the years 1998 and 2018. The growth has been approximately linear.(a) Find a linear function, m1t2, for the percent of never-married males in
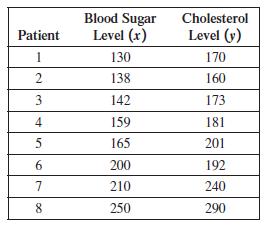
The following data show the connection between blood sugar levels and cholesterol levels for eight different patients.For the data given in the preceding table, Σx = 1394, Σy = 1607, Σxy = 291,990, Σx2 = 255,214, and Σy2 = 336,155.(a) Find the equation of the least squares line.(b) Predict the
Graph each equation.x = 4
Graph each equation.x + 5 = 0
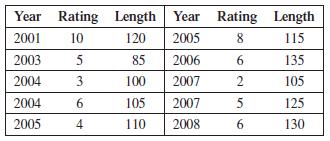
A mathematician exploring the relationship between ratings of movies, their year of release, and their length discovered a paradox. Rather than list the data set of 100 movies in the original research, we have created a sample of size 10 that captures the properties of the original dataset. In the
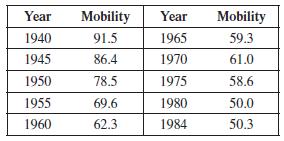
A recent study found that “absolute income mobility,” defined as the percent of children who earn more than their parents, declined in a linear way in the 20th century. The following table of selected data points shows the absolute income mobility for cohorts born in various years between 1940
Graph each equation.y + 8 = 0
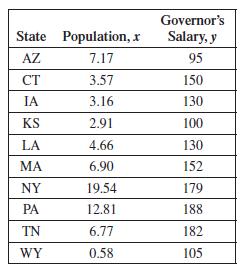
Listed in the table below are the estimated 2018 populations (in millions) and the 2018 salary of the governor (in thousands of dollars) for ten randomly selected states. (a) Find the correlation coefficient. Do the data seem to fit a straight line?(b) Draw a scatterplot of the data. Compare
Graph each equation.y = 2x
Graph each equation.y = -5x
Graph each equation.x + 4y = 0
Graph each equation.3x - 5y = 0
The sales of a small company were $27,000 in its second year of operation and $63,000 in its fifth year. Let y represent sales in the xth year of operation. Assume that the data can be approximated by a straight line.(a) Find the slope of the sales line, and give an equation for the line in the
The total cost for a bakery to produce 100 gourmet cupcakes is $126, while the total cost to produce 120 gourmet cupcakes is $144. Let y represent the total cost for x gourmet cupcakes. Assume that a straight line can approximate the data.(a) Find and interpret the slope of the cost line for the
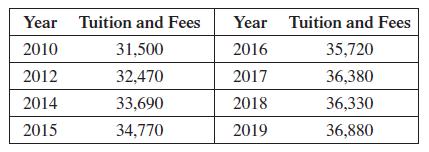
The table lists the annual cost (in 2019 dollars) of tuition and fees at private four-year colleges for selected years.(a) Sketch a graph of the data. Do the data appear to lie roughly along a straight line?(b) Let t = 0 correspond to the year 2000. Use the points (10, 31,500) and (19, 36,880) to
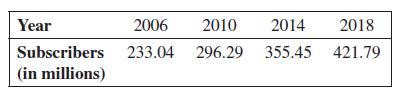
The following table shows the subscribership of cellular telephones in the United States (in millions) for selected years between 2006 and 2018. The World Almanac and Book of Facts 2020.(a) Plot the data by letting t = 0 correspond to 2000. Discuss how well the data fit a straight line.(b)
The time interval between a person’s initial infection with HIV and that person’s eventual development of AIDS symptoms is an important issue. The method of infection with HIV affects the time interval before AIDS develops. One study of HIV patients who were infected by intravenous drug use
To achieve the maximum benefit for the heart when exercising, your heart rate (in beats per minute) should be in the target heart rate zone. The lower limit of this zone is found by taking 70% of the difference between 220 and your age. The upper limit is found by using 85%.(a) Find formulas for
A study found that the peak vertical force on a trotting Shetland pony increased linearly with the pony’s speed, and that when the force reached a critical level, the pony switched from a trot to a gallop. For one pony, the critical force was 1.16 times its body weight. It experienced a force of
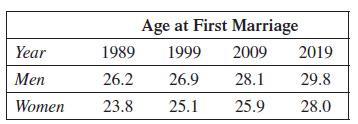
The following table lists the U.S. median age at first marriage for men and women. The age at which both groups marry for the first time seems to be increasing at a roughly linear rate in recent decades. Let t correspond to the number of years since 1980. (a) Find a linear equation that
Some scientists believe there is a limit to how long humans can live. One supporting argument is that during the past century, life expectancy from age 65 has increased more slowly than life expectancy from birth, so eventually these two will be equal, at which point, according to these scientists,
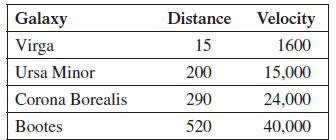
The table lists the distances (in megaparsecs where 1 megaparsec ≈ 3.1 × 10¹⁹ km) and velocities (in kilometers per second) of four galaxies moving rapidly away from Earth.(a) Plot the data points, letting x represent distance and y represent velocity. Do the points lie in an
The mortality rate for children under 5 years of age around the world has been declining in a roughly linear fashion in recent years. The rate per 1000 live births was 93 in 1990 and 39 in 2018.(a) Determine a linear equation that approximates the mortality rate in terms of time t, where t
In 1950, there were 249,187 immigrants admitted to the United States. In 2017, the number was 1,127,167.(a) Assuming that the change in immigration is linear, write an equation expressing the number of immigrants, y, in terms of t, the number of years after 1900.(b) Use your result in part (a) to
In 1990, the Intergovernmental Panel on Climate Change (IPCC) predicted that the average temperature on Earth would rise 0.3ºC per decade in the absence of international controls on greenhouse emissions. Let t measure the time in years since 1970, when the average global temperature was
According to a Pew Research survey, the percentage of Americans aged 12 and older who had listened to online radio in the previous month increased from 27% in 2010 to 64% in 2018. During this same period, the percentage of U.S. cellphone users who had ever listened to online radio in a car, using a
Showing 8600 - 8700
of 8662
First
73
74
75
76
77
78
79
80
81
82
83
84
85
86
87
Step by Step Answers