New Semester
Started
Get
50% OFF
Study Help!
--h --m --s
Claim Now
Question Answers
Textbooks
Find textbooks, questions and answers
Oops, something went wrong!
Change your search query and then try again
S
Books
FREE
Study Help
Expert Questions
Accounting
General Management
Mathematics
Finance
Organizational Behaviour
Law
Physics
Operating System
Management Leadership
Sociology
Programming
Marketing
Database
Computer Network
Economics
Textbooks Solutions
Accounting
Managerial Accounting
Management Leadership
Cost Accounting
Statistics
Business Law
Corporate Finance
Finance
Economics
Auditing
Tutors
Online Tutors
Find a Tutor
Hire a Tutor
Become a Tutor
AI Tutor
AI Study Planner
NEW
Sell Books
Search
Search
Sign In
Register
study help
mathematics
college algebra graphs and models
College Algebra With Modeling And Visualization 6th Edition Gary Rockswold - Solutions
Find the center and radius of the circle. (x-2)² + (y + 3)² = 9
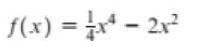
Graph y = f(x) in the viewing rectangle [-4.7,4.7, 1] by [-3.1, 3.1, 1]. (a) Use the graph to evaluate f(2). (b) Evaluate f(2) symbolically. (c) Let x = -3, -2, -1, 0, 1, 2, 3 and make a table of values for f(x). f(x)=√x + 2
For the given amounts A and B, find each of the following. Round values to the nearest hundredth when appropriate. (a) The percent change if A changes to B (b) The percent change if B changes to AA = $500, B = $1000
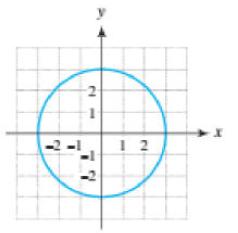
Find the center and radius of the circle. (x - 3)² + y² = 7
Graph y = f(x) in the viewing rectangle [-4.7,4.7, 1] by [-3.1, 3.1, 1]. (a) Use the graph to evaluate f(2). (b) Evaluate f(2) symbolically. (c) Let x = -3, -2, -1, 0, 1, 2, 3 and make a table of values for f(x). f(x) = 3-1.5x²
Identify where f is increasing and where f is decreasing. Consider the graph y = f(x). f(x)=√x-1
Graph y = f(x) in the viewing rectangle [-4.7,4.7, 1] by [-3.1, 3.1, 1]. (a) Use the graph to evaluate f(2). (b) Evaluate f(2) symbolically. (c) Let x = -3, -2, -1, 0, 1, 2, 3 and make a table of values for f(x). f(x)
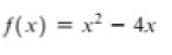
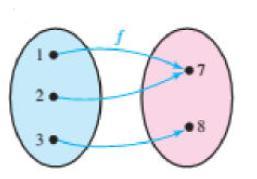
Identify where f is increasing and where f is decreasing. Consider the graph y = f(x). f(x) = x² - 4x
Find the center and radius of the circle. < = zlc + ) + x
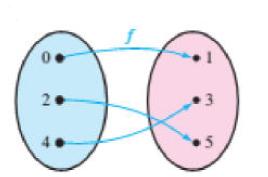
Diagrams Complete the following. (a) Evaluate f(2). (b) Write f as a set of ordered pairs. (c) Find the domain and range of f. 0 2. 5
Identify where f is increasing and where f is decreasing. Consider the graph y = f(x). f(x) = 2x - x²
Identify where f is increasing and where f is decreasing. Consider the graph y = f(x). f(x) = -x²
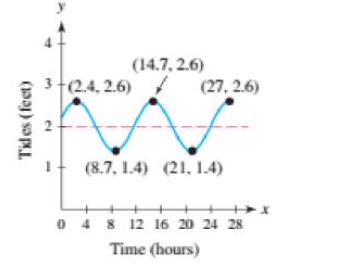
The graph gives the tides at Clearwater Beach, Florida, x hours after midnight on a particular day, where 0 ≤ x ≤ 27.When were water levels increasing? Tides (feet) (14.7, 2.6) 7 (27,2.6) A f 3-(2.4.2.6) (8.7, 1.4) (21, 1.4) 0 4 8 12 16 20 24 28 Time (hours)
Graph y = f(x) in the viewing rectangle [-4.7,4.7, 1] by [-3.1, 3.1, 1]. (a) Use the graph to evaluate f(2). (b) Evaluate f(2) symbolically. (c) Let x = -3, -2, -1, 0, 1, 2, 3 and make a table of values for f(x). f(x) = 1.6x - 21
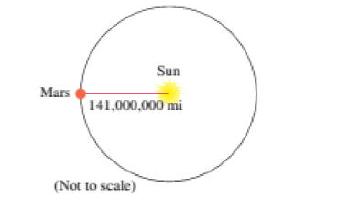
The planet Mars travels around the sun in a nearly circular orbit with a radius of 141 million miles. If it takes 1.88 years for Mars to complete one orbit, estimate the orbital speed of Mars in miles per hour. Mars Sun 141,000,000 mi (Not to scale)
Find the standard equation of a circle that satisfies the conditions.Radius 5, center (-1,4)
Use f(x) to determine verbal, graphical, and numerical representations. For the numerical representation use a table with x = -2, -1, 0, 1, 2. Evaluate f(2). f(x)=x²-1
Identify where f is increasing and where f is decreasing. Consider the graph y = f(x). f(x)=x²- 2x²
The Pacific plate (the floor of the Pacific Ocean) near Hawaii is moving at about 0.000071 kilometer per year. This is about the speed at which a fingernail grows. Use scientific notation to determine how many kilometers the Pacific plate travels in 1 million years.
Use f(x) to determine verbal, graphical, and numerical representations. For the numerical representation use a table with x = -2, -1, 0, 1, 2. Evaluate f(2). f(x) = √x + 1
Identify where f is increasing and where f is decreasing. Consider the graph y = f(x). f(x) = x¹ + x³ + x²
Use f(x) to determine verbal, graphical, and numerical representations. For the numerical representation use a table with x = -2, -1, 0, 1, 2. Evaluate f(2). f(x) = |x|
Find the standard equation of a circle that satisfies the conditions.Radius 8, center (3,-5)
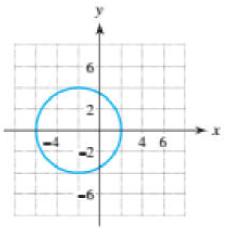
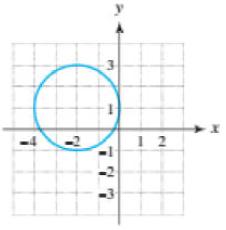
Find the standard equation of the circle. 2 딤 a
Identify where f is increasing and where f is decreasing. Consider the graph y = f(x). f(x) = x³ - 3x
Find the standard equation of the circle. 3 77 12
Use f(x) to determine verbal, graphical, and numerical representations. For the numerical representation use a table with x = -2, -1, 0, 1, 2. Evaluate f(2). f(x) = 5-x
Identify where f is increasing and where f is decreasing. Consider the graph y = f(x). xt - x2 = (x)/
If your salary is $35,000 per year and increases by 200%, what is your new salary?
Find the standard equation of the circle. -2-1 2 12
Use f(x) to determine verbal, graphical, and numerical representations. For the numerical representation use a table with x = -2, -1, 0, 1, 2. Evaluate f(2). 8 = (x) f
For the given amounts A and B, find each of the following. Round values to the nearest hundredth when appropriate. (a) The percent change if A changes to B (b) The percent change if B changes to AA = 75, B = 50
Identify where f is increasing and where f is decreasing. Consider the graph y = f(x). *A = (x)/
Use f(x) to determine verbal, graphical, and numerical representations. For the numerical representation use a table with x = -2, -1, 0, 1, 2. Evaluate f(2). f(x) = |2x + 11
Find the standard equation of the circle. 1 1234
For the given amounts A and B, find each of the following. Round values to the nearest hundredth when appropriate. (a) The percent change if A changes to B (b) The percent change if B changes to AA = 45, B = 65
Identify where f is increasing and where f is decreasing. Consider the graph y = f(x). f(x) = x³
Use f(x) to determine verbal, graphical, and numerical representations. For the numerical representation use a table with x = -2, -1, 0, 1, 2. Evaluate f(2). f(x)=2x-5
Identify where f is increasing and where f is decreasing. Consider the graph y = f(x). |1= x| = (x)f
For the given amounts A and B, find each of the following. Round values to the nearest hundredth when appropriate. (a) The percent change if A changes to B (b) The percent change if B changes to A A = 15, B = 5
Find the center and radius of the circle. x² + (y + 1)² = 100
For the given amounts A and B, find each of the following. Round values to the nearest hundredth when appropriate. (a) The percent change if A changes to B (b) The percent change if B changes to A A $1.27, B = $1.30
Use f(x) to determine verbal, graphical, and numerical representations. For the numerical representation use a table with x = -2, -1, 0, 1, 2. Evaluate f(2). f(x) = x²
Identify where f is increasing and where f is decreasing. Consider the graph y = f(x). |ε + x| = (x)f
For the given amounts A and B, find each of the following. Round values to the nearest hundredth when appropriate. (a) The percent change if A changes to B (b) The percent change if B changes to AA = $500, B = $200
Find the center and radius of the circle. (x + 1)² + (y − 1)² = 16
Find the center and radius of the circle. (x - 5)² + y² = 19
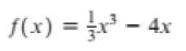
Find the center and radius of the circle. x² + y² = 7
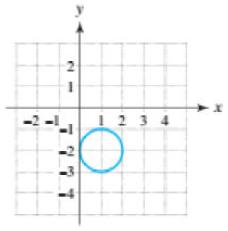
Diagrams Complete the following. (a) Evaluate f(2). (b) Write f as a set of ordered pairs. (c) Find the domain and range of f. 20 7 € ●8
Identify where f is increasing and where f is decreasing. Consider the graph y = f(x). f(x)=x²-2
Use a calculator to evaluate the expression. Round your result to the nearest thousandth. 5+ √5 2
Find the center and radius of the circle. x² + y² = 100
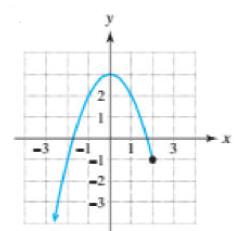
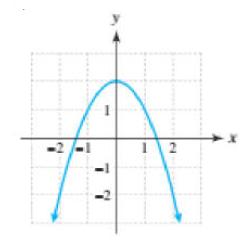
Use the graph of the function f to estimate its domain and range. Use interval notation. Evaluate f(0). 2
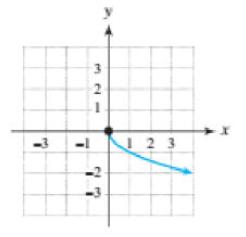
Use the graph of the function f to estimate its domain and range. Use interval notation. Evaluate f(0). -3-2 - 123 ➤X
Identify where f is increasing and where f is decreasing. Consider the graph y = f(x). x = + = (x)f
Use a calculator to evaluate the expression. Round your result to the nearest thousandth. 15 + 4+√3 V 7
Identify where f is increasing and where f is decreasing. Consider the graph y = f(x). f(x) = 2x - 1
Find the center and radius of the circle. x² + y² = 25
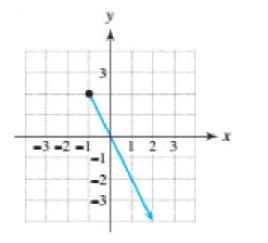
Use the graph of the function f to estimate its domain and range. Use interval notation. Evaluate f(0). 1 2
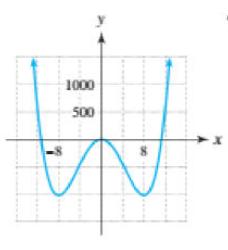
Use the graph off to determine intervals where f is increasing and where f is decreasing. 7 1000 500 X
One endpoint of a line segment is (7,-4) and its midpoint is (8, 5). Find the other endpoint of the line segment.
Use a calculator to evaluate the expression. Round your result to the nearest thousandth. 3.2 (1.1)²4(1.1) +2
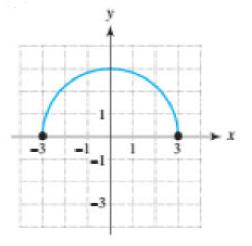
Use the graph of the function f to estimate its domain and range. Use interval notation. Evaluate f(0). 3
Find the distance between the two points and the midpoint of the segment connecting the two points. (-8,-2), (-3,-5)
Use a calculator to evaluate the expression. Round your result to the nearest thousandth. 0.3 + 1.5 5.5 - 1.2
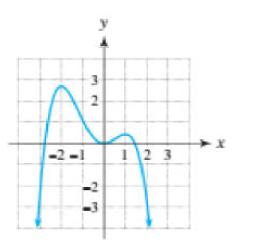
Use the graph off to determine intervals where f is increasing and where f is decreasing. -2-1 32 2 E71
Use the graph of the function f to estimate its domain and range. Use interval notation. Evaluate f(0). 3 XA
Find the distance between the two points and the midpoint of the segment connecting the two points. (-6, 10), (42,-45)
Use the graph off to determine intervals where f is increasing and where f is decreasing. بيا دا - 2 tt
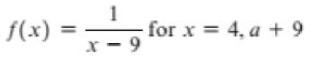
Complete the following. (a) Find f(x) for the indicated values of x, if possible. (b) Find the domain of f. Use words or inequalities to describe the domain. f(x) = 1 X-9 for x = 4, a +9
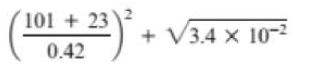
Use a calculator to approximate the expression. Write your result in scientific notation. 101 +232 0.42 + V3.4 x 10-²
Graph the linear function by hand. Identify the slope and y-intercept. f(x) = -30x + 20
Find the midpoint of the line segment connecting the points. (√7,3√3), (-√7, -√3)
Use a calculator to approximate the expression. Write your result in scientific notation. √(4.56 × 10¹) + (3.1 × 10²) X
Use the graph off to determine intervals where f is increasing and where f is decreasing. 2-1 123/4
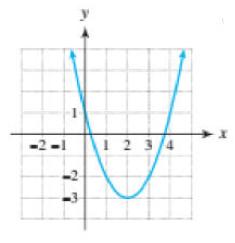
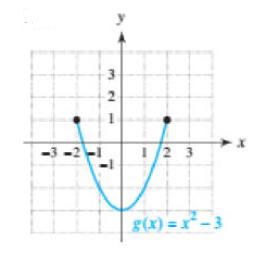
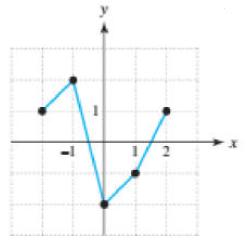
Use the graph to complete the following. (a) Estimate the domain and range of g. Use interval notation. (b) Use the formula to evaluate g(-1) and g(2). (c) Use the graph of g to evaluate g(-1) and g(2). 32 3-2-1 1/23 g(x)=x²-3
Find the distance between the two points and the midpoint of the segment connecting the two points. (5,7), (2, 11)
Use a calculator to evaluate the expression. Round your result to the nearest thousandth. |π = 3.2| 77
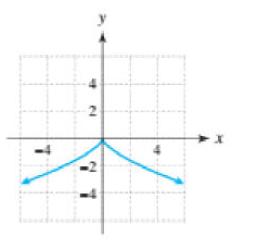
Use the graph off to determine intervals where f is increasing and where f is decreasing. 3 3
Find the midpoint of the line segment connecting the points. (1.5, 2.9), (-5.7, -3.6)
Complete the following. (a) Find f(x) for the indicated values of x, if possible. (b) Find the domain of f. Use words or inequalities to describe the domain. f(x) = 5x31 for x = -3,0
Complete the following. (a) Find f(x) for the indicated values of x, if possible. (b) Find the domain of f. Use words or inequalities to describe the domain. f(x) = for x = 4,-7
Graph the linear function by hand. Identify the slope and y-intercept. g(x) = 20 - 10x
Use a calculator to approximate the expression. Write your result in scientific notation. (9.87 x 10°) (3.4 × 10¹2)
Graph the linear function by hand. Identify the slope and y-intercept. f(x) = 20x
Use a calculator to evaluate the expression. Round your result to the nearest thousandth. 4.3² 5 17
One endpoint of a line segment L is (2, 4) with midpoint M. The midpoint of a second line segment connecting (2, 4) and M is (0,5). Find midpoint M and the other endpoint of line segment L.
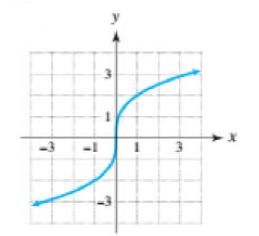
Use the graph off to determine intervals where f is increasing and where f is decreasing. 2
Use the graph of the function f to estimate its domain and range. Use interval notation. Evaluate f(0). M 3
Use the graph off to determine intervals where f is increasing and where f is decreasing.
Use a calculator to evaluate the expression. Round your result to the nearest thousandth. 1.72 - 5.98 35.6 + 1.02
Find the distance between the two points and the midpoint of the segment connecting the two points. (-2,5), (4,-3)
Find the midpoint of the line segment connecting the points. (-a, b), (3a, b)
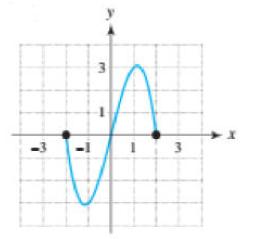
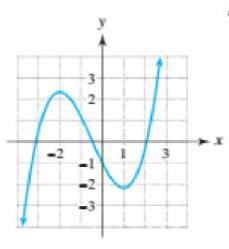
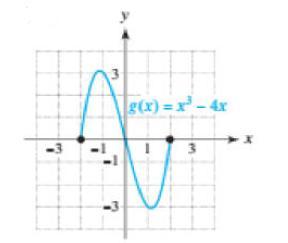
Use the graph to complete the following. (a) Estimate the domain and range of g. Use interval notation. (b) Use the formula to evaluate g(-1) and g(2). (c) Use the graph of g to evaluate g(-1) and g(2). N 3 g(x)=x-4x I 3
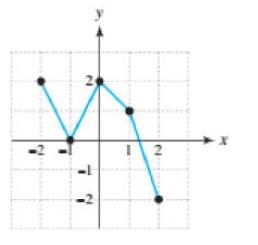
Use the graph off to determine intervals where f is increasing and where f is decreasing. 2
Use a calculator to evaluate the expression. Round your result to the nearest thousandth. V (32 + #³)
Find the midpoint of the line segment connecting the points. (a, b), (-a, 3b)
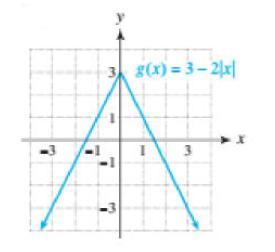
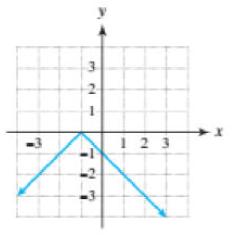
Use the graph to complete the following. (a) Estimate the domain and range of g. Use interval notation. (b) Use the formula to evaluate g(-1) and g(2). (c) Use the graph of g to evaluate g(-1) and g(2). g(x)=3-2|x|
Use a calculator to evaluate the expression. Round your result to the nearest thousandth. 192
Use the graph off to determine intervals where f is increasing and where f is decreasing. -3 3 2 1 123 r
Showing 12400 - 12500
of 13634
First
118
119
120
121
122
123
124
125
126
127
128
129
130
131
132
Last
Step by Step Answers