New Semester
Started
Get
50% OFF
Study Help!
--h --m --s
Claim Now
Question Answers
Textbooks
Find textbooks, questions and answers
Oops, something went wrong!
Change your search query and then try again
S
Books
FREE
Study Help
Expert Questions
Accounting
General Management
Mathematics
Finance
Organizational Behaviour
Law
Physics
Operating System
Management Leadership
Sociology
Programming
Marketing
Database
Computer Network
Economics
Textbooks Solutions
Accounting
Managerial Accounting
Management Leadership
Cost Accounting
Statistics
Business Law
Corporate Finance
Finance
Economics
Auditing
Tutors
Online Tutors
Find a Tutor
Hire a Tutor
Become a Tutor
AI Tutor
AI Study Planner
NEW
Sell Books
Search
Search
Sign In
Register
study help
mathematics
college algebra graphs and models
College Algebra With Modeling And Visualization 6th Edition Gary Rockswold - Solutions
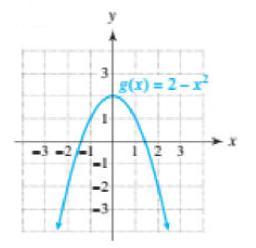
Use the graph to complete the following. (a) Estimate the domain and range of g. Use interval notation. (b) Use the formula to evaluate g(-1) and g(2). (c) Use the graph of g to evaluate g(-1) and g(2). 2-1 3 g(x)=2-x² 123
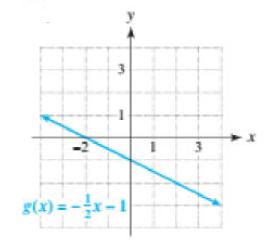
Use the graph to complete the following. (a) Estimate the domain and range of g. Use interval notation. (b) Use the formula to evaluate g(-1) and g(2). (c) Use the graph of g to evaluate g(-1) and g(2). -2 3 g(x)=-x-1 3
Use a calculator to approximate the expression. Write your result in scientific notation. (8.5 x 10⁻⁵) (-9.5 × 10⁷) ²
Find the midpoint of the line segment connecting the points. (√2, √5). (√₂-√5)
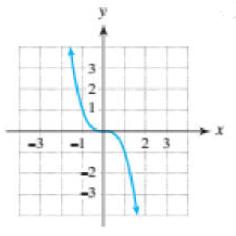
Use the graph off to determine intervals where f is increasing and where f is decreasing. 3 2 23
Use a calculator to approximate the expression. Write your result in scientific notation. (2.5 x 10⁻⁸) + 10-7
Find the midpoint of the line segment connecting the points. (9.4.-4.5), (-7.7.9.5)
Complete the following. (a) Find f(x) for the indicated values of x, if possible. (b) Find the domain of f. Use words or inequalities to describe the domain. f(x) = x² = x + 1 for x = 1, −2
Find the midpoint of the line segment connecting the points. (28, -33), (52, 38)
Find the midpoint of the line segment connecting the points. -30, 50), (50, -30)
Graph the linear function by hand. Identify the slope and y-intercept. g(x) =
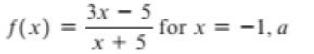
Complete the following. (a) Find f(x) for the indicated values of x, if possible. (b) Find the domain of f. Use words or inequalities to describe the domain. f(x): = 3x - 5 x+5 for x = -1, a
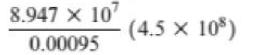
Use a calculator to approximate the expression. Write your result in scientific notation. 8.947 x 10⁷ 0.00095 (4.5 X 10⁸)
Graph the linear function by hand. Identify the slope and y-intercept. g(x) = 5 - 5x
Graph the linear function by hand. Identify the slope and y-intercept. g(x) = 3
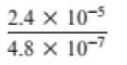
Evaluate the expression by hand. Write your result in scientific notation and standard form. 2.4 x 10⁻⁵ 4.8 x 10⁻⁷
Find the midpoint of the line segment connecting the points. (-6, 7), (9,-4)
Find the midpoint of the line segment connecting the points. (1,2), (5,-3)
Complete the following. (a) Find f(x) for the indicated values of x, if possible. (b) Find the domain of f. Use words or inequalities to describe the domain. f(x) = -7 for x = 6, a - 1
Graph the linear function by hand. Identify the slope and y-intercept. x² = (x)8
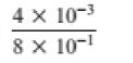
Evaluate the expression by hand. Write your result in scientific notation and standard form. 4 x 10⁻³ 8 x 10⁻¹
Complete the following. (a) Find f(x) for the indicated values of x, if possible. (b) Find the domain of f. Use words or inequalities to describe the domain. f(x) = V1- x for x = -2, a + 2
Complete the following. (a) Find f(x) for the indicated values of x, if possible. (b) Find the domain of f. Use words or inequalities to describe the domain. f(x) = 6 - 3x for x = -1, a +1
Graph the linear function by hand. Identify the slope and y-intercept. f(x) = 2x - 3
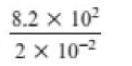
Evaluate the expression by hand. Write your result in scientific notation and standard form. 8.2 x 10² 2 x 10-²
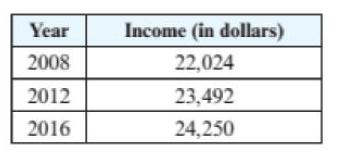
Poverty-Level Income Cutoffs The table lists poverty-level income cutoffs for a family of four for selected years. Use the midpoint formula to estimate the poverty-level cutoffs (rounded to the nearest dol- lar) in 2010 and 2014. Year 2008 2012 2016 Income (in dollars) 22,024 23,492 24,250
Graph the linear function by hand. Identify the slope and y-intercept. x² = + = (x)/
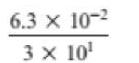
Evaluate the expression by hand. Write your result in scientific notation and standard form. 6.3 × 10-² 3 x 10¹
Complete the following. (a) Find f(x) for the indicated values of x, if possible. (b) Find the domain of f. Use words or inequalities to describe the domain. f(x) = √x for x = -1, a + 1
Complete the following. (a) Find f(x) for the indicated values of x, if possible. (b) Find the domain of f. Use words or inequalities to describe the domain. f(x) = √2-x for x = -2, 2
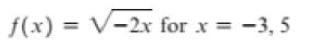
Complete the following. (a) Find f(x) for the indicated values of x, if possible. (b) Find the domain of f. Use words or inequalities to describe the domain. f(x) = √-2x for x = -3,5
Graph the linear function by hand. Identify the slope and y-intercept. f(x) = -³x
Complete the following. (a) Find f(x) for the indicated values of x, if possible. (b) Find the domain of f. Use words or inequalities to describe the domain. f(x) = |2 - 3x for x = -1,4
Graph the linear function by hand. Identify the slope and y-intercept. て =(x)
Graph the linear function by hand. Identify the slope and y-intercept. f(x) = 3-x
Complete the following. (a) Find f(x) for the indicated values of x, if possible. (b) Find the domain of f. Use words or inequalities to describe the domain. f(x) = 5 + x2x² for x = -1,5
Graph the linear function by hand. Identify the slope and y-intercept. f(x) = 3x + 2
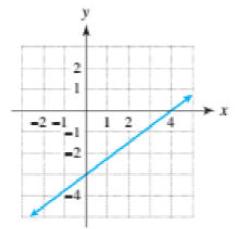
The graph of a linear function f is shown. (a) Identify the slope, y-intercept, and x-intercept. (b) Write a formula for f. (c) Estimate the zero of f. -2- l 12 x
Write a formula for a linear function f whose graph satisfies the conditions. Slope 15, passing through the origin
Complete the following. (a) Find f(x) for the indicated values of x, if possible. (b) Find the domain of f. Use words or inequalities to describe the domain. f(x)=x²-3x for x = -3,2
Write a formula for a linear function f whose graph satisfies the conditions. Slope 1.68, passing through (0, 1.23)
Complete the following. (a) Find f(x) for the indicated values of x, if possible. (b) Find the domain of f. Use words or inequalities to describe the domain. f(x) = 2x1 for x = 8, -1
A function g is defined. (a) Write g as a set of ordered pairs. (b) Give the domain and range of g. g(-4)= 5. g(0) = -5, g(4) = 5, g(8) = 0
Write a formula for a linear function f whose graph satisfies the conditions. Slope - y-intercept (0,1)
Complete the following. (a) Find f(x) for the indicated values of x, if possible. (b) Find the domain of f. Use words or inequalities to describe the domain. f(x) = x³ for x = -2,5
Write a formula for a linear function f whose graph satisfies the conditions. Slope -122, y-intercept (0, 805)
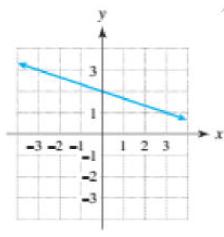
The graph of a linear function f is shown. (a) Identify the slope, y-intercept, and x-intercept. (b) Write a formula for f. (c) Estimate the zero of f. y 3 1 3 1 2 3
A function g is defined. (a) Write g as a set of ordered pairs. (b) Give the domain and range of g. g(-1) = 2, g(0) = 4, g(1) = -3, g(2) = 2
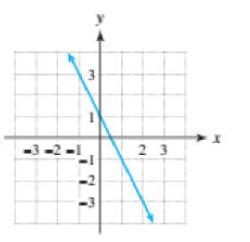
The graph of a linear function f is shown. (a) Identify the slope, y-intercept, and x-intercept. (b) Write a formula for f. (c) Estimate the zero of f. -3-2-1 3 23
A function g is defined. (a) Write g as a set of ordered pairs. (b) Give the domain and range of g. g(-5) = 0, g(0) = -5, g(5) = 0
A function g is defined. (a) Write g as a set of ordered pairs. (b) Give the domain and range of g. g(1) = 8, g(2) = 8, g(3) = 8
A function g is defined. (a) Write g as a set of ordered pairs. (b) Give the domain and range of g. g(-2) = 5, g(3) = 9, g(4) =
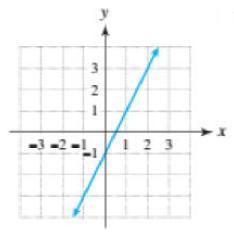
The graph of a linear function f is shown. (a) Identify the slope, y-intercept, and x-intercept. (b) Write a formula for f. (c) Estimate the zero of f. 3 2 -3-2-1123 X
The cost C in dollars of purchasing x gallons of paint is given by C(x) = 29x. (a) Evaluate C(5) and interpret your result. (b) Find the slope of the graph of C. Interpret this slope as a rate of change.
A function g is defined. (a) Write g as a set of ordered pairs. (b) Give the domain and range of g. g(-1) = 0, g(2) = -2, g(5) = 7
Graph y = f(x) by hand by first plotting points to determine the shape of the graph. f(x) = 2x²
Determine if f is a linear or nonlinear function. If f is a linear function, determine if f is a con- stant function. Support your answer by graphing f. f(x)=√x-1
Graph y = f(x) by hand by first plotting points to determine the shape of the graph. f(x) = x²
Graph y = f(x) by hand by first plotting points to determine the shape of the graph. f(x) = x² + 1
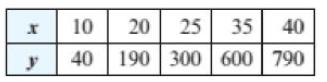
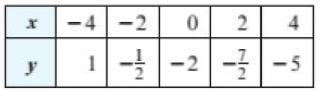
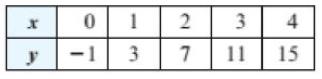
Decide whether a line can pass through the data points. If it can, determine the slope of the line.
Decide whether a line can pass through the data points. If it can, determine the slope of the line. x 10 20 25 35 40 40 190 300 600 790
Decide whether a line can pass through the data points. If it can, determine the slope of the line. -4-2 0 1 -- -2 24
Graph y = f(x) by hand by first plotting points to determine the shape of the graph. f(x) = x² - 2
Determine if f is a linear or nonlinear function. If f is a linear function, determine if f is a con- stant function. Support your answer by graphing f. 1-²x = (x)/
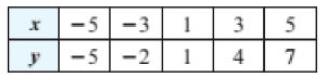
Decide whether a line can pass through the data points. If it can, determine the slope of the line. x 0 1 2 3 3 7 11 -1 4 15
Graph y = f(x) by hand by first plotting points to determine the shape of the graph. f(x) = |2x - 1|
Graph y = f(x) by hand by first plotting points to determine the shape of the graph. f(x) = |3x|
Determine if f is a linear or nonlinear function. If f is a linear function, determine if f is a con- stant function. Support your answer by graphing f. f(x) = |2x - 1|
Determine if f is a linear or nonlinear function. If f is a linear function, determine if f is a con- stant function. Support your answer by graphing f. f(x) = x + 1|
Graph y = f(x) by hand by first plotting points to determine the shape of the graph. f(x) = 10.5x|
Graph y = f(x) by hand by first plotting points to determine the shape of the graph. f(x) = |x-1|
Determine if f is a linear or nonlinear function. If f is a linear function, determine if f is a con- stant function. Support your answer by graphing f. f(x) = -2
Determine if f is a linear or nonlinear function. If f is a linear function, determine if f is a con- stant function. Support your answer by graphing f. f(x) = 1
Graph y = f(x) by hand by first plotting points to determine the shape of the graph. f(x) = x - 2
Graph y = f(x) by hand by first plotting points to determine the shape of the graph. f(x) = 3 + 2x
Graph y = f(x) by hand by first plotting points to determine the shape of the graph. f(x) = 2 - 2x
Determine if f is a linear or nonlinear function. If f is a linear function, determine if f is a con- stant function. Support your answer by graphing f. f(x) = 3x - 2
Determine if f is a linear or nonlinear function. If f is a linear function, determine if f is a con- stant function. Support your answer by graphing f. f(x) = -2x + 5
Graph y = f(x) by hand by first plotting points to determine the shape of the graph. f(x) = 4 = x
Graph y = f(x) by hand by first plotting points to determine the shape of the graph. f(x) = -2
Graph y = f(x) by hand by first plotting points to determine the shape of the graph. f(x) = x + 1
Graph y = f(x) by hand by first plotting points to determine the shape of the graph. f(x) = 2x
Graph y = f(x) by hand by first plotting points to determine the shape of the graph. f(x) = 3
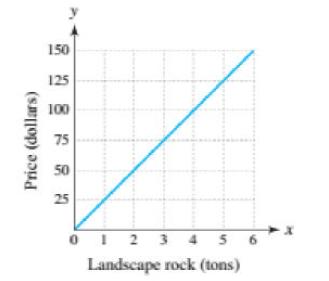
The figure shows the price of x tons of landscape rock.(a) Why is it reasonable for the graph to pass through the origin? (b) Find the slope of the graph. (c) Interpret the slope as a rate of change. Price (dollars) 150 125 100 75 50 25 0 1 2 3 4 5 Landscape rock (tons)
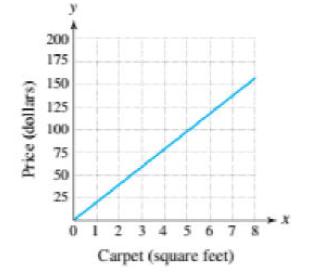
The graph shows the price of x square feet of carpeting. (a) Why is it reasonable for the graph to pass through the origin? (b) Find the slope of the graph.(c) Interpret the slope as a rate of change. Price (dollars) 200 175 150 125 100 75 50 25 012345678 Carpet (square feet)
Age in the United States The median age of the U.S. population for each year between 1970 and 2010 can be approximated by A(1) = 0.2431 - 450.8. (a) Compute the median ages in 1980 and 2000. (b) What is the slope of the graph of A? Interpret the slope.
Express the following in interval notation. {x|x = -5,x # 7}
State the slope of the graph of f. Explain what the slope indicates about the graph. f(x) = -³x
Express the following in interval notation. {x|x 1,x 6) # #
State the slope of the graph of f. Explain what the slope indicates about the graph. x = (x)ƒ
State the slope of the graph of f. Explain what the slope indicates about the graph. f(x) = 23
State the slope of the graph of f. Explain what the slope indicates about the graph. f(x) = 9-x
Velocity of a Train The distance D in miles that a train is from a station after x hours is given by the formula D(x) = 150 - 20x. (a) Calculate D(5) and interpret the result. (b) Find the slope of the graph of D. Interpret this slope as a rate of change.
A driver's distance D in miles from a rest stop after x hours is given by D(x) = 75x. (a) How far is the driver from the rest stop after 2 hours? (b) Find the slope of the graph of D. Interpret this slope as a rate of change.
Express the following in interval notation. {x\x4₁x 5}
State the slope of the graph of f. Explain what the slope indicates about the graph. f(x) = 6-x
Express the following in interval notation. {x|x -3x3)
State the slope of the graph of f. Explain what the slope indicates about the graph. f(x) = 2x + 7
If f(-2) = 3, identify a point on the graph of f.
A linear function f can be written in the form f(x) = mx + b. Identify m and b for the given f(x). f(x) = -6
Showing 12500 - 12600
of 13634
First
119
120
121
122
123
124
125
126
127
128
129
130
131
132
133
Last
Step by Step Answers