New Semester
Started
Get
50% OFF
Study Help!
--h --m --s
Claim Now
Question Answers
Textbooks
Find textbooks, questions and answers
Oops, something went wrong!
Change your search query and then try again
S
Books
FREE
Study Help
Expert Questions
Accounting
General Management
Mathematics
Finance
Organizational Behaviour
Law
Physics
Operating System
Management Leadership
Sociology
Programming
Marketing
Database
Computer Network
Economics
Textbooks Solutions
Accounting
Managerial Accounting
Management Leadership
Cost Accounting
Statistics
Business Law
Corporate Finance
Finance
Economics
Auditing
Tutors
Online Tutors
Find a Tutor
Hire a Tutor
Become a Tutor
AI Tutor
AI Study Planner
NEW
Sell Books
Search
Search
Sign In
Register
study help
mathematics
contemporary mathematics
Contemporary Mathematics 1st Edition OpenStax - Solutions
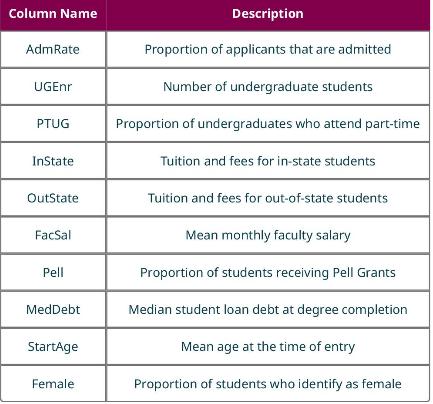
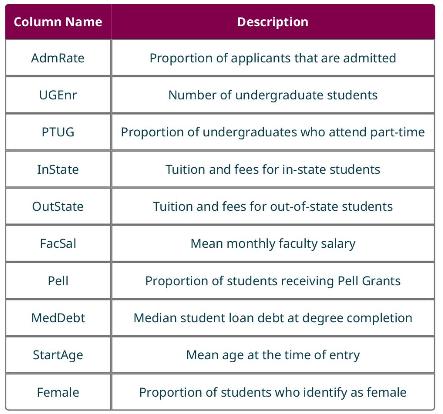
What mean starting age is at the first quartile?Use the data in "TNSchools" (https://openstax.org/r/Chapter8 Data-Sets), which has data on many institutions of higher education in the state of Tennessee. Here are what the columns represent: Column Name AdmRate Description Proportion of applicants
What mean starting age is at the 67 th percentile?Use the data in "TNSchools" (https://openstax.org/r/Chapter8 Data-Sets), which has data on many institutions of higher education in the state of Tennessee. Here are what the columns represent: Column Name AdmRate Description Proportion of applicants
What mean starting age is at the 35 th percentile?Use the data in "TNSchools" (https://openstax.org/r/Chapter8 Data-Sets), which has data on many institutions of higher education in the state of Tennessee. Here are what the columns represent: Column Name AdmRate Description Proportion of applicants
At what percentile is the University of the South for mean starting age?Use the data in "TNSchools" (https://openstax.org/r/Chapter8 Data-Sets), which has data on many institutions of higher education in the state of Tennessee. Here are what the columns represent: Column Name AdmRate Description
At what percentile is Lincoln Memorial University for mean starting age?Use the data in "TNSchools" (https://openstax.org/r/Chapter8 Data-Sets), which has data on many institutions of higher education in the state of Tennessee. Here are what the columns represent: Column Name AdmRate Description
At what percentile is the University of Tennessee-Chattanooga for mean starting age?Use the data in "TNSchools" (https://openstax.org/r/Chapter8 Data-Sets), which has data on many institutions of higher education in the state of Tennessee. Here are what the columns represent: Column Name AdmRate
What proportion of students who identify as female is at the third quintile?Use the data in "TNSchools" (https://openstax.org/r/Chapter8 Data-Sets), which has data on many institutions of higher education in the state of Tennessee. Here are what the columns represent: Column Name AdmRate
What proportion of students who identify as female is at the 12th percentile?Use the data in "TNSchools" (https://openstax.org/r/Chapter8 Data-Sets), which has data on many institutions of higher education in the state of Tennessee. Here are what the columns represent: Column Name AdmRate
What proportion of students who identify as female is at the 85th percentile?Use the data in "TNSchools" (https://openstax.org/r/Chapter8 Data-Sets), which has data on many institutions of higher education in the state of Tennessee. Here are what the columns represent: Column Name AdmRate
At what percentile is Martin Methodist College for proportion of students who identify as female?Use the data in "TNSchools" (https://openstax.org/r/Chapter8 Data-Sets), which has data on many institutions of higher education in the state of Tennessee. Here are what the columns represent: Column
At what percentile is Tennessee Technological University for proportion of students who identify as female?Use the data in "TNSchools" (https://openstax.org/r/Chapter8 Data-Sets), which has data on many institutions of higher education in the state of Tennessee. Here are what the columns represent:
At what percentile is Maryville College for proportion of students who identify as female?Use the data in "TNSchools" (https://openstax.org/r/Chapter8 Data-Sets), which has data on many institutions of higher education in the state of Tennessee. Here are what the columns represent: Column Name
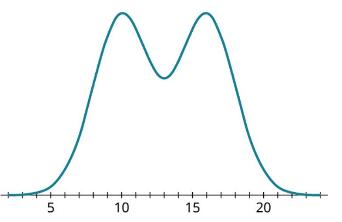
Explain how you can tell the histogram does NOT represent normally distributed data. 5 10 15 20
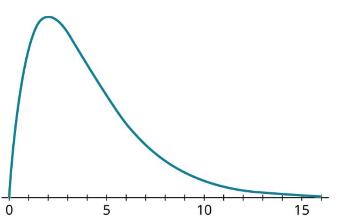
Explain how you can tell the histogram does NOT represent normally distributed data. 0 5 10 10 15
What proportion of the data fall between 95 and 105 ?Use the 68-95-99.7 Rule to answer the given questions about normally distributed data with mean 100 and standard deviation 5.
What proportion of the data fall between 90 and 110 ?Use the 68-95-99.7 Rule to answer the given questions about normally distributed data with mean 100 and standard deviation 5.
what proportion of the data fall between 85 and 100 ?Use the 68-95-99.7 Rule to answer the given questions about normally distributed data with mean 100 and standard deviation 5.
What proportion of the data fall between 110 and 120 ?Use the 68-95-99.7 Rule to answer the given questions about normally distributed data with mean 100 and standard deviation 5.
What proportion of the data are less than 90 ?Use the 68-95-99.7 Rule to answer the given questions about normally distributed data with mean 100 and standard deviation 5.
What proportion of the data are greater than 105 ?Use the 68-95-99.7 Rule to answer the given questions about normally distributed data with mean 100 and standard deviation 5.
What proportion of the data fall between 90 and 105 ?Use the 68-95-99.7 Rule to answer the given questions about normally distributed data with mean 100 and standard deviation 5.
What proportion of the data are between 95 and 115 ?Use the 68-95-99.7 Rule to answer the given questions about normally distributed data with mean 100 and standard deviation 5.
What proportion of the data are less than 7 ?Use the 68-95-99.7 Rule to answer the given questions about normally distributed data with mean 9 and standard deviation 1.
What proportion of the data are greater than 12 ?Use the 68-95-99.7 Rule to answer the given questions about normally distributed data with mean 9 and standard deviation 1.
What proportion of the data are between 6 and 12 ?Use the 68-95-99.7 Rule to answer the given questions about normally distributed data with mean 9 and standard deviation 1.
What proportion of the data are between 8 and 9 ?Use the 68-95-99.7 Rule to answer the given questions about normally distributed data with mean 9 and standard deviation 1.
What proportion of the data are between 6 and 8 ?Use the 68-95-99.7 Rule to answer the given questions about normally distributed data with mean 9 and standard deviation 1.
What proportion of the data are between 8 and 11 ?Use the 68-95-99.7 Rule to answer the given questions about normally distributed data with mean 9 and standard deviation 1.
What proportion of the data are less than 10 ?Use the 68-95-99.7 Rule to answer the given questions about normally distributed data with mean 9 and standard deviation 1.
What proportion of the data are greater than 6 ?Use the 68-95-99.7 Rule to answer the given questions about normally distributed data with mean 9 and standard deviation 1.
\(x=17\)Convert the given data values to standardized scores. Assume the data are distributed normally with mean 15 and standard deviation 3 . Round to the nearest hundredth.
\(x=11\)Convert the given data values to standardized scores. Assume the data are distributed normally with mean 15 and standard deviation 3 . Round to the nearest hundredth.
\(x=10\)Convert the given data values to standardized scores. Assume the data are distributed normally with mean 15 and standard deviation 3 . Round to the nearest hundredth.
\(x=21\)Convert the given data values to standardized scores. Assume the data are distributed normally with mean 15 and standard deviation 3 . Round to the nearest hundredth.
\(x=16\)Convert the given data values to standardized scores. Assume the data are distributed normally with mean 15 and standard deviation 3 . Round to the nearest hundredth.
\(x=24\)Convert the given data values to standardized scores. Assume the data are distributed normally with mean 15 and standard deviation 3 . Round to the nearest hundredth.
\(x=8\)Convert the given data values to standardized scores. Assume the data are distributed normally with mean 15 and standard deviation 3 . Round to the nearest hundredth.
\(x=7.2\)Convert the given data values to standardized scores. Assume the data are distributed normally with mean 15 and standard deviation 3 . Round to the nearest hundredth.
\(z=1.2\)Convert the given \(z\)-scores to data values. Assume the data are distributed normally with mean 15 and standard deviation 3.
\(z=-0.4\)Convert the given \(z\)-scores to data values. Assume the data are distributed normally with mean 15 and standard deviation 3.
\(z=3.6\)Convert the given \(z\)-scores to data values. Assume the data are distributed normally with mean 15 and standard deviation 3.
\(z=2.1\)Convert the given \(z\)-scores to data values. Assume the data are distributed normally with mean 15 and standard deviation 3.
\(z=-2.8\)Convert the given \(z\)-scores to data values. Assume the data are distributed normally with mean 15 and standard deviation 3.
\(z=4\)Convert the given \(z\)-scores to data values. Assume the data are distributed normally with mean 15 and standard deviation 3.
\(z=-0.4\)Convert the given \(z\)-scores to data values. Assume the data are distributed normally with mean 15 and standard deviation 3.
\(z=-3.4\)Convert the given \(z\)-scores to data values. Assume the data are distributed normally with mean 15 and standard deviation 3.
At what percentile is \(x=225\) ?Answer the question about normally distributed data with mean 200 and standard deviation 20. Round percentiles to the nearest whole number and round data values to the nearest tenth.
At what percentile is \(x=184\) ?Answer the question about normally distributed data with mean 200 and standard deviation 20.Round percentiles to the nearest whole number and round data values to the nearest tenth.
At what percentile is \(x=192\) ?Answer the question about normally distributed data with mean 200 and standard deviation 20.Round percentiles to the nearest whole number and round data values to the nearest tenth.
At what percentile is \(x=206\) ?Answer the question about normally distributed data with mean 200 and standard deviation 20.Round percentiles to the nearest whole number and round data values to the nearest tenth.
At what percentile is \(x=239\) ?Answer the question about normally distributed data with mean 200 and standard deviation 20.Round percentiles to the nearest whole number and round data values to the nearest tenth.
At what percentile is \(x=202\) ?Answer the question about normally distributed data with mean 200 and standard deviation 20.Round percentiles to the nearest whole number and round data values to the nearest tenth.
At what percentile is \(x=190\) ?Answer the question about normally distributed data with mean 200 and standard deviation 20.Round percentiles to the nearest whole number and round data values to the nearest tenth.
At what percentile is \(x=175\) ?Answer the question about normally distributed data with mean 200 and standard deviation 20.Round percentiles to the nearest whole number and round data values to the nearest tenth.
What data value is at the 40 th percentile?Answer the question about normally distributed data with mean 200 and standard deviation 20.Round percentiles to the nearest whole number and round data values to the nearest tenth.
What data value is at the 10 th percentile?Answer the question about normally distributed data with mean 200 and standard deviation 20.Round percentiles to the nearest whole number and round data values to the nearest tenth.
What data value is at the 55 th percentile?Answer the question about normally distributed data with mean 200 and standard deviation 20.Round percentiles to the nearest whole number and round data values to the nearest tenth.
What data value is at the 95 th percentile?Answer the question about normally distributed data with mean 200 and standard deviation 20.Round percentiles to the nearest whole number and round data values to the nearest tenth.
What data value is at the 33rd percentile?Answer the question about normally distributed data with mean 200 and standard deviation 20.Round percentiles to the nearest whole number and round data values to the nearest tenth.
What data value is at the third quartile?Answer the question about normally distributed data with mean 200 and standard deviation 20.Round percentiles to the nearest whole number and round data values to the nearest tenth.
What data value is at the 65th percentile?Answer the question about normally distributed data with mean 200 and standard deviation 20.Round percentiles to the nearest whole number and round data values to the nearest tenth.
What data value is at the 99 th percentile?Answer the question about normally distributed data with mean 200 and standard deviation 20.Round percentiles to the nearest whole number and round data values to the nearest tenth.
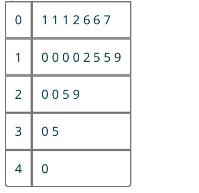
Find the mode.Use the steam-and-leaf plot below to answer the question. Round all answers to three decimal places. 0 1112667 1 00002559 2 0059 3 05 4 0
Find the median.Use the steam-and-leaf plot below to answer the question. Round all answers to three decimal places. 0 1112667 1 00002559 2 0059 3 05 4 0
Find the mean.Use the steam-and-leaf plot below to answer the question. Round all answers to three decimal places. 0 1112667 1 00002559 2 0059 3 05 4 0
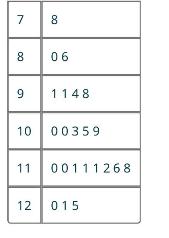
Find the mode.Use the stem-and-leaf plot below to answer the following question. Round all answers to three decimal places. 7 8 8 06 9 1148 10 10 00359 11 00111268 12 015
Find the median.Use the stem-and-leaf plot below to answer the following question. Round all answers to three decimal places. 7 8 8 06 9 1148 10 10 00359 11 00111268 12 015
Find the mean.Use the stem-and-leaf plot below to answer the following question. Round all answers to three decimal places. 7 8 8 06 9 1148 10 10 00359 11 00111268 12 015
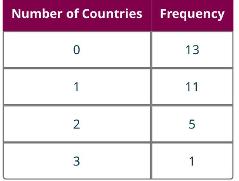
Find the mode of the number of countries visited.The following table shows the frequency distribution for a number of countries visited by students. Use this table to answer the questions, rounding all answers to three decimal places. Number of Countries Frequency 0 13 1 11 2 5 3 1
Find the median of the number of countries visited.The following table shows the frequency distribution for a number of countries visited by students. Use this table to answer the questions, rounding all answers to three decimal places. Number of Countries Frequency 0 13 1 11 2 5 3 1
Find the mean of the number of countries visited.The following table shows the frequency distribution for a number of countries visited by students. Use this table to answer the questions, rounding all answers to three decimal places. Number of Countries Frequency 0 13 1 11 2 5 3 1
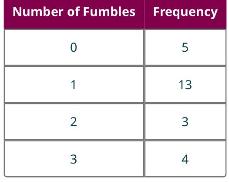
Find the mode of the number of fumbles.The following table shows the frequency distribution for the number of fumbles by a selection of football players. Use this table to answer the questions, rounding all answers to three decimal places. Number of Fumbles Frequency 0 5 1 13 2 3 3 4
Find the median of the number of fumbles.The following table shows the frequency distribution for the number of fumbles by a selection of football players. Use this table to answer the questions, rounding all answers to three decimal places. Number of Fumbles Frequency 0 5 1 13 2 3 3 4
Find the mean of the number of fumbles.The following table shows the frequency distribution for the number of fumbles by a selection of football players. Use this table to answer the questions, rounding all answers to three decimal places. Number of Fumbles Frequency 0 5 1 13 2 3 3 4
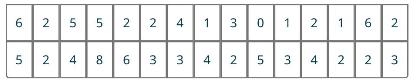
Compute the mode.A public opinion poll about an upcoming election asked respondents, "How many political advertisements do you recall seeing on television in the last 24 hours?" Use this data to answer the questions, rounding all answers to three decimal places. 6 2 5 5 2 2 4 1 3 0 1 2 1 6 2 5 2 4
Compute the median.A public opinion poll about an upcoming election asked respondents, "How many political advertisements do you recall seeing on television in the last 24 hours?" Use this data to answer the questions, rounding all answers to three decimal places. 6 2 5 5 2 2 4 1 3 0 1 2 1 6 2 5 2
Compute the mean.A public opinion poll about an upcoming election asked respondents, "How many political advertisements do you recall seeing on television in the last 24 hours?" Use this data to answer the questions, rounding all answers to three decimal places. 6 2 5 5 2 2 4 1 3 0 1 2 1 6 2 5 2 4
What is the mean undergraduate enrollment at these schools?Use the data found in "TNSchools" (https://openstax.org/r/Chapter8 Data-Sets), which has data on many institutions of higher education in the state of Tennessee. Here are what the columns represent: AdmRate UGEnr Column Name Description
What is the median undergraduate enrollment at these schools?Use the data found in "TNSchools" (https://openstax.org/r/Chapter8 Data-Sets), which has data on many institutions of higher education in the state of Tennessee. Here are what the columns represent: AdmRate UGEnr Column Name Description
Generate a histogram for undergraduate enrollment, and use it to describe the effect of the distribution on the mean and the median as measures of centrality.Use the data found in "TNSchools" (https://openstax.org/r/Chapter8 Data-Sets), which has data on many institutions of higher education in the
What is the mean proportion of part-time undergraduates at these schools?Use the data found in "TNSchools" (https://openstax.org/r/Chapter8 Data-Sets), which has data on many institutions of higher education in the state of Tennessee. Here are what the columns represent: AdmRate UGEnr Column Name
What is the median proportion of part-time undergraduates at these schools?Use the data found in "TNSchools" (https://openstax.org/r/Chapter8 Data-Sets), which has data on many institutions of higher education in the state of Tennessee. Here are what the columns represent: AdmRate UGEnr Column Name
Generate a histogram for proportion of part-time undergraduates, and use it to describe the effect of the distribution on the mean and the median as measures of centrality.Use the data found in "TNSchools" (https://openstax.org/r/Chapter8 Data-Sets), which has data on many institutions of higher
What is the mean of the monthly faculty salaries at these schools?Use the data found in "TNSchools" (https://openstax.org/r/Chapter8 Data-Sets), which has data on many institutions of higher education in the state of Tennessee. Here are what the columns represent: AdmRate UGEnr Column Name
What is the median of the monthly faculty salaries at these schools?Use the data found in "TNSchools" (https://openstax.org/r/Chapter8 Data-Sets), which has data on many institutions of higher education in the state of Tennessee. Here are what the columns represent: AdmRate UGEnr Column Name
Generate a histogram for the monthly faculty salaries, and use it to describe the effect of the distribution on the mean and the median as measures of centrality.Use the data found in "TNSchools" (https://openstax.org/r/Chapter8 Data-Sets), which has data on many institutions of higher education in
What is the mean of the average SAT scores?The dataset "AvgSAT" (https://openstax.org/r/Chapter8 Data-Sets) gives the average SAT score for incoming students (the use of "average" here stands in for "mean" to avoid confusion in the following problems) for every institution in the United States that
What is the median of the average SAT scores?The dataset "AvgSAT" (https://openstax.org/r/Chapter8 Data-Sets) gives the average SAT score for incoming students (the use of "average" here stands in for "mean" to avoid confusion in the following problems) for every institution in the United States
Construct a histogram of average SAT scores, and describe how the distribution affects the mean and the median.The dataset "AvgSAT" (https://openstax.org/r/Chapter8 Data-Sets) gives the average SAT score for incoming students (the use of "average" here stands in for "mean" to avoid confusion in the
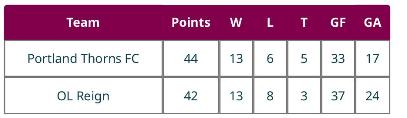
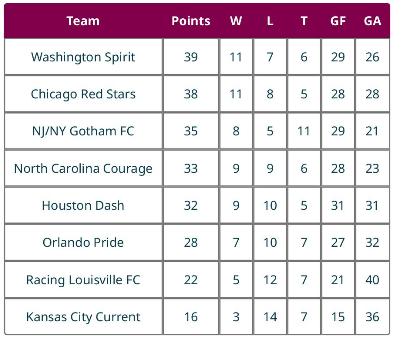
Compute the mode(s), median, and mean of points.Use the table, which gives the final results for the 2021 National Women's Soccer League season. The columns are standings points (PTS; teams earn three points for a win and one point for a tie), wins (W), losses (L), ties (T), goals scored by that
Compute the mode(s), median, and mean of wins.Use the table, which gives the final results for the 2021 National Women's Soccer League season. The columns are standings points (PTS; teams earn three points for a win and one point for a tie), wins (W), losses (L), ties (T), goals scored by that team
Compute the mode(s), median, and mean of losses.Use the table, which gives the final results for the 2021 National Women's Soccer League season. The columns are standings points (PTS; teams earn three points for a win and one point for a tie), wins (W), losses (L), ties (T), goals scored by that
Compute the mode(s), median, and mean of ties.Use the table, which gives the final results for the 2021 National Women's Soccer League season. The columns are standings points (PTS; teams earn three points for a win and one point for a tie), wins (W), losses (L), ties (T), goals scored by that team
Compute the mode(s), median, and mean of goals scored (GF).Use the table, which gives the final results for the 2021 National Women's Soccer League season. The columns are standings points (PTS; teams earn three points for a win and one point for a tie), wins (W), losses (L), ties (T), goals scored
Compute the mode(s), median, and mean of goals against (GA).Use the table, which gives the final results for the 2021 National Women's Soccer League season. The columns are standings points (PTS; teams earn three points for a win and one point for a tie), wins (W), losses (L), ties (T), goals
Compute the median and mean proportions of degrees awarded in Information Science.Use the data in "CUNY" (https://openstax.org/r/Chapter8 Data-Sets) (taken from data.ed.gov, which gives proportions of degrees awarded in various disciplines) to answer the given question.
Compute the median and mean proportions of degrees awarded in Education.Use the data in "CUNY" (https://openstax.org/r/Chapter8 Data-Sets) (taken from data.ed.gov, which gives proportions of degrees awarded in various disciplines) to answer the given question.
Compute the median and mean proportions of degrees awarded in Humanities.Use the data in "CUNY" (https://openstax.org/r/Chapter8 Data-Sets) (taken from data.ed.gov, which gives proportions of degrees awarded in various disciplines) to answer the given question.
Compute the median and mean proportions of degrees awarded in Biology.Use the data in "CUNY" (https://openstax.org/r/Chapter8 Data-Sets) (taken from data.ed.gov, which gives proportions of degrees awarded in various disciplines) to answer the given question.
Compute the median and mean proportions of degrees awarded in Physical Science.Use the data in "CUNY" (https://openstax.org/r/Chapter8 Data-Sets) (taken from data.ed.gov, which gives proportions of degrees awarded in various disciplines) to answer the given question.
Showing 2400 - 2500
of 6887
First
18
19
20
21
22
23
24
25
26
27
28
29
30
31
32
Last
Step by Step Answers