New Semester
Started
Get
50% OFF
Study Help!
--h --m --s
Claim Now
Question Answers
Textbooks
Find textbooks, questions and answers
Oops, something went wrong!
Change your search query and then try again
S
Books
FREE
Study Help
Expert Questions
Accounting
General Management
Mathematics
Finance
Organizational Behaviour
Law
Physics
Operating System
Management Leadership
Sociology
Programming
Marketing
Database
Computer Network
Economics
Textbooks Solutions
Accounting
Managerial Accounting
Management Leadership
Cost Accounting
Statistics
Business Law
Corporate Finance
Finance
Economics
Auditing
Tutors
Online Tutors
Find a Tutor
Hire a Tutor
Become a Tutor
AI Tutor
AI Study Planner
NEW
Sell Books
Search
Search
Sign In
Register
study help
mathematics
contemporary mathematics
Contemporary Mathematics 1st Edition OpenStax - Solutions
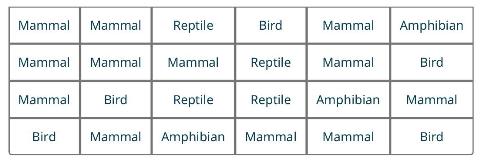
Create a pie chart of the data using technology.The medical office at a zoo tracks the animals it treats each week. The table shows the classifications for a particular week: Mammal Mammal Reptile Bird Mammal Amphibian Mammal Mammal Mammal Reptile Mammal Bird Mammal Bird Reptile Reptile Amphibian
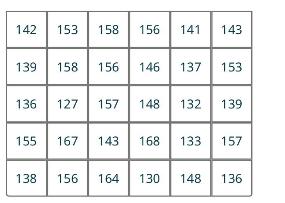
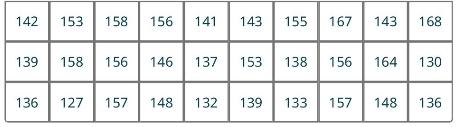
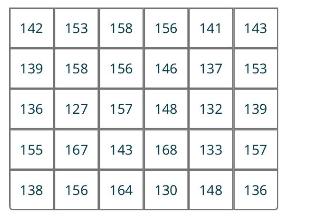
Make a stem-and-leaf plot of the data.Employees at a college help desk track the number of people who request assistance each week. The table gives a sample of the results: 142 153 158 156 141 143 139 158 156 146 137 153. 136 127 157 148 132 139 155 167 143 168 133 157 138 156 164 130 148 136
Create a histogram of the data. Use bins of width 5 .Employees at a college help desk track the number of people who request assistance each week. The table gives a sample of the results: 142 153 158 156 141 143 139 158 156 146 137 153. 136 127 157 148 132 139 155 167 143 168 133 157 138 156 164
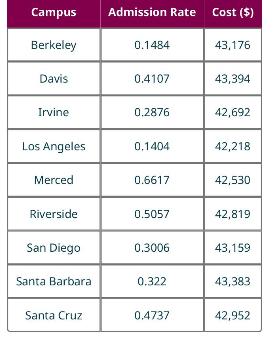
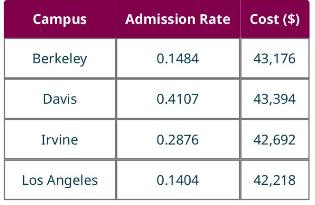
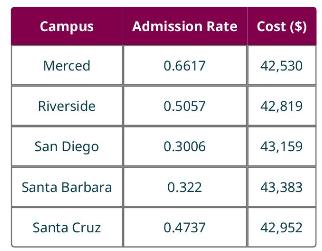
Create a bar graph that illustrates the differences in admission rates among the different campuses.The following are data on the admission rates of the different branch campuses in the University of California system, along with the out-of-state tuition and fee cost: Campus Admission Rate Cost ($)
Create two bar graphs for the out-of-state tuition. One should give an unbiased perception of the differences among them, and the other should overemphasize those differences.The following are data on the admission rates of the different branch campuses in the University of California system, along
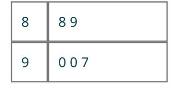
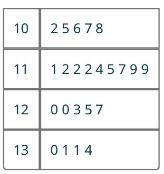
Use the given stem-and-leaf plot to determine the mode, median, and mean: 8 89 6 007
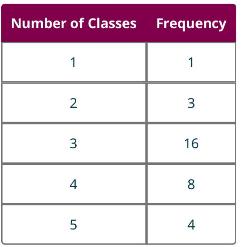
Find the mode of the number of classes.A survey of college students asked how many courses those students were currently taking. The results are summarized in this frequency distribution: Number of Classes Frequency 1 1 4 2 3 3 16 5 4 00 8
Find the median of the number of classes.A survey of college students asked how many courses those students were currently taking. The results are summarized in this frequency distribution: Number of Classes Frequency 1 1 4 2 3 3 16 5 4 00 8
Find the mean of the number of classes.A survey of college students asked how many courses those students were currently taking. The results are summarized in this frequency distribution: Number of Classes Frequency 1 1 4 2 3 3 16 5 4 00 8
Compute the mode.Employees at a college help desk track the number of people who request assistance each week, as recorded below: 142 153 158 156 141 143 155 167 143 168 139 158 156 146 137 153 138 156 164 130 136 127 157 148 132 139 133 157 148 136
Compute the median.Employees at a college help desk track the number of people who request assistance each week, as recorded below: 142 153 158 156 141 143 155 167 143 168 139 158 156 146 137 153 138 156 164 130 136 127 157 148 132 139 133 157 148 136
Compute the mean.Employees at a college help desk track the number of people who request assistance each week, as recorded below: 142 153 158 156 141 143 155 167 143 168 139 158 156 146 137 153 138 156 164 130 136 127 157 148 132 139 133 157 148 136
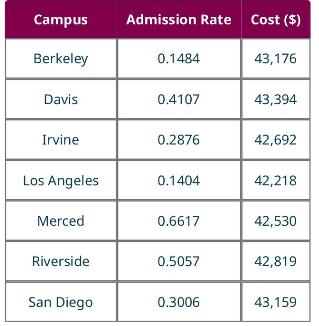
Compute the mode, median, and mean admission rate.The following table provides admission rates of the different branch campuses in the University of California system, along with the out-of-state tuition and fee cost: Campus Admission Rate Cost ($) Berkeley 0.1484 43,176 Davis 0.4107 43,394 Irvine
Compute the mode, median, and mean cost.The following table provides admission rates of the different branch campuses in the University of California system, along with the out-of-state tuition and fee cost: Campus Admission Rate Cost ($) Berkeley 0.1484 43,176 Davis 0.4107 43,394 Irvine 0.2876
Consider the data in "InState," (https://openstax.org/r/Chapter8 Data-Sets), which shows in-state tuition and fees for most institutions of higher learning in the United States. Compute the mode, median, and mean.
Workers for a particular company have complained that their wages are too low, while the management says wages are plenty high. If the company's salaries are right-skewed, which measure of centrality will the workers choose to represent salary? Which will management choose?
Given the data \(1,4,5,5\), and 10 , find the range.
Given the data \(1,4,5,5\), and 10 , find the standard deviation using the process outlined in the definition.
Compute the range.Employees at a college help desk track the number of people who request assistance each week, as listed below: 142 153 158 156 141 143 139 158 156 146 137 153 136 127 157 148 132 139 155 167 143 168 133 157 138 156 164 130 148 136
Compute the standard deviation.Employees at a college help desk track the number of people who request assistance each week, as listed below: 142 153 158 156 141 143 139 158 156 146 137 153 136 127 157 148 132 139 155 167 143 168 133 157 138 156 164 130 148 136
Compute the range of the admission rate.The following are data on the admission rates of the different branch campuses in the University of California system, along with the out-of-state tuition and fee cost. Campus Admission Rate Cost ($) Berkeley 0.1484 43,176 Davis 0.4107 43,394 Irvine 0.2876
Compute the standard deviation of the admission rate.The following are data on the admission rates of the different branch campuses in the University of California system, along with the out-of-state tuition and fee cost. Campus Admission Rate Cost ($) Berkeley 0.1484 43,176 Davis 0.4107 43,394
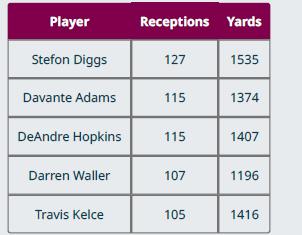
Range of the cost.Using the data from Table 8.21, find the: Player Receptions Yards Stefon Diggs 127 1535 Davante Adams 115 1374 DeAndre Hopkins 115 1407 Darren Waller 107 1196 Travis Kelce 105 1416
Standard deviation of the cost.Using the data from Table 8.21, find the: Player Receptions Yards Stefon Diggs 127 1535 Davante Adams 115 1374 DeAndre Hopkins 115 1407 Darren Waller 107 1196 Travis Kelce 105 1416
The value at the 30 th percentile Given the data \(10,12,14,18,21,23,24,25,29\), and 30 , compute the following without technology:
The value at the first quintile Given the data \(10,12,14,18,21,23,24,25,29\), and 30 , compute the following without technology:
At what percentile 29 falls Given the data \(10,12,14,18,21,23,24,25,29\), and 30 , compute the following without technology:
At what percentile 24 falls Given the data \(10,12,14,18,21,23,24,25,29\), and 30 , compute the following without technology:
How many wins is at the 30 th percentile?Use the dataset "MLB2019," (https://openstax.org/r/Chapter8 Data-Sets) which gives the number of wins for each Major League Baseball team in the 2019 season. Use Google Sheets to compute your answers.
How many wins is at the 90 th percentile?Use the dataset "MLB2019," (https://openstax.org/r/Chapter8 Data-Sets) which gives the number of wins for each Major League Baseball team in the 2019 season. Use Google Sheets to compute your answers.
How many wins is at the first quartile?Use the dataset "MLB2019," (https://openstax.org/r/Chapter8 Data-Sets) which gives the number of wins for each Major League Baseball team in the 2019 season. Use Google Sheets to compute your answers.
At what percentile are the Chicago Cubs (CHC, 84 wins)?Use the dataset "MLB2019," (https://openstax.org/r/Chapter8 Data-Sets) which gives the number of wins for each Major League Baseball team in the 2019 season. Use Google Sheets to compute your answers.
At what percentile are the Tampa Bay Rays (TBR, 96 wins)?Use the dataset "MLB2019," (https://openstax.org/r/Chapter8 Data-Sets) which gives the number of wins for each Major League Baseball team in the 2019 season. Use Google Sheets to compute your answers.
At what percentile are the Toronto Blue Jays (TOR, 67 wins)?Use the dataset "MLB2019," (https://openstax.org/r/Chapter8 Data-Sets) which gives the number of wins for each Major League Baseball team in the 2019 season. Use Google Sheets to compute your answers.
What percentage of the data falls between 76 and 124? Use the 68-95-99.7 Rule.Assume we're working with normally distributed data with mean 100 and standard deviation 12.
What percentage of the data falls between 100 and 112? Use the 68-95-99.7 Rule.Assume we're working with normally distributed data with mean 100 and standard deviation 12.
At what percentile does 112 fall? Use the 68-95-99.7 Rule.Assume we're working with normally distributed data with mean 100 and standard deviation 12.
What's the \(z\)-score of the data value 107 ? Round to three decimal places.Assume we're working with normally distributed data with mean 100 and standard deviation 12.
What data value's \(z\)-score is -2.4 ?Assume we're working with normally distributed data with mean 100 and standard deviation 12.
At what percentile does 107 fall? Use Google Sheets (or another technology).Assume we're working with normally distributed data with mean 100 and standard deviation 12.
What data value is at the 90th percentile? Use Google Sheets (or another technology), and round to the nearest hundredth.Assume we're working with normally distributed data with mean 100 and standard deviation 12.
At what percentile would an SAT score of 940 fall? Round to the nearest whole number.Recall that the SAT exam has mean 1060 and standard deviation 195, and that composite scores on the ACT have mean 21 and standard deviation 5.
What score would be at the 67 th percentile on the ACT?Recall that the SAT exam has mean 1060 and standard deviation 195, and that composite scores on the ACT have mean 21 and standard deviation 5.
Which is a better score: 1300 on the SAT or 27 on the ACT?Recall that the SAT exam has mean 1060 and standard deviation 195, and that composite scores on the ACT have mean 21 and standard deviation 5.
Suppose we flip a coin 120 times. What are the mean and standard deviation of the corresponding distribution of heads?Recall that if we flip a coin at least 20 times, the distribution of the number of heads is approximately normal with mean equal to half the number of flips and standard deviation
Let's say you flip 70 heads in 120 flips. At what percentile would that fall?Recall that if we flip a coin at least 20 times, the distribution of the number of heads is approximately normal with mean equal to half the number of flips and standard deviation equal to half of the square root of the
How many heads would be at the 30th percentile? Round to the nearest whole number.Recall that if we flip a coin at least 20 times, the distribution of the number of heads is approximately normal with mean equal to half the number of flips and standard deviation equal to half of the square root of
What tax revenue percentage falls at the third quartile? Answer this question using Google Sheets in two ways: using PERCENTILE and using NORM.INV.Use the data in "World Tax," (https://openstax.org/r/Chapter8 Data-Sets) which gives the tax revenue of many countries of the world in 2017, expressed
What tax revenue percentage falls at the 20th percentile? Answer this question using Google Sheets in two ways: using PERCENTILE and using NORM.INV.Use the data in "World Tax," (https://openstax.org/r/Chapter8 Data-Sets) which gives the tax revenue of many countries of the world in 2017, expressed
At what percentile does the United Kingdom ( \(25.62 \%\), found on row 46 in the spreadsheet) fall? Answer this question using Google Sheets in two ways: using PERCENTRANK and using NORM.DIST.Use the data in "World Tax," (https://openstax.org/r/Chapter8 Data-Sets) which gives the tax revenue of
At what percentile does Kiribati ( \(21.97 \%\), found on row 62 in the spreadsheet) fall? Answer this question using Google Sheets in two ways: using PERCENTRANK and using NORM.DIST.Use the data in "World Tax," (https://openstax.org/r/Chapter8 Data-Sets) which gives the tax revenue of many
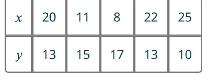
Make a scatter plot for the following data without technology: X 20 11 8 22 25 y 13 15 17 13 10
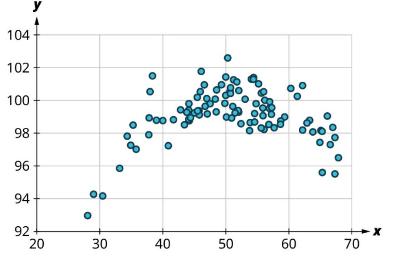
For the following problems, answer these questions:a. Is there a curved pattern in the data? If yes, stop here.b. Classify the strength and direction of the relationship. Make a guess at the value of \(r\). 104 102 100 98 96 y 94 92 20 30 40 50 50 60 60 70 x
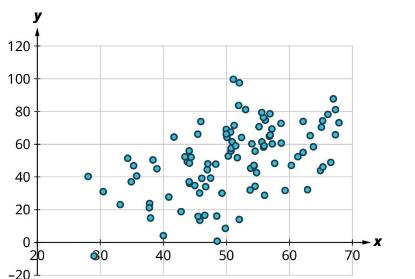
For the following problems, answer these questions:a. Is there a curved pattern in the data? If yes, stop here.b. Classify the strength and direction of the relationship. Make a guess at the value of \(r\). 120 100 8 8 8 40 20 0 20 60 40 50 -20 60 60 70 x
What's the correlation coefficient? Round to the nearest hundredth.Use the data in "MLB20190ff" (https://openstax.org/r/Chapter8_Data-Sets) to investigate the relationship between slugging percentage (SLG, explanatory) and runs scored (R, response).
What's the equation of the regression line? Round the slope and intercept to the nearest whole number.Use the data in "MLB20190ff" (https://openstax.org/r/Chapter8_Data-Sets) to investigate the relationship between slugging percentage (SLG, explanatory) and runs scored (R, response).
Predict the average monthly faculty salary for a school that charges \(\$ 30,000\) in out-of-state tuition.The regression equation used to predict average monthly faculty salary (FacSal) from out-of-state tuition (OutState) using the data in "TNSchools" (https://openstax.org/r/Chapter8 Data-Sets)
Maryville College charges \(\$ 34,880\) for out-of-state students, and their average monthly faculty salary is \(\$ 6,765\). Do they pay faculty more or less than expected? By how much?The regression equation used to predict average monthly faculty salary (FacSal) from out-of-state tuition
Write a sentence to interpret the slope.The regression equation used to predict average monthly faculty salary (FacSal) from out-of-state tuition (OutState) using the data in "TNSchools" (https://openstax.org/r/Chapter8 Data-Sets) is \(y=0.161 x+2645\)
For each of the following situations, identify whether the sample is a simple random sample, a systematic random sample, a stratified random sample, a cluster random sample, or none of these.1. A postal inspector wants to check on the performance of a new mail carrier, so she chooses four streets
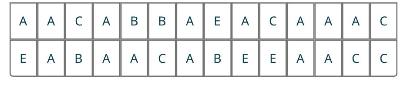
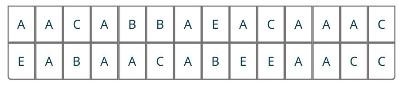
A teacher records the responses of the class (28 students) on the first question of a multiple choice quiz, with five possible responses ( \(A, B, C, D\), and \(E\) ):Create a categorical frequency distribution that organizes the responses. A A C A B B A E A C A A A C E A B A A C A B LL E E >>> A A
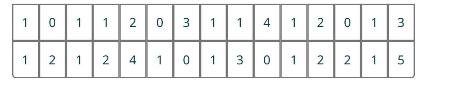
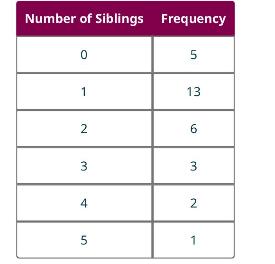
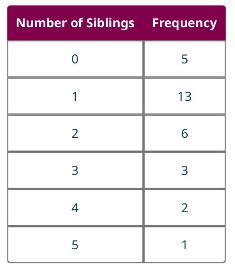
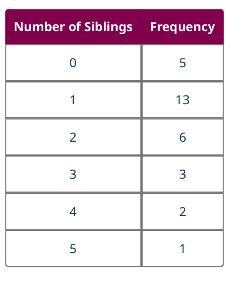
Attendees of a conflict resolution workshop are asked how many siblings they have. The responses are as follows:Create a frequency distribution to organize the responses. 1 0 1 1 2 0 3 1 1 4 1 2 0 1 3 1 2 1 2 4 1 0 1 3 0 1 2 2 1 5
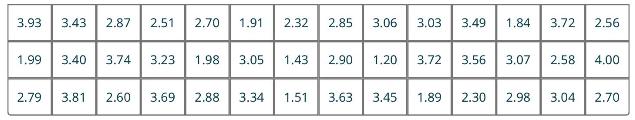
The GPAs of students enrolled in an advanced sociology class are listed in the following table. At this institution, 4.00 is the maximum possible GPA.Create a binned frequency distribution for the data. 3.93 3.43 2.87 2.51 2.70 1.91 2.32 2.85 3.06 3.03 3.49 1,84 3.72 2.56 1.99 3.40 3.74 3.23 1.98
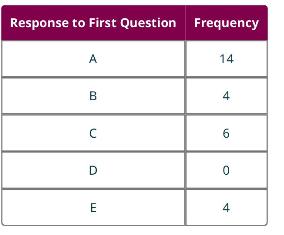
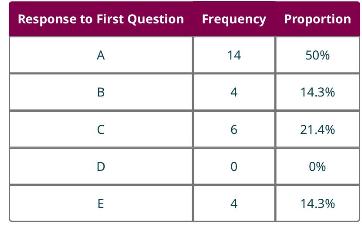
Recall Example 8.2, in which a teacher recorded the responses on the first question of a multiple choice quiz, with five possible responses (A, B, C, D, and E). The raw data was as follows:We computed a frequency distribution that looked like this:Proportion of a category \(=\) Category
In Example 8.5, we computed the following proportions:Draw a bar chart to visualize this frequency distribution.Data from Example 8.5Recall Example 8.2, in which a teacher recorded the responses on the first question of a multiple choice quiz, with five possible responses (A, B, C, D, and E). The
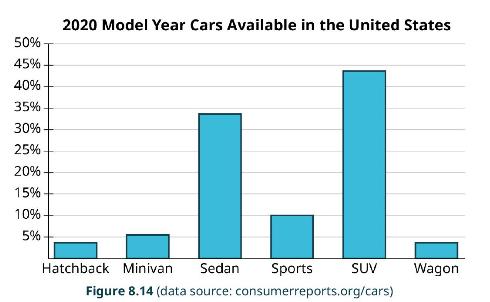
The bar graph shown gives data on 2020 model year cars available in the United States. Analyze the graph to answer the following questions.1. What proportion of available cars were sports cars?2. What proportion of available cars were sedans?3. Which categories of cars each made up less than \(5
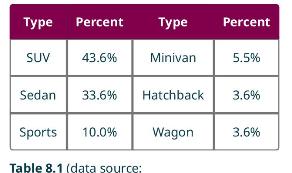
Use the data that follows to generate a pie chart. Type Percent Type Percent SUV 43.6% Minivan 5.5% Sedan 33.6% Hatchback 3.6% Sports 10.0% Wagon 3.6% Table 8.1 (data source:
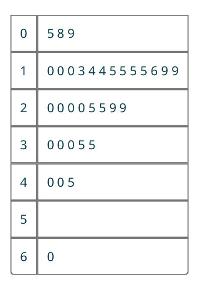
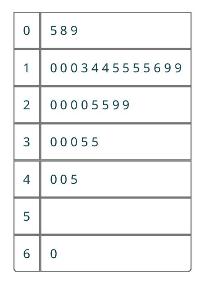
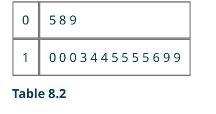
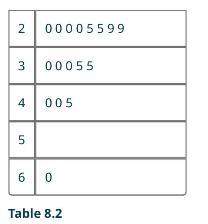
A collector of trading cards records the sale prices (in dollars) of a particular card on an online auction site, and puts the results in a stem-and-leaf plot:Answer the following questions about the data:1. How many prices are represented?2. What prices represent the five most expensive cards? The
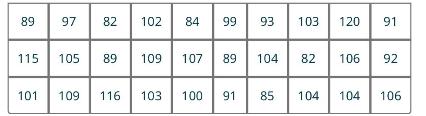
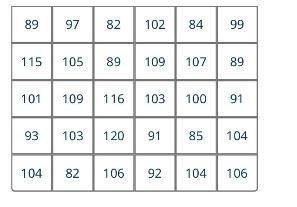
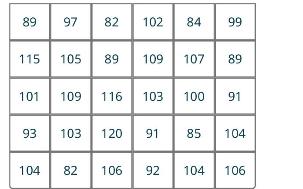
An entomologist studying crickets recorded the number of times different crickets (of differing species, genders, etc.) chirped in a one-minute span. The raw data are as follows:Construct a stem-and-leaf plot to visualize these results. 89 97 82 102 115 105 59 84 99 93 103 120 91 89 109 107 89 104
In Example 8.10, we built a stem-and-leaf plot for the number of chirps made by crickets in one minute. Here are the raw data that we used then:Construct a histogram to visualize these results.Data from Example 8.10An entomologist studying crickets recorded the number of times different crickets
The data in "AvgSAT" (https://openstax.org/r/Chapter8 Data-Sets) contains the average SAT score for students attending every institution of higher learning in the US for which data is available. Create a histogram in Google Sheets of the average SAT scores. Use bins of width 50 . Are the data
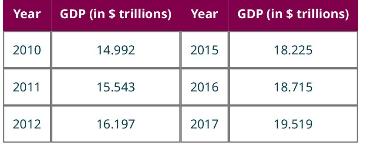
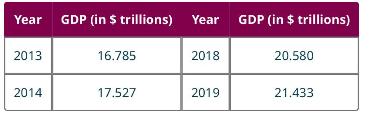
The following table shows the gross domestic product (GDP) for the United States for the years 2010 to 2019:Construct a histogram that represents these data. Year GDP (in $ trillions) Year GDP (in $ trillions) 2010 14.992 2015 18.225 2011 15.543 2016 18.715 2012 16.197 2017 19.519
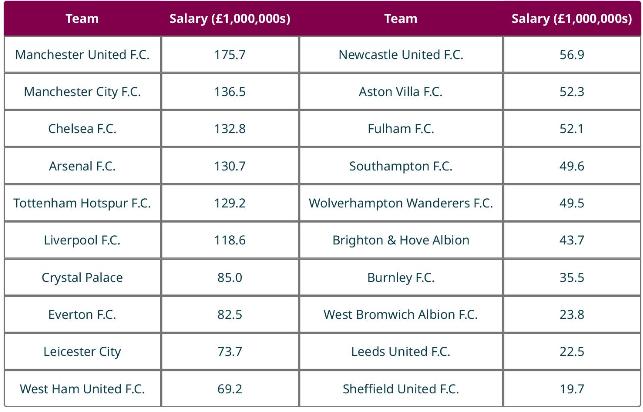
The table below shows the teams, and their payrolls, in the English Premier League, the top soccer organization in the United Kingdom.How might someone present this data in a misleading way? Team Salary (1,000,000s) Team Salary (1,000,000s) Manchester United F.C. 175.7 Newcastle United F.C. 56.9
In Example 8.9, we looked at a stem-and-leaf plot of the sale prices (in dollars) of a particular collectible trading card:What is the mode price?Data from Example 8.9A collector of trading cards records the sale prices (in dollars) of a particular card on an online auction site, and puts the
In Example 8.3, we created a frequency distribution of the number of siblings of conflict resolution class attendees.What is the mode of the number of siblings?Data from Example 8.3Attendees of a conflict resolution workshop are asked how many siblings they have. The responses are as follows:Create
In Example 8.9, we looked at a stem-and-leaf plot that contained 33 sale prices (in dollars) of a particular collectible trading card:What is the median price?Data from Example 8.9A collector of trading cards records the sale prices (in dollars) of a particular card on an online auction site, and
In Example 8.10, we looked at the number of times different crickets (of differing species, genders, etc.) chirped in a one minute span. That data is again provided below:Find the median.Data from Example 8.10An entomologist studying crickets recorded the number of times different crickets (of
In Example 8.3, we created a frequency distribution of the number of siblings of the people who attended a conflict resolution class. Let's review that data again:What is the median of the number of siblings?Data from Example 8.3Attendees of a conflict resolution workshop are asked how many
Compute the mean of the numbers \(12,15,17,18,18\), and 19.
Refer again to the frequency distribution of the number of siblings people who attended a conflict resolution class reported:What is the mean of the number of siblings? Number of Siblings Frequency 5 1 13 2 6 3 3 4 2 5 1
The dataset "InState" (https://openstax.org/r/Chapter8 Data-Sets) contains the in-state tuitions of every college and university in the country that reported that data to the Department of Education. Find the mode, median, and mean of those in-state tuition values.
For the following situations, decide which measure(s) of centrality would be best:1. You found a used car that you like, and you want to know if the price is too high or too low. You find a list of sale prices for that make and model, and you see that the distribution of those prices is skewed to
You survey some of your friends to find out how many hours they work each week. Their responses are: \(5,20,8,10,35\), 12. What is the range?
The data in "AvgSAT" (https://openstax.org/r/Chapter8 Data-Sets) contains the average SAT score for students attending every institution of higher learning in the US for which data is available. What is the range of these average SAT scores?
You surveyed some of your friends to find out how many hours they work each week. Their responses were: \(5,20,8,10\), 35,12 . What is the standard deviation?
The data in "AvgSAT" (https://openstax.org/r/Chapter8 Data-Sets) contains the average SAT score for students attending every institution of higher learning in the US for which data is available. What is the standard deviation of these average SAT scores?
Consider the dataset \(5,8,12,1,2,16,2,15,20,22\).1. At what percentile is the value 5 ?2. What value is at the 60 th percentile?
The data in "AvgSAT" (https://openstax.org/r/Chapter8 Data-Sets) contains the average SAT score for students attending every institution of higher learning in the US for which data is available.1. What score is at the 3rd quartile?2. What score is at the 40 th percentile?3. At what percentile is
The dataset "InState" (https://openstax.org/r/Chapter8 Data-Sets) contains the in-state tuitions of every college and university in the country that reported that data to the Department of Education. Use that dataset to answer these questions.1. What tuition is at the second quintile?2. What
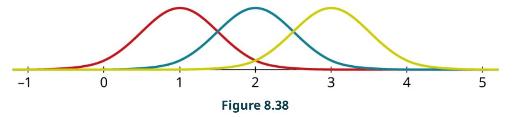
This graph shows three normal distributions. What are their means? -1 1 2 Figure 8.38 3 4 5
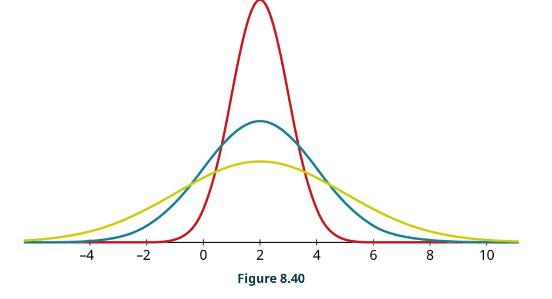
This graph shows three distributions, all with mean 2 . What are their standard deviations? Figure 8.40 4 -2 0 2 60 8 10 10
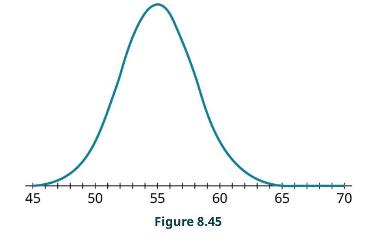
Using the graph, identify the mean and standard deviation of the normal distribution. 45 50 55 60 65 70 Figure 8.45
1. If data are normally distributed with mean 8 and standard deviation 2 , what percent of the data falls between 4 and \(12 ?\)2. If data are normally distributed with mean 25 and standard deviation 5 , what percent of the data falls between 20 and 30 ?3. If data are normally distributed with mean
1. If data are distributed normally with mean 100 and standard deviation 20 , between what two values will \(68 \%\) of the data fall?2. If data are distributed normally with mean 0 and standard deviation 15 , between what two values will \(95 \%\) of the data fall?3. If data are distributed
Assume that we have data that are normally distributed with mean 80 and standard deviation 3.1. What proportion of the data will be greater than 86 ?2. What proportion of the data will be between 74 and 77 ?3. What proportion of the data will be between 74 and 83 ?
Suppose we have data that are normally distributed with mean 50 and standard deviation 6. Compute the standardized scores (rounded to three decimal places) for these data values:1. 52 2. 40 3. 68
Suppose we have data that are normally distributed with mean 10 and standard deviation 2. Convert the following standardized scores into data values.1. 1.4 2. -0.9 3. 3.5
Suppose we have data that are normally distributed with mean 28 and standard deviation 4. At what percentile do each of the following data values fall?1. 30 2. 23 3. 35
Suppose we have data that are normally distributed with mean 47 and standard deviation 9. Find the data values (rounded to the nearest tenth) corresponding to these percentiles:1. 75th (that's the third quartile)2. 12 th 3. 90 th
According to the Digest of Education Statistics (https://openstax.org/r/nces ed gov), composite scores on the SAT have mean 1060 and standard deviation 195, while composite scores on the ACT have mean 21 and standard deviation 5.1. At what percentile would an SAT score of 990 fall?2. What is the
Showing 2200 - 2300
of 6887
First
16
17
18
19
20
21
22
23
24
25
26
27
28
29
30
Last
Step by Step Answers