New Semester
Started
Get
50% OFF
Study Help!
--h --m --s
Claim Now
Question Answers
Textbooks
Find textbooks, questions and answers
Oops, something went wrong!
Change your search query and then try again
S
Books
FREE
Study Help
Expert Questions
Accounting
General Management
Mathematics
Finance
Organizational Behaviour
Law
Physics
Operating System
Management Leadership
Sociology
Programming
Marketing
Database
Computer Network
Economics
Textbooks Solutions
Accounting
Managerial Accounting
Management Leadership
Cost Accounting
Statistics
Business Law
Corporate Finance
Finance
Economics
Auditing
Tutors
Online Tutors
Find a Tutor
Hire a Tutor
Become a Tutor
AI Tutor
AI Study Planner
NEW
Sell Books
Search
Search
Sign In
Register
study help
mathematics
contemporary mathematics
Contemporary Mathematics 1st Edition OpenStax - Solutions
Let's say we flip a coin 64 times and count the number of heads.1. What would be the mean of the corresponding distribution?2. What would be the standard deviation of the corresponding distribution?3. Suppose we got 25 heads, which seems a little low. At what percentile would 25 heads fall?
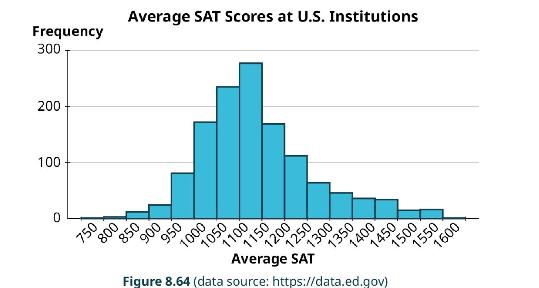
The data in "AvgSAT" (https://openstax.org/r/Chapter8 Data-Sets) contains the average SAT score for students attending every institution of higher learning in the United States for which data is available. In Example 8.12, we created a histogram for these data:This distribution is fairly symmetric
For each of the following pairs of related datasets, identify which (if any) should be assigned the role of response variable and which should be assigned to be the explanatory variable.1. A person's height and weight 2. A professional basketball player's salary and their average points scored per
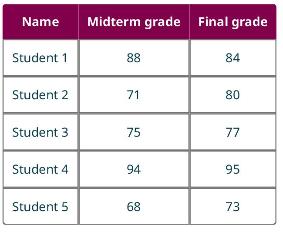
Students are exploring the relationship between scores on the midterm exam and final exam in their math course. Here are some of the scores reported by their classmates:Create a scatter plot to visualize the data. Name Midterm grade Final grade Student 1 88 84 Student 2 71 60 80 Student 3 75 77
The dataset "NHL19" (https://openstax.org/r/Chapter8 Data-Sets) gives the results of the 2018-2019 National Hockey League season. The columns are team, wins (W), losses (L), overtime losses (OTL), total points (PTS), goals scored by the team (GF), goals scored against the team (GA), and goal
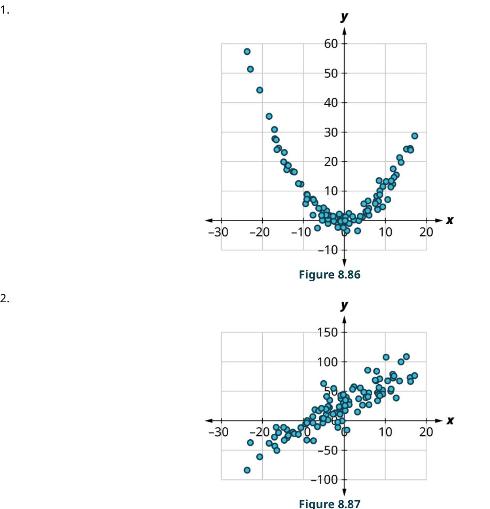
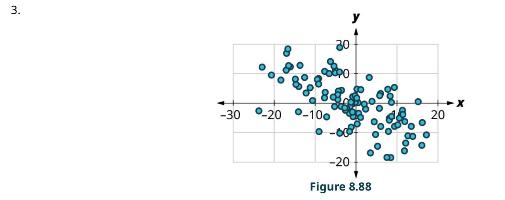
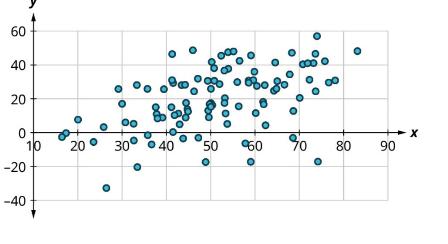
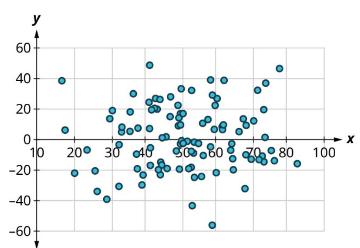
Consider the four scatter plots below:For each of these, answer the following questions:a. Is there a curved pattern in the data? If yes, stop here. If no, continue to part b.b. Classify the strength and direction of the relationship. Make a guess at the value of \(r\). 1. 2. 0 60 00 50 20 40 30
The data that were plotted in the previous example can be found in the dataset "correlationcoefficient1"(https://openstax.org/r/Chapter8 Data-Sets). All of them share the same values for the explanatory variable \(x\). The four responses are labeled \(y 1\) through \(y 4\). Compute the correlation
Suppose you have datasets \(x\) and \(y\) with the following statistics: \(x\) has mean 21 and standard deviation 4, \(y\) has mean 8 and standard deviation 2 , and their correlation coefficient is -0.4 . What's the equation of the regression line?
In Example 8.46, we considered the relationship between goals scored (GF) and goals against (GA) using the dataset "NHL19" (https://openstax.org/r/Chapter8 Data-Sets). Recreate the scatter plot in Google Sheets, and use it to find the equation of the regression line.Data from Example 8.46The
The data in "MLB20190ff" (https://openstax.org/r/Chapter8 Data-Sets) gives offensive team stats for the 2019 Major League Baseball season. Use that dataset to answer the following questions:1. What is the equation of the regression line for runs (R) vs. hits \((H)\) ?2. How many runs would we
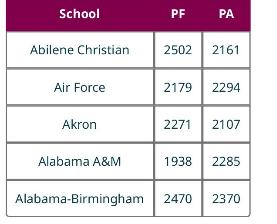
This table contains data for the first five schools (alphabetically) that fielded an NCAA Division I men's basketball team in the 2018-2019 season. It shows the total number of points each team scored (PF) and the total number of points their opponents scored against them (PA). Create a scatter
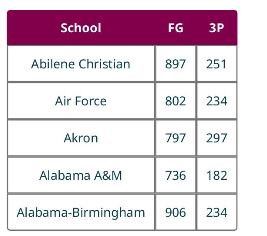
This table contains data for the first five schools (alphabetically) that fielded an NCAA Division I men's basketball team in the 2018-2019 season. It shows the total number of field goals each team scored (FG) and the total number of three-point field goals they scored (3P). Create a scatter plot
Use Google Sheets to create a scatter plot of points scored against a team (PA) vs. points scored by the team (PF).Use the data in "MBB2019" (https://openstax.org/r/Chapter8 Data-Sets), on every school that fielded an NCAA Division I men's basketball team in the 2018-2019 season.
Use Google Sheets to create a scatter plot of number of three-point field goals made (3P) vs. total field goals made (FG).Use the data in "MBB2019" (https://openstax.org/r/Chapter8 Data-Sets), on every school that fielded an NCAA Division I men's basketball team in the 2018-2019 season.
Use Google Sheets to create a scatter plot of number of fouls (Fouls) vs. number of blocks (BLK).Use the data in "MBB2019" (https://openstax.org/r/Chapter8 Data-Sets), on every school that fielded an NCAA Division I men's basketball team in the 2018-2019 season.
Use Google Sheets to create a scatter plot of points scored (PF) vs. percent of three-point shots made (3P\%).Use the data in "MBB2019" (https://openstax.org/r/Chapter8 Data-Sets), on every school that fielded an NCAA Division I men's basketball team in the 2018-2019 season.
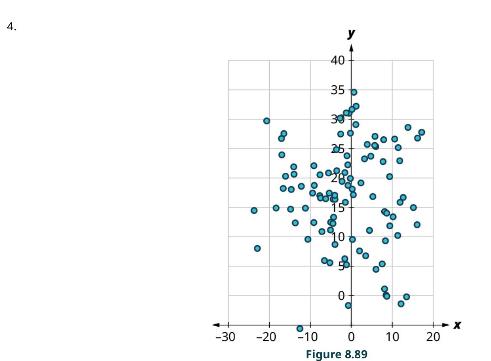
a. Is there a curved pattern in the data? If yes, stop here. If no, continue to part b.b. Classify the strength and direction of the relationship. Make a guess at the value of \(r\). 200 150 100 8080 880 50 0 10 20 20 30 40 50 60 60 70 80 -0 x 90 90
a. Is there a curved pattern in the data? If yes, stop here. If no, continue to part b.b. Classify the strength and direction of the relationship. Make a guess at the value of \(r\). 60 40 20 20 0 10 20 30 40 -20 -40 x 50 50 960 70 80 90
a. Is there a curved pattern in the data? If yes, stop here. If no, continue to part b.b. Classify the strength and direction of the relationship. Make a guess at the value of \(r\). 60 60 40 20 20 0 -20 800 10 20 30 40 -40 -60 x 80% 80 100 00
a. Is there a curved pattern in the data? If yes, stop here. If no, continue to part b.b. Classify the strength and direction of the relationship. Make a guess at the value of \(r\). 60 60 40 20 20 0 -20 800 10 20 30 40 -40 -60 x 80% 80 100 00
a. Is there a curved pattern in the data? If yes, stop here. If no, continue to part b.b. Classify the strength and direction of the relationship. Make a guess at the value of \(r\). 60 60 40 20 20 0 -20 800 10 20 30 40 -40 -60 x 80% 80 100 00
a. Is there a curved pattern in the data? If yes, stop here. If no, continue to part b.b. Classify the strength and direction of the relationship. Make a guess at the value of \(r\). 60 60 40 20 20 0 -20 800 10 20 30 40 -40 -60 x 80% 80 100 00
a. Is there a curved pattern in the data? If yes, stop here. If no, continue to part b.b. Classify the strength and direction of the relationship. Make a guess at the value of \(r\). 60 60 40 20 20 0 -20 800 10 20 30 40 -40 -60 x 80% 80 100 00
a. Is there a curved pattern in the data? If yes, stop here. If no, continue to part b.b. Classify the strength and direction of the relationship. Make a guess at the value of \(r\). 60 60 40 20 20 0 -20 800 10 20 30 40 -40 -60 x 80% 80 100 00
What is the correlation coefficient for points scored against a team (PA) vs. points scored by the team (PF)? Round to the nearest hundredth.Use the data in "MBB2019" (https://openstax.org/r/Chapter8 Data-Sets) on every school that fielded an NCAA Division I men'sbasketball team in the 2018-2019
What is the equation of the regression line for PA vs. PF?Use the data in "MBB2019" (https://openstax.org/r/Chapter8 Data-Sets) on every school that fielded an NCAA Division I men'sbasketball team in the 2018-2019 season.
Predict the total number of points scored against a team that itself scores 2200 points.Use the data in "MBB2019" (https://openstax.org/r/Chapter8 Data-Sets) on every school that fielded an NCAA Division I men'sbasketball team in the 2018-2019 season.
Georgia Tech scored 2091 points, and had 2130 points scored against them. Is their PA higher or lower than expected? By how much?Use the data in "MBB2019" (https://openstax.org/r/Chapter8 Data-Sets) on every school that fielded an NCAA Division I men'sbasketball team in the 2018-2019 season.
Write a sentence that interprets the slope of the regression line for PA vs. PF.Use the data in "MBB2019" (https://openstax.org/r/Chapter8 Data-Sets) on every school that fielded an NCAA Division I men'sbasketball team in the 2018-2019 season.
What is the correlation coefficient for three-point field goals made (3P) vs. total field goals made (FG)? Round to the nearest hundredth.Use the data in "MBB2019" (https://openstax.org/r/Chapter8 Data-Sets) on every school that fielded an NCAA Division I men'sbasketball team in the 2018-2019
What is the equation of the regression line for \(3 \mathrm{P}\) vs. \(\mathrm{FG}\) ?Use the data in "MBB2019" (https://openstax.org/r/Chapter8 Data-Sets) on every school that fielded an NCAA Division I men'sbasketball team in the 2018-2019 season.
How many three-point field goals made would you expect for a team that made 1000 total field goals?Use the data in "MBB2019" (https://openstax.org/r/Chapter8 Data-Sets) on every school that fielded an NCAA Division I men'sbasketball team in the 2018-2019 season.
Seton Hall made 888 field goals; of those, 240 were three-point field goals. Did they make more or fewer threepoint field goals than expected? How many more or fewer?Use the data in "MBB2019" (https://openstax.org/r/Chapter8 Data-Sets) on every school that fielded an NCAA Division I men'sbasketball
Write a sentence to interpret the slope of the regression line for 3 P vs. FG.Use the data in "MBB2019" (https://openstax.org/r/Chapter8 Data-Sets) on every school that fielded an NCAA Division I men'sbasketball team in the 2018-2019 season.
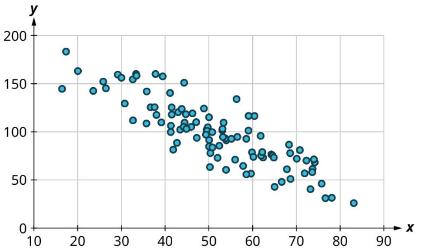
It might seem reasonable to expect the cost to attend a school to go down as the proportion of applicants admitted goes up. Create two scatter plots (one for private schools, one for public) to investigate that hunch. Can we use linear regression to describe that relationship for these? Why or why
Find the correlation between the 75th percentiles of the two sections of the SAT at public schools and at private schools. Which has a stronger relationship?Use the datasets "Public" (https://openstax.org/r/Chapter8 Data-Sets) and "Private" (https://openstax.org/r/Chapter8 Data-Sets), which give
What score would we predict falls at the 75th percentile on the verbal section of the SAT at a public school where the 75th percentile on the math section of the SAT is 500?Use the datasets "Public" (https://openstax.org/r/Chapter8 Data-Sets) and "Private" (https://openstax.org/r/Chapter8
What score would we predict falls at the 75th percentile on the verbal section of the SAT at a private school where the 75th percentile on the math section of the SAT is 500?Use the datasets "Public" (https://openstax.org/r/Chapter8 Data-Sets) and "Private" (https://openstax.org/r/Chapter8
Find the slope of the regression line that we would use to predict the 75th percentile SAT math score from the 75th percentile ACT English score at public schools, and write a sentence to interpret that slope.Use the datasets "Public" (https://openstax.org/r/Chapter8 Data-Sets) and "Private"
Predict the cost of attendance at a public school whose 75th percentile on the SAT verbal section is 700 .Use the datasets "Public" (https://openstax.org/r/Chapter8 Data-Sets) and "Private" (https://openstax.org/r/Chapter8 Data-Sets), which give many institutions of higher learning in the United
The cost of attendance at DePauw University, a private school, is \(\$ 62,567\). The 75 th percentile on the SAT math section is 680.Is DePauw more or less expensive that we would predict based on the SAT math score? By how much?Use the datasets "Public" (https://openstax.org/r/Chapter8 Data-Sets)
The cost of attendance at Coastal Carolina University, a public school, is \(\$ 24,599\). The 75 th percentile of ACT English scores at Coastal Carolina is 24.Is the cost higher or lower than we would expect based on the ACT English score? By how much?Use the datasets "Public"
Find the equation of the regression line that we would use to predict the 75th percentile ACT English score from the 75 th percentile ACT math score at public institutions.Use the datasets "Public" (https://openstax.org/r/Chapter8 Data-Sets) and "Private" (https://openstax.org/r/Chapter8
Find the equation of the regression line that we would use to predict cost of attendance at public schools using the 75th percentile ACT math score.Use the datasets "Public" (https://openstax.org/r/Chapter8 Data-Sets) and "Private" (https://openstax.org/r/Chapter8 Data-Sets), which give many
Does the University of Hawai'i at Hilo have a higher or lower 75th percentile verbal SAT score (590) than we'd expect based on its 75th percentile math SAT score (580)? By how much?Use the datasets "Public" (https://openstax.org/r/Chapter8 Data-Sets) and "Private" (https://openstax.org/r/Chapter8
Find the slope of the regression line we would use to estimate cost from the 75th percentile SAT math scores at public institutions. Write a sentence to interpret that slope.Use the datasets "Public" (https://openstax.org/r/Chapter8 Data-Sets) and "Private" (https://openstax.org/r/Chapter8
Find the slope of the regression line we would use to estimate cost from the 75th percentile SAT math scores at private institutions. Write a sentence to interpret that slope.Use the datasets "Public" (https://openstax.org/r/Chapter8 Data-Sets) and "Private" (https://openstax.org/r/Chapter8
Look at the scatter plots that show the relationship between cost and the 75th percentiles of the various test scores at private institutions. Which (if any) of the four exhibit a pattern that rules out analysis using linear regression?Use the datasets "Public" (https://openstax.org/r/Chapter8
Look at the scatter plots that show the relationship between cost and the 75th percentiles of the various test scores at public institutions. Which (if any) of the four exhibit a pattern that rules out analysis using linear regression?Use the datasets "Public" (https://openstax.org/r/Chapter8
Looking at public institutions, rank the four test scores from highest to lowest in terms of the strength of their relationships to cost.Use the datasets "Public" (https://openstax.org/r/Chapter8 Data-Sets) and "Private" (https://openstax.org/r/Chapter8 Data-Sets), which give many institutions of
What would be the \(z\)-score of a result of 322 on the \(A B C\) ?Assume we're looking at results from two different standardized tests. The first, called the ABC, has mean 250 and standard deviation 50.The second, called the XYZ, has mean 80 and standard deviation 10 .
What would be the \(z\)-score of a result of 57 on the XYZ?Assume we're looking at results from two different standardized tests. The first, called the ABC, has mean 250 and standard deviation 50.The second, called the XYZ, has mean 80 and standard deviation 10 .
At what percentile would a result of 211 on the \(A B C\) fall? Round your answer to the nearest percentile.Assume we're looking at results from two different standardized tests. The first, called the ABC, has mean 250 and standard deviation 50.The second, called the XYZ, has mean 80 and standard
At what percentile would a result of 94 on the XYZ fall? Round your answer to the nearest percentile.Assume we're looking at results from two different standardized tests. The first, called the ABC, has mean 250 and standard deviation 50.The second, called the XYZ, has mean 80 and standard
What score would fall at the first quartile on the \(A B C\) ? Round your answer to the nearest whole number.Assume we're looking at results from two different standardized tests. The first, called the ABC, has mean 250 and standard deviation 50.The second, called the XYZ, has mean 80 and standard
What score would fall at the 60th percentile on the XYZ? Round your answer to the nearest whole number.Assume we're looking at results from two different standardized tests. The first, called the ABC, has mean 250 and standard deviation 50.The second, called the XYZ, has mean 80 and standard
Which score is better: 202 on the ABC or 72 on the XYZ?Assume we're looking at results from two different standardized tests. The first, called the ABC, has mean 250 and standard deviation 50.The second, called the XYZ, has mean 80 and standard deviation 10 .
Which score is better: 324 on the ABC or 94 on the XYZ?Assume we're looking at results from two different standardized tests. The first, called the ABC, has mean 250 and standard deviation 50.The second, called the XYZ, has mean 80 and standard deviation 10 .
What would be the mean and standard deviation for the number of heads in 80 coin flips?Recall that if we flip a coin at least 20 times, the distribution of the number of heads is approximately normal with mean equal to half the number of flips and standard deviation equal to half of the square root
What would be the mean and standard deviation for the number of heads in 144 coin flips?Recall that if we flip a coin at least 20 times, the distribution of the number of heads is approximately normal with mean equal to half the number of flips and standard deviation equal to half of the square
How many heads would be at the 80th percentile for 80 coin flips? Round your answer to the nearest whole number.Recall that if we flip a coin at least 20 times, the distribution of the number of heads is approximately normal with mean equal to half the number of flips and standard deviation equal
How many heads would be at the 20th percentile for 144 coin flips? Round your answer to the nearest whole number.Recall that if we flip a coin at least 20 times, the distribution of the number of heads is approximately normal with mean equal to half the number of flips and standard deviation equal
What is the \(z\)-score for 51 heads in 80 coin flips? Round your answer to the nearest hundredth.Recall that if we flip a coin at least 20 times, the distribution of the number of heads is approximately normal with mean equal to half the number of flips and standard deviation equal to half of the
What is the \(z\)-score for 87 heads in 144 coin flips? Round your answer to the nearest hundredth.Recall that if we flip a coin at least 20 times, the distribution of the number of heads is approximately normal with mean equal to half the number of flips and standard deviation equal to half of the
Which would be more unusual: flipping 51 heads in 80 tries or flipping 87 heads in 144 tries? How do you know?Recall that if we flip a coin at least 20 times, the distribution of the number of heads is approximately normal with mean equal to half the number of flips and standard deviation equal to
Create a histogram of Yield to check that it's approximately normally distributed.Use the data in "Wheat," (https://openstax.org/r/Chapter8 Data-Sets) which gives the yield of wheat (in bushels) produced over several equally sized plots. (These data were collected as part of an experiment reported
Find the mean and standard deviation of Yield. Round answers to the nearest thousandth.Use the data in "Wheat," (https://openstax.org/r/Chapter8 Data-Sets) which gives the yield of wheat (in bushels) produced over several equally sized plots. (These data were collected as part of an experiment
What proportion of yields does the normal distribution predict should fall below 4.56 ? Round to the nearest thousandth.Use the data in "Wheat," (https://openstax.org/r/Chapter8 Data-Sets) which gives the yield of wheat (in bushels) produced over several equally sized plots. (These data were
At what percentile does the normal distribution predict a yield of 3.6 would fall? Round to the nearest whole number.Use the data in "Wheat," (https://openstax.org/r/Chapter8 Data-Sets) which gives the yield of wheat (in bushels) produced over several equally sized plots. (These data were collected
What yield does the normal distribution estimate would fall at the 80th percentile? Round to the nearest hundredth.Use the data in "Wheat," (https://openstax.org/r/Chapter8 Data-Sets) which gives the yield of wheat (in bushels) produced over several equally sized plots. (These data were collected
What yield does the normal distribution estimate would fall at the 95 th percentile? Round to the nearest hundredth.Use the data in "Wheat," (https://openstax.org/r/Chapter8 Data-Sets) which gives the yield of wheat (in bushels) produced over several equally sized plots. (These data were collected
If one of these plots yields 2.8 bushels, would that be a good or bad result? How do you know?Use the data in "Wheat," (https://openstax.org/r/Chapter8 Data-Sets) which gives the yield of wheat (in bushels) produced over several equally sized plots. (These data were collected as part of an
What data value is at the 10 th percentile?Use the following twenty data values to answer the questions without technology. \(1,4,6,7\), \(12,15,21,25,29,30,31,33,39,43,44,45,51,55,60,63\)
What data value is at the 55 th percentile?Use the following twenty data values to answer the questions without technology. \(1,4,6,7\), \(12,15,21,25,29,30,31,33,39,43,44,45,51,55,60,63\)
What data value is at the 90 th percentile?Use the following twenty data values to answer the questions without technology. \(1,4,6,7\), \(12,15,21,25,29,30,31,33,39,43,44,45,51,55,60,63\)
What data value is at the 30 th percentile?Use the following twenty data values to answer the questions without technology. \(1,4,6,7\), \(12,15,21,25,29,30,31,33,39,43,44,45,51,55,60,63\)
What data value is at the first quartile?Use the following twenty data values to answer the questions without technology. \(1,4,6,7\), \(12,15,21,25,29,30,31,33,39,43,44,45,51,55,60,63\)
What data value is at the third quintile?Use the following twenty data values to answer the questions without technology. \(1,4,6,7\), \(12,15,21,25,29,30,31,33,39,43,44,45,51,55,60,63\)
At what percentile is 29 ?Use the following twenty data values to answer the questions without technology. \(1,4,6,7\), \(12,15,21,25,29,30,31,33,39,43,44,45,51,55,60,63\)
At what percentile is 55 ?Use the following twenty data values to answer the questions without technology. \(1,4,6,7\), \(12,15,21,25,29,30,31,33,39,43,44,45,51,55,60,63\)
At what percentile is 4 ?Use the following twenty data values to answer the questions without technology. \(1,4,6,7\), \(12,15,21,25,29,30,31,33,39,43,44,45,51,55,60,63\)
At what percentile is 51 ?Use the following twenty data values to answer the questions without technology. \(1,4,6,7\), \(12,15,21,25,29,30,31,33,39,43,44,45,51,55,60,63\)
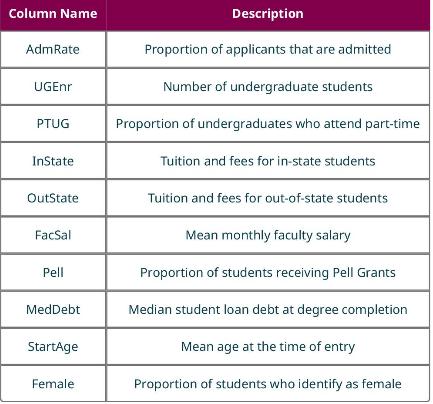
What admission rate is at the second quintile?Use the data in "TNSchools" (https://openstax.org/r/Chapter8 Data-Sets), which has data on many institutions of higher education in the state of Tennessee. Here are what the columns represent: Column Name AdmRate Description Proportion of applicants
What admission rate is at the 80 th percentile?Use the data in "TNSchools" (https://openstax.org/r/Chapter8 Data-Sets), which has data on many institutions of higher education in the state of Tennessee. Here are what the columns represent: Column Name AdmRate Description Proportion of applicants
What admission rate is at the 90 th percentile?Use the data in "TNSchools" (https://openstax.org/r/Chapter8 Data-Sets), which has data on many institutions of higher education in the state of Tennessee. Here are what the columns represent: Column Name AdmRate Description Proportion of applicants
At what percentile is East Tennessee State University for admission rate?Use the data in "TNSchools" (https://openstax.org/r/Chapter8 Data-Sets), which has data on many institutions of higher education in the state of Tennessee. Here are what the columns represent: Column Name AdmRate Description
At what percentile is Rhodes College for admission rate?Use the data in "TNSchools" (https://openstax.org/r/Chapter8 Data-Sets), which has data on many institutions of higher education in the state of Tennessee. Here are what the columns represent: Column Name AdmRate Description Proportion of
At what percentile is Freed-Hardeman University for admission rate?Use the data in "TNSchools" (https://openstax.org/r/Chapter8 Data-Sets), which has data on many institutions of higher education in the state of Tennessee. Here are what the columns represent: Column Name AdmRate Description
What proportion of part-time undergraduate enrollment is at the third quartile?Use the data in "TNSchools" (https://openstax.org/r/Chapter8 Data-Sets), which has data on many institutions of higher education in the state of Tennessee. Here are what the columns represent: Column Name AdmRate
What proportion of part-time undergraduate enrollment is at the 15 th percentile?Use the data in "TNSchools" (https://openstax.org/r/Chapter8 Data-Sets), which has data on many institutions of higher education in the state of Tennessee. Here are what the columns represent: Column Name AdmRate
What proportion of part-time undergraduate enrollment is at the 40 th percentile?Use the data in "TNSchools" (https://openstax.org/r/Chapter8 Data-Sets), which has data on many institutions of higher education in the state of Tennessee. Here are what the columns represent: Column Name AdmRate
At what percentile is Lee University for proportion of part-time undergraduate enrollment?Use the data in "TNSchools" (https://openstax.org/r/Chapter8 Data-Sets), which has data on many institutions of higher education in the state of Tennessee. Here are what the columns represent: Column Name
At what percentile is Fisk University for proportion of part-time undergraduate enrollment?Use the data in "TNSchools" (https://openstax.org/r/Chapter8 Data-Sets), which has data on many institutions of higher education in the state of Tennessee. Here are what the columns represent: Column Name
At what percentile is Middle Tennessee State University for proportion of part-time undergraduate enrollment?Use the data in "TNSchools" (https://openstax.org/r/Chapter8 Data-Sets), which has data on many institutions of higher education in the state of Tennessee. Here are what the columns
What median student loan debt is at the 10 th percentile?Use the data in "TNSchools" (https://openstax.org/r/Chapter8 Data-Sets), which has data on many institutions of higher education in the state of Tennessee. Here are what the columns represent: Column Name AdmRate Description Proportion of
What median student loan debt is at the fourth quintile?Use the data in "TNSchools" (https://openstax.org/r/Chapter8 Data-Sets), which has data on many institutions of higher education in the state of Tennessee. Here are what the columns represent: Column Name AdmRate Description Proportion of
What median student loan debt is at the 85 th percentile?Use the data in "TNSchools" (https://openstax.org/r/Chapter8 Data-Sets), which has data on many institutions of higher education in the state of Tennessee. Here are what the columns represent: Column Name AdmRate Description Proportion of
At what percentile is Carson-Newman College for median student loan debt?Use the data in "TNSchools" (https://openstax.org/r/Chapter8 Data-Sets), which has data on many institutions of higher education in the state of Tennessee. Here are what the columns represent: Column Name AdmRate Description
At what percentile is Austin Peay State University for median student loan debt?Use the data in "TNSchools" (https://openstax.org/r/Chapter8 Data-Sets), which has data on many institutions of higher education in the state of Tennessee. Here are what the columns represent: Column Name AdmRate
At what percentile is Belmont University for median student loan debt?Use the data in "TNSchools" (https://openstax.org/r/Chapter8 Data-Sets), which has data on many institutions of higher education in the state of Tennessee. Here are what the columns represent: Column Name AdmRate Description
Showing 2300 - 2400
of 6887
First
17
18
19
20
21
22
23
24
25
26
27
28
29
30
31
Last
Step by Step Answers