New Semester
Started
Get
50% OFF
Study Help!
--h --m --s
Claim Now
Question Answers
Textbooks
Find textbooks, questions and answers
Oops, something went wrong!
Change your search query and then try again
S
Books
FREE
Study Help
Expert Questions
Accounting
General Management
Mathematics
Finance
Organizational Behaviour
Law
Physics
Operating System
Management Leadership
Sociology
Programming
Marketing
Database
Computer Network
Economics
Textbooks Solutions
Accounting
Managerial Accounting
Management Leadership
Cost Accounting
Statistics
Business Law
Corporate Finance
Finance
Economics
Auditing
Tutors
Online Tutors
Find a Tutor
Hire a Tutor
Become a Tutor
AI Tutor
AI Study Planner
NEW
Sell Books
Search
Search
Sign In
Register
study help
mathematics
contemporary mathematics
Contemporary Mathematics 1st Edition OpenStax - Solutions
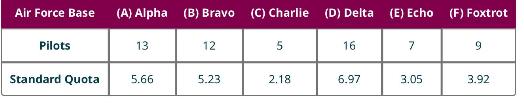
Determine the states' lower quotas and the states' upper quotas.Use this information: Air Force administration wanted to distribute 27 aircraft across 6 bases based on the number of qualified pilots stationed at those bases. The standard quota is 2.2963 . The standard quotas for each base are
Use Adams's method to apportion the aircraft.Use this information: Air Force administration wanted to distribute 27 aircraft across 6 bases based on the number of qualified pilots stationed at those bases. The standard quota is 2.2963 . The standard quotas for each base are listed in the table
Use Jefferson's method to apportion the aircraft.Use this information: Air Force administration wanted to distribute 27 aircraft across 6 bases based on the number of qualified pilots stationed at those bases. The standard quota is 2.2963 . The standard quotas for each base are listed in the table
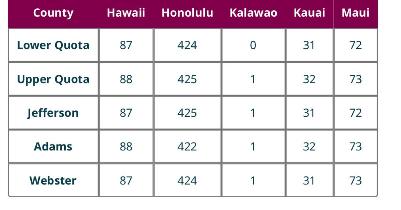
The apportionment of 616 schools to 5 Hawaiian counties by various methods is displayed in the table below.Use this information: Air Force administration wanted to distribute 27 aircraft across 6 bases based on the number of qualified pilots stationed at those bases. The standard quota is 2.2963 .
What is the standard divisor from the original apportionment?Use this information: The incorporated town of Orange Grove consists of two subdivisions: The Oaks with 1,254 residents, and The Villages with 10,746 residents. A council with 100 members supervises the municipality's operations. The
What is the new house size?Use this information: The incorporated town of Orange Grove consists of two subdivisions: The Oaks with 1,254 residents, and The Villages with 10,746 residents. A council with 100 members supervises the municipality's operations. The Hamilton method was used to apportion
Use the Hamilton method to reapportion the seats.Use this information: The incorporated town of Orange Grove consists of two subdivisions: The Oaks with 1,254 residents, and The Villages with 10,746 residents. A council with 100 members supervises the municipality's operations. The Hamilton method
Is the reapportionment an example of the new-states paradox? If so, how?Use this information: The incorporated town of Orange Grove consists of two subdivisions: The Oaks with 1,254 residents, and The Villages with 10,746 residents. A council with 100 members supervises the municipality's
States A, B, C, and D received \(21,25,26\), and 28 seats respectively. When the population remains the same, but house size is increased, the reapportionment is A 20, B 26, C 27, and D 29.Determine whether the reapportionment violates the Alabama paradox, the population paradox, or neither.
States \(A, B, C\), and \(D\) received \(21,25,26\), and 28 seats respectively. When the house size remains the same, the population of state \(A\) increased, the population of state \(B\) decreased, and the populations of states \(C\) and \(D\) remained the same, the reapportionment is A 20, B 26,
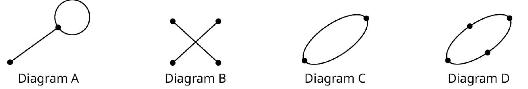
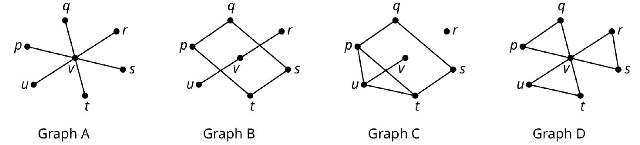
Identify any multigraphs.Use the figure showing Diagrams \(A, B, C\), and \(D\). Diagram A Diagram B Diagram C Diagram D
Identify any graphs.Use the figure showing Diagrams \(A, B, C\), and \(D\). Diagram A Diagram B Diagram C Diagram D
Identify any multigraph that has a loop.Use the figure showing Diagrams \(A, B, C\), and \(D\). Diagram A Diagram B Diagram C Diagram D
Identify any multigraph that has a double edge.Use the figure showing Diagrams \(A, B, C\), and \(D\). Diagram A Diagram B Diagram C Diagram D
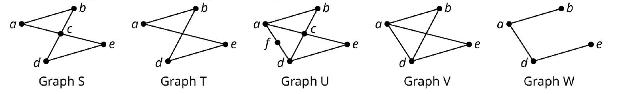
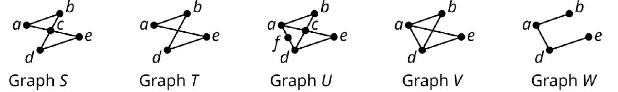
Determine the number of vertices in Graph \(T\).Use the figure showing Graphs \(S, T, U, V\), and \(W\). b d Graph S e Graph T e Graph U b a e Graph V e b Graph W e
Determine the number of vertices in Graph \(U\).Use the figure showing Graphs \(S, T, U, V\), and \(W\). b d Graph S e Graph T e Graph U b a e Graph V e b Graph W e
Identify the graph with the most vertices.Use the figure showing Graphs \(S, T, U, V\), and \(W\). b d Graph S e Graph T e Graph U b a e Graph V e b Graph W e
Identify the graphs with four vertices.Use the figure showing Graphs \(S, T, U, V\), and \(W\). b d Graph S e Graph T e Graph U b a e Graph V e b Graph W e
Identify the graph with the most edges.Use the figure showing Graphs \(S, T, U, V\), and \(W\). b d Graph S e Graph T e Graph U b a e Graph V e b Graph W e
Identify the graph with the fewest edges.Use the figure showing Graphs \(S, T, U, V\), and \(W\). b d Graph S e Graph T e Graph U b a e Graph V e b Graph W e
Name the vertices in Graph \(S\).Use the figure showing Graphs \(S, T, U, V\), and \(W\). b d Graph S e Graph T e Graph U b a e Graph V e b Graph W e
Name the vertices in Graph \(V\).Use the figure showing Graphs \(S, T, U, V\), and \(W\). b d Graph S e Graph T e Graph U b a e Graph V e b Graph W e
Determine the number of edges in Graph \(U\).Use the figure showing Graphs \(S, T, U, V\), and \(W\). b d Graph S e Graph T e Graph U b a e Graph V e b Graph W e
Determine the number of edges in Graph \(T\).Use the figure showing Graphs \(S, T, U, V\), and \(W\). b d Graph S e Graph T e Graph U b a e Graph V e b Graph W e
Name the edges in Graph \(V\).Use the figure showing Graphs \(S, T, U, V\), and \(W\). b d Graph S e Graph T e Graph U b a e Graph V e b Graph W e
Name the edges in Graph W.Use the figure showing Graphs \(S, T, U, V\), and \(W\). b d Graph S e Graph T e Graph U b a e Graph V e b Graph W e
Identify any pairs of vertices in Graph \(T\) that are not adjacent.Use the figure showing Graphs \(S, T, U, V\), and \(W\). b d Graph S e Graph T e Graph U b a e Graph V e b Graph W e
Identify any vertices in Graph \(V\) that are not adjacent.Use the figure showing Graphs \(S, T, U, V\), and \(W\). b d Graph S e Graph T e Graph U b a e Graph V e b Graph W e
Find the degree of vertex \(a\) in graph \(U\).Use the figure showing Graphs \(S, T, U, V\), and \(W\). b d Graph S e Graph T e Graph U b a e Graph V e b Graph W e
Find the degree of vertex \(a\) in graph \(S\).Use the figure showing Graphs \(S, T, U, V\), and \(W\). b d Graph S e Graph T e Graph U b a e Graph V e b Graph W e
Which two graphs have a vertex of degree 4?Use the figure showing Graphs \(S, T, U, V\), and \(W\). b d Graph S e Graph T e Graph U b a e Graph V e b Graph W e
Identify the graph with 1 vertex of degree 6 and 6 vertices of degree 1 .Use the figure showing Graphs \(A, B, C\), and \(D\). * Graph A S p. S Graph B Graph C S 9 Graph D S
Identify the graph with 1 vertex of degree 6 and 6 vertices of degree 2 .Use the figure showing Graphs \(A, B, C\), and \(D\). * Graph A S p. S Graph B Graph C S 9 Graph D S
Identify the graph with exactly 1 vertex of degree 0 .Use the figure showing Graphs \(A, B, C\), and \(D\). * Graph A S p. S Graph B Graph C S 9 Graph D S
Identify the graph with exactly 2 vertices of degree 1.Use the figure showing Graphs \(A, B, C\), and \(D\). * Graph A S p. S Graph B Graph C S 9 Graph D S
Name all the pairs of adjacent vertices in Graph \(B\).Use the figure showing Graphs \(A, B, C\), and \(D\). * Graph A S p. S Graph B Graph C S 9 Graph D S
Name all the pairs of adjacent vertices in Graph \(A\).Use the figure showing Graphs \(A, B, C\), and \(D\). * Graph A S p. S Graph B Graph C S 9 Graph D S
Identify the graph in which the sum of the degrees of the vertices is 14.Use the figure showing Graphs \(A, B, C\), and \(D\). * Graph A S p. S Graph B Graph C S 9 Graph D S
The Centers for Disease Control and Prevention (CDC) is tracking the spread of a virus. The CDC is attempting to determine where the virus began by identifying where each known carrier contracted the virus.A scenario is given. Explain how a graph or multigraph might be drawn to model the scenario
The faculty members in a college mathematics department have a "telephone tree" that assigns each faculty member two other faculty members to call with information in the event of an emergency. The chairperson of the department contacts two faculty members. Each of these faculty members contacts
There is a theory that any two people on earth are no more than six social connections apart, which is known as "six degrees of separation" or the "six handshake rule." It means that there is a chain of a "friend of a friend" that connects any two people through at most six steps.A scenario is
The U.S. Postal Service has a network of post offices that move mail around the United States. Mail trucks from one post office follow routes deliver mail to other locations. These mail trucks also pick up mail to bring back to their home post office.A scenario is given. Explain how a graph or
Draw a graph to model the scenario described in Your Turn 12.5.Draw a graph to represent the given scenario.
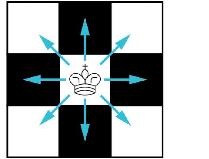
In the game of chess, a king can move one space in any direction, vertically, horizontally, or diagonally, as indicated in the figure. Draw a graph to represent the possible movements of a king on a three-by-three section of a chess board such that each edge represents one move, and each vertex
Chloe is interested to know how many in her network of Roblox friends are also friends with each other, so she polls them. The following is a list of each of Chloe's friends and their common friends. Create a graph of the Roblox friends in Chloe's network, including Chloe.- Aria is friends with no
List any graphs that are subgraphs of Graph \(U\).Use the figure to answer the following exercises. b b a a e e Graph S Graph T Graph U Graph V Graph W
List any graphs that are subgraphs of Graph \(V\).Use the figure to answer the following exercises. b b a a e e Graph S Graph T Graph U Graph V Graph W
Explain why Graph \(T\) is not a subgraph of Graph \(S\).Use the figure to answer the following exercises. b b a a e e Graph S Graph T Graph U Graph V Graph W
List any graphs that have a quadrilateral cyclic subgraph and name the quadrilaterals.Use the figure to answer the following exercises. b b a a e e Graph S Graph T Graph U Graph V Graph W
How many edges are in a graph if the sum of the degrees of its vertices is 18 .Use the Sum of Degrees Theorem as needed to answer the following exercises.
Draw two possible graphs to demonstrate that the sum of the degrees of the vertices in a graph with 7 edges is 14.Label the degrees of the vertices.Use the Sum of Degrees Theorem as needed to answer the following exercises.
What is the sum of the degrees of the vertices of a graph that has 122 edges?Use the Sum of Degrees Theorem as needed to answer the following exercises.
A graph has 3 vertices of degree 2,4 vertices of degree 1 , and 2 vertices of degree 3 . How many edges are in the graph?Use the Sum of Degrees Theorem as needed to answer the following exercises.
There are 6 vertices and 11 edges in a graph, 2 of degree 5,1 of degree 4 , and 2 of degree 3 . What is the degree of the remaining vertex?Use the Sum of Degrees Theorem as needed to answer the following exercises.
A complete graph has 5 vertices. What is the sum of the degrees of the vertices?Use the Sum of Degrees Theorem as needed to answer the following exercises.
A complete graph has 120 edges. How many vertices does it have?Use the Sum of Degrees Theorem as needed to answer the following exercises.
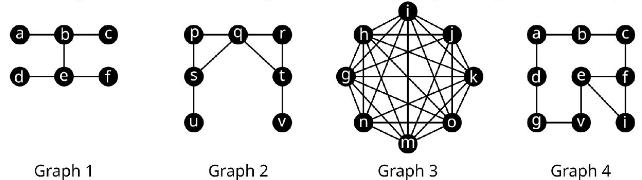
The sum of the degrees of the vertices is 16 .Use the figure to answer the following exercises. Identify the graph or graphs with the given characteristic. a b C p d f Graph 1 Graph 2 a b n m g Graph 3 Graph 4
The graph is complete.Use the figure to answer the following exercises. Identify the graph or graphs with the given characteristic. a b C p d f Graph 1 Graph 2 a b n m g Graph 3 Graph 4
The graph has no cyclic subgraphs Use the figure to answer the following exercises. Identify the graph or graphs with the given characteristic. a b C p d f Graph 1 Graph 2 a b n m g Graph 3 Graph 4
The graph contains at least one octagon.Use the figure to answer the following exercises. Identify the graph or graphs with the given characteristic. a b C p d f Graph 1 Graph 2 a b n m g Graph 3 Graph 4
The graph contains exactly two 3 -cycles.Use the figure to answer the following exercises. Identify the graph or graphs with the given characteristic. a b C p d f Graph 1 Graph 2 a b n m g Graph 3 Graph 4
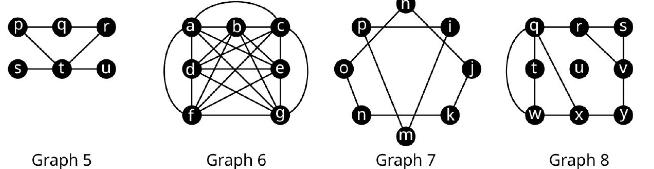
The graph is a subgraph of Graph 6.Use the figure to answer the following exercises. Identify the graph or graphs with the given characteristic. P q m k Graph 5 Graph 6 Graph 7 W y Graph 8
The sum of the degrees of the vertices is 16 .Use the figure to answer the following exercises. Identify the graph or graphs with the given characteristic. P q m k Graph 5 Graph 6 Graph 7 W y Graph 8
The graph is complete.Use the figure to answer the following exercises. Identify the graph or graphs with the given characteristic. P q m k Graph 5 Graph 6 Graph 7 W y Graph 8
The graph has no pentagons.Use the figure to answer the following exercises. Identify the graph or graphs with the given characteristic. P q m k Graph 5 Graph 6 Graph 7 W y Graph 8
The graph contains at least one octagon.Use the figure to answer the following exercises. Identify the graph or graphs with the given characteristic. P q m k Graph 5 Graph 6 Graph 7 W y Graph 8
The graph contains exactly two cyclic subgraphs.Use the figure to answer the following exercises. Identify the graph or graphs with the given characteristic. P q m k Graph 5 Graph 6 Graph 7 W y Graph 8
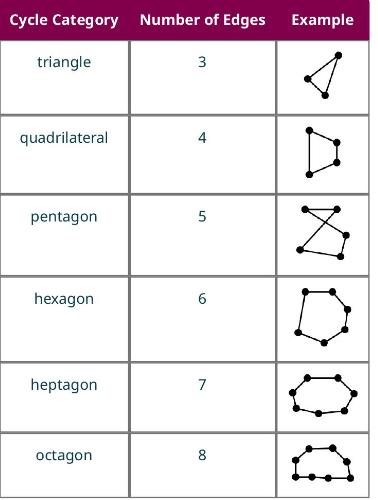
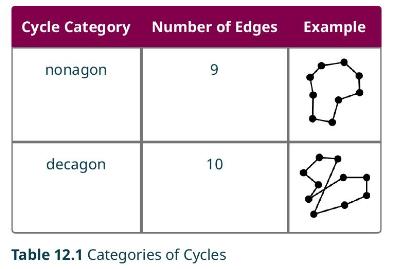
Use Table 12.1 to name a heptagon in Graph 8.Use the figure to answer the following exercises. Identify the graph or graphs with the given characteristic. P q m k Graph 5 Graph 6 Graph 7 W y Graph 8
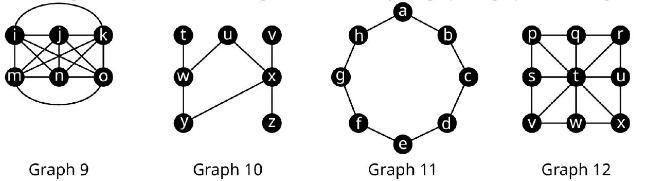
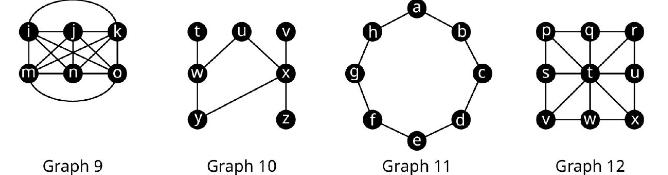
The sum of the degrees of the vertices is 16 .Use the figure to answer the following exercises. Identify the graph or graphs with the given characteristic. n e Graph 9 Graph 10 Graph 11 b W Graph 12
The graph is complete.Use the figure to answer the following exercises. Identify the graph or graphs with the given characteristic. n e Graph 9 Graph 10 Graph 11 b W Graph 12
The graph contains exactly one quadrilateral.Use the figure to answer the following exercises. Identify the graph or graphs with the given characteristic. n e Graph 9 Graph 10 Graph 11 b W Graph 12
The graph contains at least one octagon.Use the figure to answer the following exercises. Identify the graph or graphs with the given characteristic. n e Graph 9 Graph 10 Graph 11 b W Graph 12
The graph contains exactly one cyclic subgraph.Use the figure to answer the following exercises. Identify the graph or graphs with the given characteristic. n e Graph 9 Graph 10 Graph 11 b W Graph 12
List every quadrilateral in Graph 12.Use Table 12.1 to answer the following exercises about the below figure. m n Graph 9 k W y Z Graph 10 g h b Graph 11 V Graph 12
List every quadrilateral in Graph 10.Use Table 12.1 to answer the following exercises about the below figure. m n Graph 9 k W y Z Graph 10 g h b Graph 11 V Graph 12
Determine the number of quadrilaterals in Graph 9.Use Table 12.1 to answer the following exercises about the below figure. m n Graph 9 k W y Z Graph 10 g h b Graph 11 V Graph 12
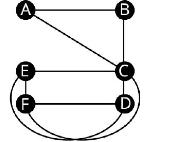
Name five triangles in the graph.Use the figure to answer the following exercises. A B E F D
Identify a clique with more than three vertices in the graph by listing its vertices.Use the figure to answer the following exercises. A B E F D
4 vertices, 6 edges, a subgraph that is a 4 -cycle.Draw a graph with the given characteristics.
11 vertices, the only cyclic subgraphs are triangles.Draw a graph with the given characteristics.
Complete graph, no quadrilateral subgraph Draw a graph with the given characteristics.
4 vertices, 4 edges, no cyclic subgraphs Draw a graph with the given characteristics.
Complete graph, sum of the degrees of the vertices is 20 .Draw a graph with the given characteristics.
7 vertices, largest clique has 5 vertices.Draw a graph with the given characteristics.
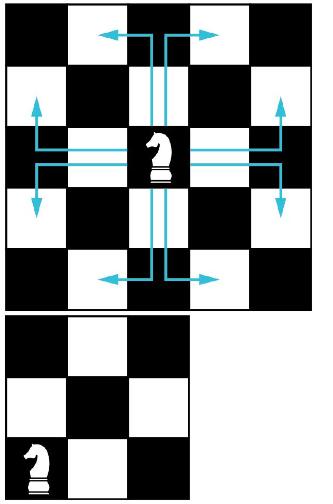
In chess, a knight can move in any direction, but it must move two spaces then turn and move one more space. The eight possible moves a knight can make from a space in the center of a five-by-five grid are shown in the first figure. Draw a graph that represents all the legal moves of a knight on a
What kind of cycle is the resulting graph you drew for Exercise 40?
Use Pascal's triangle to find number of triangles in a complete graph with 14 vertices.
Do you think that a graph representing network of friends on Facebook is likely to be complete or not? Explain your reasoning.
Would the graph of a family tree, in which edges represent parent-child lineage, contain any cycles? Why or why not?
We have seen that the number of triangles in a complete graph with 7 vertices can be calculated using the pattern \((5+4+3+2+1)+(4+3+2+1)+(3+2+1)+(2+1)+1=35\). This pattern gets very long for complete graphs with more vertices, but we have seen sums from 1 to a number before, and we had a shortcut!
Use the fact that the sum from 1 to \(n-1\) is \(\frac{n(n-1)}{2}\) to write a formula for the number of triangles in a complete graph with \(n\) vertices.
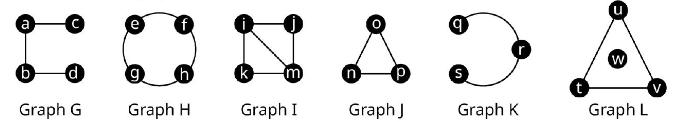
\(G\) and \(H\)Use the figure to answer the following exercises. A pair of graphs is given. Identify three differences between them that demonstrate the graphs are not isomorphic. a 9 W b d g h k m n P t Graph G Graph H Graph I Graph J Graph K Graph L
\(G\) and \(I\)Use the figure to answer the following exercises. A pair of graphs is given. Identify three differences between them that demonstrate the graphs are not isomorphic. a 9 W b d g h k m n P t Graph G Graph H Graph I Graph J Graph K Graph L
\(G\) and \(J\)Use the figure to answer the following exercises. A pair of graphs is given. Identify three differences between them that demonstrate the graphs are not isomorphic. a 9 W b d g h k m n P t Graph G Graph H Graph I Graph J Graph K Graph L
\(G\) and \(K\)Use the figure to answer the following exercises. A pair of graphs is given. Identify three differences between them that demonstrate the graphs are not isomorphic. a 9 W b d g h k m n P t Graph G Graph H Graph I Graph J Graph K Graph L
\(G\) and \(L\)Use the figure to answer the following exercises. A pair of graphs is given. Identify three differences between them that demonstrate the graphs are not isomorphic. a 9 W b d g h k m n P t Graph G Graph H Graph I Graph J Graph K Graph L
\(H\) and \(I\)Use the figure to answer the following exercises. A pair of graphs is given. Identify three differences between them that demonstrate the graphs are not isomorphic. a 9 W b d g h k m n P t Graph G Graph H Graph I Graph J Graph K Graph L
\(H\) and \(J\)Use the figure to answer the following exercises. A pair of graphs is given. Identify three differences between them that demonstrate the graphs are not isomorphic. a 9 W b d g h k m n P t Graph G Graph H Graph I Graph J Graph K Graph L
\(H\) and \(K\)Use the figure to answer the following exercises. A pair of graphs is given. Identify three differences between them that demonstrate the graphs are not isomorphic. a 9 W b d g h k m n P t Graph G Graph H Graph I Graph J Graph K Graph L
\(H\) and \(L\)Use the figure to answer the following exercises. A pair of graphs is given. Identify three differences between them that demonstrate the graphs are not isomorphic. a 9 W b d g h k m n P t Graph G Graph H Graph I Graph J Graph K Graph L
Showing 800 - 900
of 6887
First
2
3
4
5
6
7
8
9
10
11
12
13
14
15
16
Last
Step by Step Answers