New Semester
Started
Get
50% OFF
Study Help!
--h --m --s
Claim Now
Question Answers
Textbooks
Find textbooks, questions and answers
Oops, something went wrong!
Change your search query and then try again
S
Books
FREE
Study Help
Expert Questions
Accounting
General Management
Mathematics
Finance
Organizational Behaviour
Law
Physics
Operating System
Management Leadership
Sociology
Programming
Marketing
Database
Computer Network
Economics
Textbooks Solutions
Accounting
Managerial Accounting
Management Leadership
Cost Accounting
Statistics
Business Law
Corporate Finance
Finance
Economics
Auditing
Tutors
Online Tutors
Find a Tutor
Hire a Tutor
Become a Tutor
AI Tutor
AI Study Planner
NEW
Sell Books
Search
Search
Sign In
Register
study help
mathematics
introductory statistics behavioral
Introductory Statistics 9th Edition Prem S. Mann - Solutions
The following data give the amount (in dollars) of electric bills for November 2015 for 12 randomly selected households from a small town.205 265 176 314 243 192 297 357 238 281
The following data give the times (in minutes) that all 10 students took to complete an assignment in a statistics class.15 26 16 36 31 13 29 18 21 39a. Calculate the range,
The following data give the one-way commuting times (in minutes) from home to work for all 12 employees working at a small company.35 10 22 38 31 27 53 44 16 44 25
The following data represent the systolic blood pressure reading (that is, the top number in the standard blood pressure reading) in mmHg for each of 20 randomly selected middle-aged males who were taking blood pressure medication.a. Calculate the range, variance, and standard deviation for these
The following data give the number of patients who visited a walk-in clinic on each of 20 randomly selected days.a. Calculate the range, variance, and standard deviation for these data.b. Calculate the coefficient of variation. 37 26 33 19 38 29 37 22 30 42 24 35 24 26 38 23 28 32 20 34
The following data give the annual salaries (in thousand dollars) of 20 randomly selected health care workers.a. Compute the range, variance, and standard deviation for these data.b. Calculate the coefficient of variation.c. Are the values of these summary measures population parameters or sample
The following data give the number of years of employment for all 20 employees of a small company.a. Compute the range, variance, and standard deviation for these data.b. Calculate the coefficient of variation.c. Are the values of these summary measures population parameters or sample statistics?
The following data set belongs to a population:5 −7 2 0 −9 16 10 7Calculate the range, variance, and standard deviation.
Can the standard deviation have a negative value? Explain.
The mean 2015 income for five families was $99,520. What was the total 2015 income of these five families?
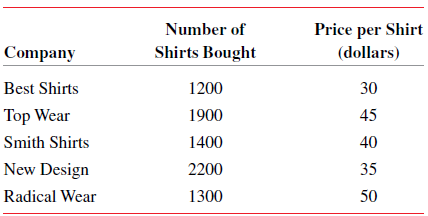
A clothing store bought 8000 shirts last year from five different companies. The following table lists the number of shirts bought from each company and the price paid for each shirt. Calculate the weighted mean that represents the average price paid for these 8000 shirts. Number of Price per
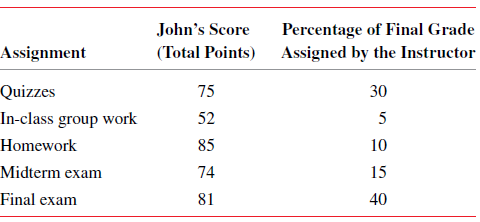
A statistics professor based her final grades on quizzes, in-class group work, homework, a midterm exam, and a final exam. However, not all of the assignments contributed equally to the final grade. John received the scores (out of 100 for each assignment) listed in the table below. The instructor
In a survey of 640 parents of young children, 360 said that they will not want their children to play football because it is a very dangerous sport, 210 said that they will let their children play football, and 70 had no opinion. Considering the opinions of these parents, what is the mode?
The following data represent the systolic blood pressure reading (that is, the top number in the standard blood pressure reading) in mmHg for each of 20 randomly selected middle-aged males who were taking blood pressure medication.a. Calculate the mean, median, and mode for these data.b. Calculate
The following data give the number of patients who visited a walk-in clinic on each of 20 randomly selected days.a. Calculate the mean, median, and mode for these data.b. Calculate the 15% trimmed mean for these data. 26 33 42 24 26 23 28 37 19 22 30 35 24 32 37 29 38 38 34 20
The following data give the annual salaries (in thousand dollars) of 20 randomly selected health care workers.a. Calculate the mean, median, and mode for these data.b. Calculate the 15% trimmed mean for these data. 57 71 45 35 53 38 64 58 55 39 62 59 50 64 67 40 61 77 74 44
The following data give the prices (in thousand dollars) of all 10 homes that were sold in a small town last year.205 214 265 195 283 188 251 325 219 295a. Calculate the mean and
The following data give the total food expenditures (in dollars) for the past one month for a sample of 20 families.a. Calculate the mean and median for these data.b. Calculate the 20% trimmed mean for these data. 1125 530 1234 595 427 872 1480 699 1274 1187 933 1127 716 1065 934 930 1046 1199 1353
The following data give the 2015 bonuses (in thousands of dollars) of 10 randomly selected Wall Street managers.127 82 45 99 153 3261 77 108 68 278a. Calculate the mean and median
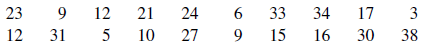
Twenty randomly selected married couples were asked how long they have been married. Their responses (rounded to years) are listed below.a. Calculate the mean, median, and mode for these data.b. Calculate the 10% trimmed mean for these data. 27 12 33 41 19 5 15 59 26 3 35 18 13 27 34 5 23 51
The following data give the amounts (in dollars) of electric bills for November 2015 for 12 randomly selected households selected from a small town.205 265 176 314 243 192 297 357 238
The following data give the 2014 profits (in millions of dollars) of the top 10 companies listed in the 2014 Fortune 500Company
The following data set belongs to a population:5 −7 2 0 −9 16 10 7Calculate the mean, median, and mode.
Prices of cars have a distribution that is skewed to the right with outliers in the right tail. Which of the measures of center is the best to summarize this data set? Explain.
Is it possible for a (quantitative) data set to have no mean, no median, or no mode? Give an example of a data set for which this summary measure does not exist.
Which of the five measures of center (the mean, the median, the trimmed mean, the weighted mean, and the mode) can assume more than one value for a data set? Give an example of a data set for which this summary measure assumes more than one value.
Which of the five measures of center (the mean, the median, the trimmed mean, the weighted mean, and the mode) can be calculated for quantitative data only, and which can be calculated for both quantitative and qualitative data? Illustrate with examples.
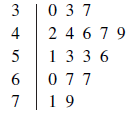
Consider this stem-and-leaf display:Write the data set that was used to construct this display. 0 37 3 4 2 4 67 9 133 6 077 19
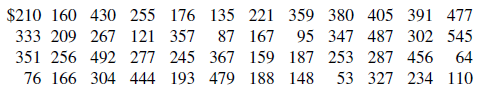
Thirty customers from all customers who shopped at a large grocery store during a given week were randomly selected and their shopping expenses was noted. The following data show the expenses (in dollars) of these 30 customers.a. Prepare a frequency distribution table for these data. Use the
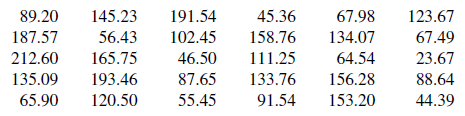
Forty-eight randomly selected car owners were asked about their typical monthly expense on gas. The following data show the responses of these 48 car owners.a. Construct a frequency distribution table. Use the classes 50–149, 150–249, 250–349, 350–449, and 450–549.b. Calculate the
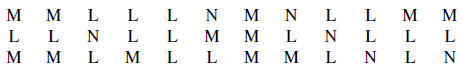
a. Thirty-six randomly selected senior citizens were asked if their net worth is more than or less than $200,000. Their responses are given below, where M stands for more, L represents less, N means do not know or do not want to tell.b. Using the frequency distribution of part a, prepare the
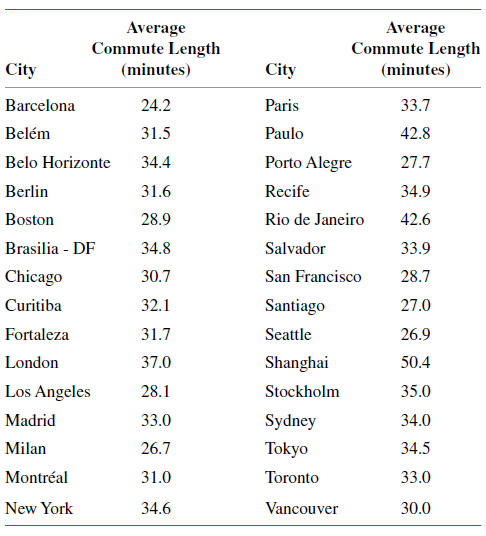
The following table lists the average one-way commuting times (in minutes) from home to work for 30 metropolitan areas around the world with more than 1 million residents (urbandemographics. blogspot.com).a. Prepare a frequency distribution table for these data using the less-than method to write
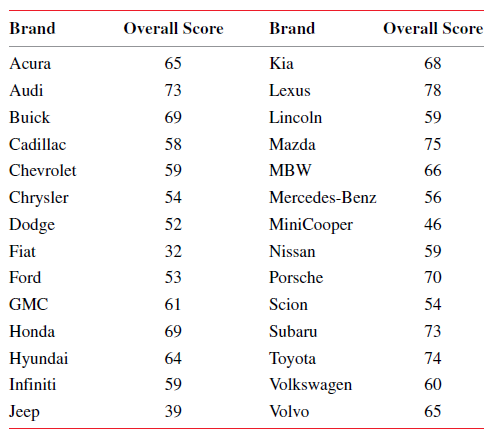
The following table, which is based on Consumer Reports tests and surveys, gives the overall scores (combining road-test and reliability scores) for 28 brands of vehicles for which they had enough data (USA Today, February 25, 2015). Create a dotplot for these data. Brand Overall Score Brand
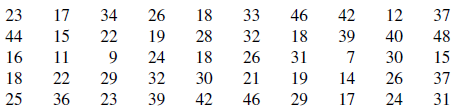
The following data give the one-way commuting times (in minutes) from home to work for a random sample of 50 workers.Create a dotplot for these data. 23 26 33 46 42 34 22 17 18 12 40 37 48 28 39 30 26 15 19 24 29 23 18 32 31 26 44 11 16 18 15 37 22 30 32 18 19 21 29 14 25 42 39 36 46 17 24 31
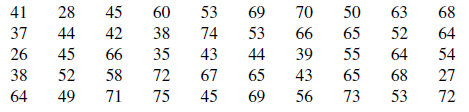
The following data give the times (in minutes) taken by 50 students to complete a statistics examination that was given a maximum time of 75 minutes to finish.Create a dotplot for these data. 45 38 42 44 35 66 58 70 66 39 68 63 28 60 41 37 26 53 69 50 65 55 65 53 53 74 64 52 54 64 27 68 72 45 52 43
The National Highway Traffic Safety Administration collects data on fatal accidents that occur on roads in the United States. The following data represent the number of vehicle fatalities for 39 counties in South Carolina for 2012 (www-fars.nhtsa.dot.gov/States).
Create a dotplot for the following data set.1 2 0 5 1 1 3 2 0
What are the benefits of preparing a dotplot? Explain.
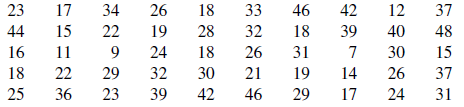
The following data give the one-way commuting times (in minutes) from home to work for a random sample of 50 workers.23 17 34 26 18 33 46 42 12 3744 15 22 19 28 32 18 39 40 4816 11 9 24 18 26 31 7 30 1518 22 29 32 30 21 19 14 26 3725 36 23 39 42 46 29 17 24 31Construct a
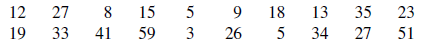
The following data give the taxes paid (rounded to thousand dollars) in 2014 by a random sample of 30 families.11 17 35 3 15 9 21 13 5 195 12 8 16 10 8 12 6 14 188 12 5 3 14 28 38 18 22 15a. Prepare a stem-and-leaf display for these data. Arrange the leaves for each stem in
The following data give the times (in minutes) taken by 50 studentsto complete a statistics examination that was given a maximum time of 75 minutes to finish.41 28 45 60 53 69 70 50 63 6837 44 42 38 74 53 66 65 52 6426 45 66 35 43 44 39 55 64 5438 52 58 72 67 65 43 65 68 2764 49 71 75 45 69 56 73
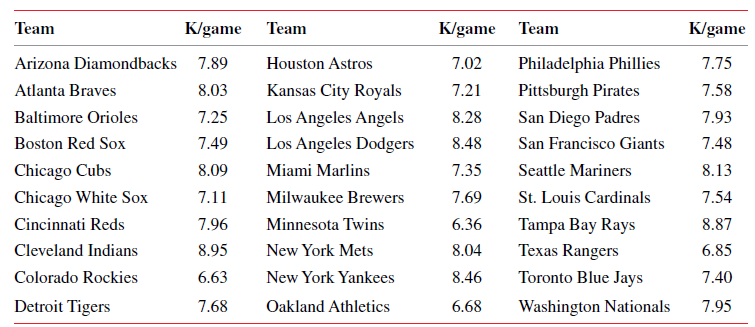
The following table lists the number of strikeouts per game (K/game) for each of the 30 Major League baseball teams during the 2014 regular season.a. Construct a frequency distribution table. Take 6.30 as the lower boundary of the first class and .55 as the width of each class.b. Prepare the
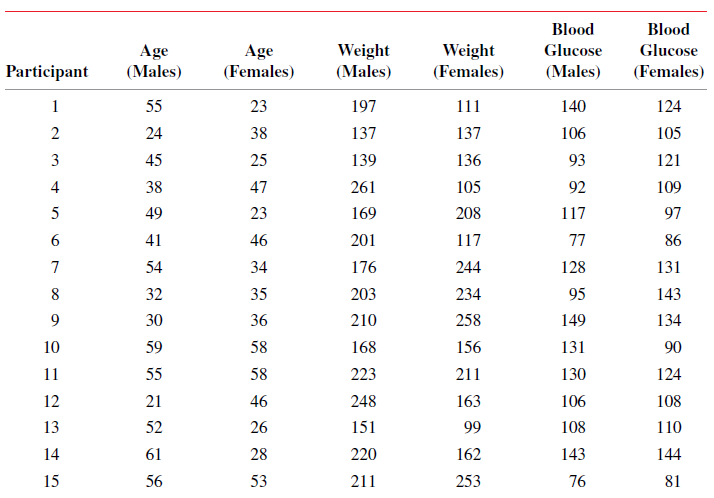
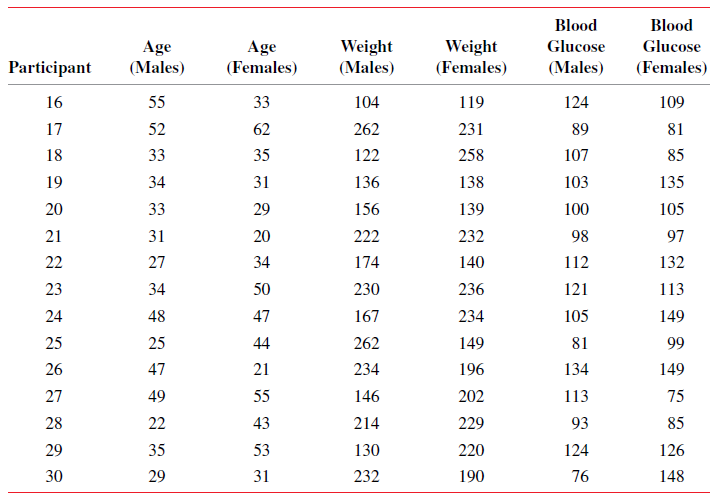
a. Construct a frequency distribution table for blood glucose levels of female participants using the classes 75–89, 90–104, 105–119, 120–134, and 135–149.b. Calculate the relative frequency and percentage for each class.c. Construct a histogram for the percentage distribution of part
a. Construct a frequency distribution table for blood glucose levels of male participants using the classes 75–89, 90–104, 105–119, 120–134, and 135–149.b. Calculate the relative frequency and percentage for each class.c. Construct a histogram for the percentage distribution of part b.d.
a. Construct a frequency distribution table for weights of female participants using the classes 91–125, 126–160, 161–195, 196–230, and 231–265.b. Calculate the relative frequency and percentage for each class.c. Construct a histogram for the relative frequency distribution of part a.d.
a. Construct a frequency distribution table for weights of male participants using the classes 91–125, 126–160, 161–195, 196–230, and 231–265.b. Calculate the relative frequency and percentage for each class.c. Construct a histogram for the relative frequency distribution of part b.d.
a. Construct a frequency distribution table for ages of male participants using the classes 20–29, 30–39, 40–49, 50–59, and 60–69.b. Calculate the relative frequency and percentage for each class.c. Construct a histogram for the frequency distribution of part a.d. What percentage of the
a. Construct a frequency distribution table for ages of female participants using the classes 20–29, 30–39, 40–49, 50–59, and 60–69.b. Calculate the relative frequency and percentage for each class.c. Construct a histogram for the frequency distribution of part a.d. What percentage of the
The following data give the one-way commuting times (in minutes) from home to work for a random sample of 50 workers.a. Construct a frequency distribution table using the classes 0–9, 10–19, 20–29, 30–39, and 40–49.b. Calculate the relative frequency and percentage for each class.c.
In a 2013 survey of employees conducted by Financial Finesse Inc., employees were asked about their overall financial stress levels. The following table shows the results of this survey (www. financialfinesse.com).Financial Stress Level
In the past few years, many states have built casinos and many more are in the process of doing so. Forty adults were asked if building casinos is good for society. Following are the responses of these adults, where G stands for good, B indicates bad, and I means indifferent or no answer.a. Prepare
Why do we need to group data in the form of a frequency table? Explain briefly.
A researcher wanted to know if using regular fertilizer or organic fertilizer will affect the yield of potatoes. He divided a large parcel of land into 10 small parcels and then randomly selected five parcels to grow potatoes using regular fertilizer and the other five parcels using organic
A researcher wanted to study if regular exercise can control diabetes. He took a sample of 1200 adults who were under treatment for diabetes. He asked them if they exercise regularly or not and whether their diabetes was under control or not. Based on this information he reached his conclusion that
The following table lists the age (rounded to the nearest year) and price (rounded to the nearest thousand dollars) for each of the seven cars of the same model.Age (x)
Explain the following concepts: an observational study, a designed experiment, randomization, treatment group, control group, double-blind experiment, and placebo effect.
A professor is teaching a large class that has 247 students. He wants to select a sample of 15 students to do a study on the habits of his students. For each of the following sampling methods, explain what kind of method is used (e.g., is it a random sample, nonrandom sample, sample with
Indicate whether each of the following constitutes data collected from a population or a sample.a. A group of 25 patients selected to test a new drugb. Total items produced on a machine for each year from 2001 to 2015c. Yearly expenditures on clothes for 50 personsd. Number of houses sold by each
The following table lists the number of billionaires for each of a few selected countries as of October 2014.Country Number of BillionairesUnited
The following table lists the total revenue for each of a few selected companies for the year 2014Company Revenue for Fiscal Year
A federal government think tank wanted to investigate whether a job training program helps the families who are on welfare to get off the welfare program. The researchers at this agency selected 10,000 families at random from the list of all families that were on welfare. Of these 10,000 families,
A federal government think tank wanted to investigate whether a job training program helps the families who are on welfare to get off the welfare program. The researchers at this agency selected 5000 volunteer families who were on welfare and offered the adults in those families free job training.
A survey based on a random sample taken from one borough of New York City showed that 65% of the people living there would prefer to live somewhere other than New York City if they had the opportunity to do so. Based on this result, can the researcher say that 65% of people living in New York City
An opinion poll agency conducted a survey based on a random sample in which the interviewers called the parents included in the sample and asked them the following questions:i. Do you believe in spanking children?ii. Have you ever spanked your children?iii. If the answer to the second question is
Explain whether each of the following constitutes data collected from a population or a sample.a. The number of pizzas ordered on Fridays during 2015 at all of the pizza parlors in your town.b. The dollar values of auto insurance claims filed in 2015 for 200 randomly selected policies.c. The
In which sampling technique do all samples of the same size selected from a population have the same chance of being selected?
Classify the following as cross-section or time-series data.a. Food bill of a family for each month of 2015b. Number of accidents each year in Dallas from 2000 to 2015c. Number of supermarkets in each of 40 cities as of December 31, 2015d. Gross sales of 200 ice cream parlors in July 2015
A survey of families living in a certain city was conducted to collect information on the following variables: age of the oldest person in the family, number of family members, number of males in the family, number of females in the family, whether or not they own a house, income of the family,
The following table lists the number of deaths by cause as reported by the Centers for Disease Control and Prevention on February 6, 2015Cause of Death Number of DeathsHeart
The following table lists the number of deaths by cause as reported by the Centers for Disease Control and Prevention on February 6, 2015 Cause of
Which of the following is an example of descriptive statistics and which is an example of inferential statistics? Explain.a. In a survey by Fortune Magazine and SurveyMonkey, participants were asked what was the most important factor when purchasing groceries (Fortune, June 1, 2015). The following
Explain the following sampling techniques: simple random sampling, systematic random sampling, stratified random sampling, and cluster sampling.
Explain the following concepts: sampling or chance error, nonsampling or systematic error, selection bias, nonresponse bias, response bias, and voluntary response bias.
Explain the following types of samples: random sample, nonrandom sample, representative sample, convenience sample, judgement sample, quota sample, sample with replacement, and sample without replacement.
Indicate which of the following is an example of a sample with replacement and which is a sample without replacement.a. Five friends go to a livery stable and select five horses to ride (each friend must choose a different horse).b. A box contains five marbles of different colors. A marble is drawn
A sample in statistics means a portion of thea. People selected from the population of a countryb. People selected from the population of an areac. Population of interest
A population in statistics means a collection of alla. Men and womenb. Subjects or objects of interestc. People living in a country
Showing 300 - 400
of 379
1
2
3
4
Step by Step Answers