New Semester
Started
Get
50% OFF
Study Help!
--h --m --s
Claim Now
Question Answers
Textbooks
Find textbooks, questions and answers
Oops, something went wrong!
Change your search query and then try again
S
Books
FREE
Study Help
Expert Questions
Accounting
General Management
Mathematics
Finance
Organizational Behaviour
Law
Physics
Operating System
Management Leadership
Sociology
Programming
Marketing
Database
Computer Network
Economics
Textbooks Solutions
Accounting
Managerial Accounting
Management Leadership
Cost Accounting
Statistics
Business Law
Corporate Finance
Finance
Economics
Auditing
Tutors
Online Tutors
Find a Tutor
Hire a Tutor
Become a Tutor
AI Tutor
AI Study Planner
NEW
Sell Books
Search
Search
Sign In
Register
study help
mathematics
introductory statistics behavioral
Introductory Statistics 9th Edition Prem S. Mann - Solutions
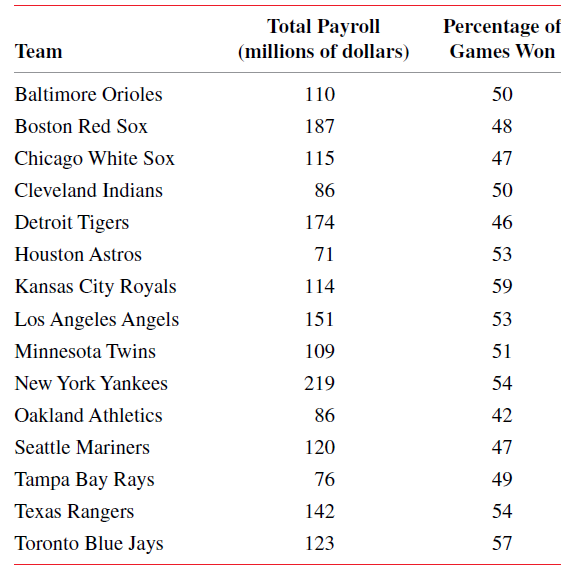
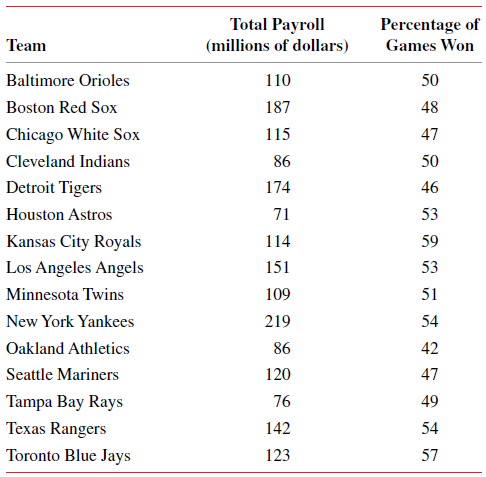
The following table gives the 2015 total payroll (in millions of dollars) and the percentage of games won during the 2015 season by each of the American League baseball teams.Compute the linear correlation coefficient, ρ. Does it make sense to make a confidence interval and to test a hypothesis
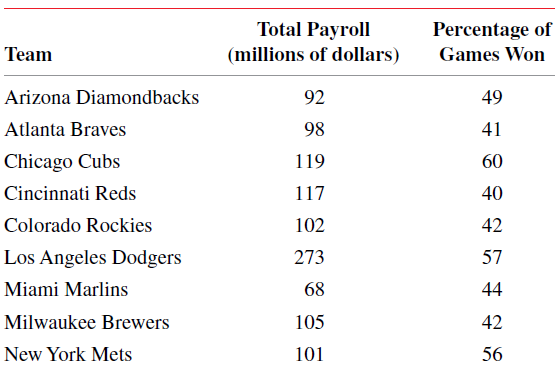
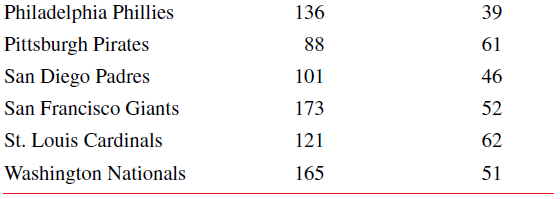
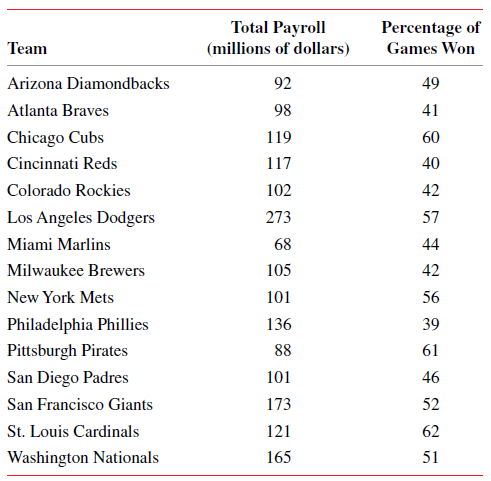
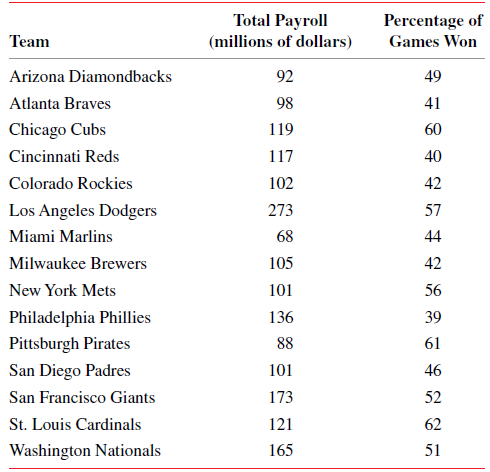
The following table gives the 2015 total payroll (in millions of dollars) and the percentage of games won during the 2015 season by each of the National League baseball teams.Compute the linear correlation coefficient, ρ. Does it make sense to make a confidence interval and to test a hypothesis
For a sample data set on two variables, the value of the linear correlation coefficient is (close to) zero. Does this mean that these variables are not related? Explain.
For a sample data set, the slope b of the regression line has a negative value. Which of the following is true about the linear correlation coefficient r calculated for the same sample data?a. The value of r will be positive.b. The value of r will be negative.c. The value of r can be positive or
For a sample data set, the linear correlation coefficient r has a positive value. Which of the following is true about the slope b of the regression line estimated for the same sample data?a. The value of b will be positive.b. The value of b will be negative.c. The value of b can be positive or
Can the values of B and ρ calculated for the same population data have different signs? Explain.
What does a linear correlation coefficient tell about the relationship between two variables? Within what range can a correlation coefficient assume a value?
Explain the difference between A and a and between B and b for a regression model.
Explain why the random error term ε is added to the regression model.
Describe the mean, standard deviation, and shape of the sampling distribution of the slope b of the simple linear regression model.
The following table gives the 2015 total payroll (in millions of dollars) and the percentage of games won during the 2015 season by each of the National League baseball teams.a. Find the standard deviation of errors, σε with percentage of games won as the dependent variable. (Note that this data
What are the degrees of freedom for a simple linear regression model?
The following table gives the 2015 total payroll (in millions of dollars) and the percentage of games won during the 2015 season by each of the American League baseball teams.a. Find the least squares regression line with total payroll as the independent variable and percentage of games won as the
The following table gives the 2015 total payroll (in millions of dollars) and the percentage of games won during the 2015 season by each of the National League baseball teams.a. Find the least squares regression line with total payroll as the independent variable and percentage of games won as the
Two variables x and y have a negative linear relationship. Explain what happens to the value of y when x increases. Give one example of a negative relationship between two variables.
Two variables x and y have a positive linear relationship. Explain what happens to the value of y when x increases. Give one example of a positive relationship between two variables.
Explain the difference between y and ŷ.
Explain the least squares method and least squares regression line. Why are they called by these names?
Why is the random error term included in a regression model?
Explain the meaning of independent and dependent variables for a regression model.
The one-way ANOVA test is alwaysa. Right-tailed b. Left-tailed c. Two-tailed
In 2014, the variance of the ages of all workers at a large company that has more than 30,000 workers was 133. A recent random sample of 25 workers selected from this company showed that the variance of their ages is 112.a. Using a 2.5% significance level, can you conclude that the current variance
A sample of 10 units selected from a normally distributed population produced a variance of 7.2. Test at a 1% significance level if the population variance is greater than 4.2.
A sample of 21 units selected from a normally distributed population produced a variance of 9.2. Test at a 5% significance level if the population variance is different from 6.5.
According to a Gallup poll whose results were reported on October 22, 2013, American’s views on legalizing marijuana are changing. In that survey, American adults were asked whether marijuana should be legalized in America. Suppose in a recent survey, 600 Americans were randomly selected from
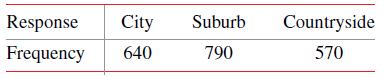
In a recent poll, American adults were asked, if they have a choice, would they prefer to live in a city, suburb, or countryside. The following table shows the frequencies for the three choices.Test at a 1% significance level if these three places are equally preferred by American adults. City
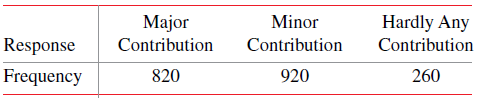
In a Harris Poll conducted October 15–20, 2014, American adults were asked “to think ahead 2 to 5 years and assess if they feel solar energy will contribute to meeting our energy needs.” Of the respondents, 31% said solar energy will make a major contribution to meeting our energy needs
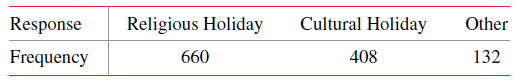
In a Pew Research Center poll conducted December 3–8, 2013, American adults age 18 and older were asked if Christmas is more a religious or a cultural holiday for them. Of the respondents, 51% said Christmas is a religious holiday for them, 32% said it is a cultural holiday, and 17% gave other
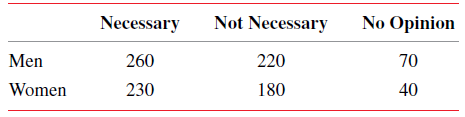
A random sample of 1000 Americans was taken, and these adults were asked if experience in politics was necessary for a candidate to be president of America. The following table presents the results of the survey.Test at a 1% significance level whether gender and opinions are related. Not Necessary
To make a test of independence or homogeneity, what should be the minimum expected frequency for each cell? What are the alternatives if this condition is not satisfied?
Find the critical value of F for an F distribution with .025 area in the right tail anda. df = (4, 11)b. df = (15, 3)
Find the critical value of F for an F distribution with df = (3, 12) anda. Area in the right tail = .05b. Area in the right tail = .10
Determine the critical value of F for the following.a. df = (6, 12) and area in the right tail = .01b. df = (6, 40) and area in the right tail = .01c. df = (6, 100) and area in the right tail = .01
Find the critical value of F for the following.a. df = (2, 6) and area in the right tail = .025b. df = (6, 6) and area in the right tail = .025c. df = (15, 6) and area in the right tail = .025
Find the critical value of F for the following.a. df = (3, 3) and area in the right tail = .05b. df = (3, 10) and area in the right tail = .05c. df = (3, 30) and area in the right tail = .05
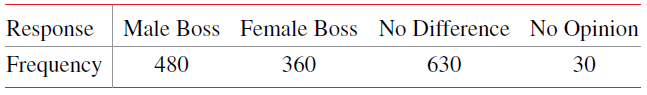
In a Gallup poll conducted August 7–10, 2014, American adults aged 18 and older were asked, “If you were taking a new job and had your choice of a boss, would you prefer to work for a man or a woman?” Of the respondents, 33% said that they would prefer a male boss, 20% said a female boss, 46%
The chi-square goodness-of-fit test is alwaysa. Two-tailed b. Left-tailed c. Right-tailed
According to a Bureau of Labor Statistics report released on March 25, 2015, statisticians earn an average of $84,010 a year and accountants and auditors earn an average of $73,670 a year (www.bls.gov). Suppose that these estimates are based on random samples of 2000 statisticians and 1800
According to a Bureau of Labor Statistics report released on March 25, 2015, statisticians earn an average of $84,010 a year and accountants and auditors earn an average of $73,670 a year (www.bls. gov). Suppose that these estimates are based on random samples of 2000 statisticians and 1800
In a survey of American drivers, 79% of women drivers and 85% of men drivers said that they exceeded the speed limit at least once in the past week. Suppose that these percentages are based on random samples of 600 women and 700 men drivers.a. Let p1 and p2 be the proportion of all women and men
When are the samples considered large enough for the sampling distribution of the difference between two sample proportions to be (approximately) normal?
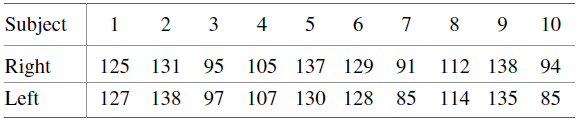
A finger-tapping experiment was conducted by a doctoral neuropsychology student. The purpose of this experiment was to determine bilateral nervous system integrity, which provides data about the neuromuscular system and motor control. The experiment requires the subjects to place the palm of the
To make a goodness-of-fit test, what should be the minimum expected frequency for each category? What are the alternatives if this condition is not satisfied?
Explain the difference between the observed and expected frequencies for a goodness-of-fit test.
What is a goodness-of-fit test and when is it applied? Explain.
To test the hypothesis that the mean blood pressure of university professors is lower than that of company executives, which of the following would you use?a. A left-tailed testb. A two-tailed test c. A right-tailed test
According to an estimate, 75% of cell phone owners in a large city had smart phones in 2014. In a recent sample of 1000 cell phone owners selected from this city, 790 had smart phones. At a 2% significance level, can you conclude that the current proportion of cell phone owners in this city who
PolicyInteractive of Eugene, Oregon conducted a study of American adults in April 2014 for the Center for a New American Dream. Seventy-five percent of the adults included in this study said that having basic needs met is very or extremely important in their vision of the American dream
According to a Bureau of Labor Statistics release of February 20, 2015, 79% of American children under age 18 lived with at least one other sibling in 2014. Suppose that in a recent sample of 2000 American children under age 18, 1620 were living with at least one other sibling.a. Using the
According to a Bureau of Labor Statistics release of March 25, 2015, financial analysts earned an average of $110,510 in 2014. Suppose that the 2014 earnings of all financial analysts had a mean of $110,510. A recent sample of 400 financial analysts showed that they earn an average of $114,630 a
The following information was obtained from two independent samples selected from two populations with unequal and unknown population standard deviations.n1 = 48 x̅1 = .863 s1 = .176n2 = 46 x̅2 = .796
The following information was obtained from two independent samples selected from two normally distributed populations with unequal and unknown population standard deviations.n1 = 14 x̅1 = .109.43 s1 = 2.26n2 = 15
The following information was obtained from two independent samples selected from two populations with unequal and unknown population standard deviations.n1 = 48 x̅1 = .863 s1 = .176n2 = 46 x̅2 = .796
The following information was obtained from two independent samples selected from two normally distributed populations with unequal and unknown population standard deviations.n1 = 14 x̅1 = 109.43 s1 = 2.26n2 = 15
The standard recommendation for automobile oil changes is once every 5000 miles. A local mechanic is interested in determining whether people who drive more expensive cars are more likely to follow the recommendation. Independent random samples of 45 customers who drive luxury cars and 40 customers
According to the Kaiser Family Foundation, U.S. workers who had employer-provided health insurance paid an average premium of $1170 for single (one person) health insurance coverage during 2013 (www.kff.org). Suppose that a recent random sample of 100 workers with employer-provided health insurance
A one-tailed testa. Has one rejection regionb. Has one non-rejection regionc. Both a and b
A two-tailed test is a test witha. Two rejection regionsb. Two non-rejection regionsc. Two test statistics
In a Gallup poll conducted July 7–10, 2014, 45% of Americans said that they actively try to include organic foods into their diets (www.gallup.com). In a recent sample of 2100 Americans, 1071 said that they actively try to include organic foods into their diets. Is there significant evidence at a
According to an article in Forbes magazine of April 3, 2014, 57% of students said that they did not attend the college of their first choice due to financial concerns (www.forbes.com). In a recent poll of 1600 students, 864 said that they did not attend the college of their first choice due to
According to a 2014 CIRP Your First College Year Survey, 88% of the first-year college students said that their college experience exposed them to diverse opinions, cultures, and values (www.heri.ucla.edu). Suppose in a recent poll of 1800 first-year college students, 91% said that their college
According to the U.S. Census Bureau, in 2014, 62% of Americans age 18 and older were married. A recent sample of 2000 Americans age 18 and older showed that 58% of them are married. Can you reject the null hypothesis at a 1% significance level in favor of the alternative that the percentage of
According to a study conducted in 2015, 18% of shoppers said that they prefer to buy generic instead of name-brand products. Suppose that in a recent sample of 1500 shoppers, 315 stated that they prefer to buy generic instead of name-brand products. At a 5% significance level, can you conclude that
According to the analysis of Federal Reserve statistics and other government data, American households with credit card debts owed an average of $15,706 on their credit cards in August 2015 (www.nerdwallet.com). A recent random sample of 500 American households with credit card debts produced a
According to ValuePenguin, the average annual cost of automobile insurance was $1388 in the state of Nevada in 2014 (www. valuepenguin.com). An insurance broker is interested to find if the current mean annual rate of automobile insurance in Nevada is more than $1388. She took a random sample of
The XO Group Inc., released the results of its annual Real Weddings Study on March 27, 2014 (www.theknot.com). According to this study, the average cost of a wedding in America was $29,858 in 2013. A recent sample of 100 American couples who got married this year produced a mean wedding cost of
According to a survey by the College Board, undergraduate students at private nonprofit four-year colleges spent an average of $1244 on books and supplies in 2014–2015 (www.collegeboard.org). A recent random sample of 200 undergraduate college students from a large private nonprofit four-year
According to Moebs Services Inc., the average cost of an individual checking account to major U.S. banks was $380 in 2013 (www.moebs.com). A bank consultant wants to determine whether the current mean cost of such checking accounts at major U.S. banks is more than $380 a year. A recent random
Powerball is a game of chance that has generated intense interest because of its large jackpots. To play this game, a player selects five different numbers from 1 through 69, and then picks a Powerball number from 1 through 26. The lottery organization randomly draws 5 different white balls from 69
Terry & Sons makes bearings for autos. The production system involves two independent processing machines so that each bearing passes through these two processes. The probability that the first processing machine is not working properly at any time is .08, and the probability that the second
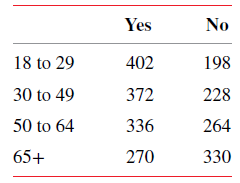
In a Gallup Annual Economy and Personal Finance poll, conducted April 3–6, 2014, 21% of adults aged 18 to 29 said that college costs and loans were the biggest financial problem their families were dealing with. Suppose two adults aged 18 to 29 are selected. Find the following probabilities.a.
According to the National Association of Colleges and Employers, the average starting salary of 2014 college graduates with a bachelor’s degree was $45,473 (www.naceweb.org). A random sample of 1000 recent college graduates from a large city showed that their average starting salary was $44,930.
According to the U.S. Bureau of Labor Statistics, all workers in America who had a bachelor’s degree and were employed earned an average of $1224 a week in 2014. A recent sample of 400 American workers who have a bachelor’s degree showed that they earn an average of $1260 per week. Suppose that
For each of the following significance levels, what is the probability of making a Type I error?a. α = .025 b. α = .05 c. α = .01
Consider the following null and alternative hypotheses:H0: μ = 60 versus H1: μ > 60Suppose you perform this test at α = .01 and fail to reject the null hypothesis.Would you state that the difference between the hypothesized value of the population mean and the observed value of the sample
Consider the following null and alternative hypotheses:H0: μ = 25 versus H1: μ ≠ 25Suppose you perform this test at α = .05 and reject the null hypothesis.Would you state that the difference between the hypothesized value of the population mean and the observed value of the sample mean is
By rejecting the null hypothesis in a test of hypothesis example, are you stating that the alternative hypothesis is true?
What does the level of significance represent in a test of hypothesis? Explain.
Consider H0: μ = 55 versus H1: μ ≠ 55.a. What type of error would you make if the null hypothesis is actually false and you fail to reject it?b. What type of error would you make if the null hypothesis is actually true and you reject it?
Which of the two hypotheses (null and alternative) is initially assumed to be true in a test of hypothesis?
Harris Interactive conducted an online poll of 2097 Americanadults between July 17 and 21, 2014, on the topic “Who are we lying to?” In response to one of the questions, 37% of American adults said that they have lied to get out of work (www.harrisinteractive.com).a. What is the point estimate
In an online poll conducted by the St. Louis Post-Dispatch during September 2014, people were asked about their favorite sports to watch on television. Of the respondents, 42% selected baseball, 18% mentioned hockey, 36% liked football, and 4% selected basketball (www.stltoday.com). Using these
In a January 2014 survey conducted by the Associated Press- We TV, 68% of American adults said that owning a home is the most important thing or a very important but not the most important thing (opportunityagenda.org). Assume that this survey was based on a random sample of 900 American adults.a.
According to a Gallup poll conducted April 3–6, 2014, 21% of Americans aged 18 to 29 said that college loans and/or expenses were the top financial problem facing their families. Suppose that this poll was based on a random sample of 1450 Americans aged 18 to 29.a. What is the point estimate of
According to a Gallup poll conducted January 5–8, 2014, 67% of American adults were dissatisfied with the way income and wealth are distributed in America. Assume that this poll is based on a random sample of 1500 American adults.a. What is the point estimate of the corresponding population
What is the point estimator of the population proportion, p?
What assumption(s) must hold true to use the normal distribution to make a confidence interval for the population proportion, p?
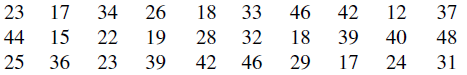
The following data give the one-way commuting times (in minutes) from home to work for a random sample of 30 workers.a. Calculate the value of the point estimate of the mean one-way commuting time from home to work for all workers.b. Construct a 99% confidence interval for the mean one-way
According to the 2015 Physician Compensation Report by Medscape (a subsidiary of WebMD), American orthopedists earned an average of $421,000 in 2014. Suppose that this mean is based on a random sample of 200 American orthopaedists, and the standard deviation for this sample is $90,000. Make a 90%
How will you interpret a 99% confidence interval for μ? Explain.
What is the margin of error of estimate for μ when σ is known? How is it calculated?
Briefly explain the difference between a confidence level and a confidence interval.
What is the point estimator of the population mean, μ? How would you calculate the margin of error for an estimate of μ?
Briefly explain the meaning of an estimator and an estimate.
According to a Gallup poll conducted August 7–10, 2014, 48% of American workers said that they were completely satisfied with their jobs. Assume that this result is true for the current population of American workers.a. Find the probability that in a random sample of 1150 American workers, the
According to a Pew Research survey conducted in February 2014, 24% of American adults said they trust the government in Washington, D.C., always or most of the time. Suppose that this result is true for the current population of American adults. Let p̂ be the proportion of American adults in a
According to a Bureau of Labor Statistics release of March 25, 2015, statisticians earn an average of $84,010 a year. Suppose that the current annual earnings of all statisticians have the mean and standard deviation of $84,010 and $20,000, respectively, and the shape of this distribution is skewed
According to a Bureau of Labor Statistics release of March 25, 2015, statisticians earn an average of $84,010 a year. Suppose that the current annual earnings of all statisticians have the mean and standarddeviation of $84,010 and $20,000, respectively, and the shape of this distribution is skewed
According to a 2014 Kaiser Family Foundation Health Benefits Survey released in 2015, the total mean cost of employer-sponsored family health coverage was $16,834 per family per year, of which workers were paying an average of $4823. Suppose that currently the distribution of premiums paid by all
According to the American Time Use Survey results released by the Bureau of Labor Statistics on June 24, 2015, on a typical day, 65% of American men age 15 and over spent some time doing household activities such as housework, cooking, lawn care, or financial and other household management. Assume
Showing 100 - 200
of 379
1
2
3
4
Step by Step Answers