New Semester
Started
Get
50% OFF
Study Help!
--h --m --s
Claim Now
Question Answers
Textbooks
Find textbooks, questions and answers
Oops, something went wrong!
Change your search query and then try again
S
Books
FREE
Study Help
Expert Questions
Accounting
General Management
Mathematics
Finance
Organizational Behaviour
Law
Physics
Operating System
Management Leadership
Sociology
Programming
Marketing
Database
Computer Network
Economics
Textbooks Solutions
Accounting
Managerial Accounting
Management Leadership
Cost Accounting
Statistics
Business Law
Corporate Finance
Finance
Economics
Auditing
Tutors
Online Tutors
Find a Tutor
Hire a Tutor
Become a Tutor
AI Tutor
AI Study Planner
NEW
Sell Books
Search
Search
Sign In
Register
study help
mathematics
precalculus
Calculus Of A Single Variable 11th Edition Ron Larson, Bruce H. Edwards - Solutions
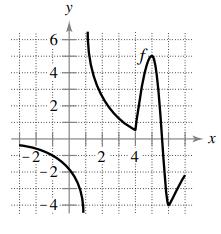
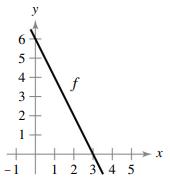
Use the graph of f to find(a) The largest open interval on which f is increasing and(b) The largest open interval on which f is decreasing. TI -6- 4 2 -2 -2 y -4 2 4 4 ign X
Find the second derivative of the function.f(x) = 4x5 − 2x3 + 5x2
Describe the Test for Increasing and Decreasing Functions in your own words.
Name several of the concepts you have learned that are useful for analyzing the graph of a function.
Describe the Test for Concavity in your own words.
Describe the First Derivative Test in your own words.
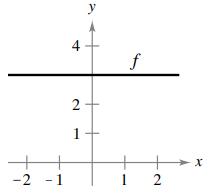
The graph of f is shown. State the signs of f′ and f″ on the interval (0, 2). f 2
What does it mean for the graph of a function to have a horizontal asymptote?
Describe the Second Derivative Test in your own words.
Which type of function can have a slant asymptote? How do you determine the equation of a slant asymptote?
A graph can have a maximum of how many horizontal asymptotes? Explain.
What are the maximum numbers of relative extrema and points of inflection that a fifth-degree polynomial can have? Explain.
In your own words, summarize the guidelines for finding limits at infinity of rational functions.
Determine the open intervals on which the graph of the function is concave upward or concave downward. f(x) = 24 x² + 12
Analyze and sketch a graph of the function. Label any intercepts, relative extrema, points of inflection, and asymptotes. Use a graphing utility to verify your results. y = 1 x-2 - 3
Determine the open intervals on which the graph of the function is concave upward or concave downward.f(x) = x2 − 4x + 8
Determine the open intervals on which the graph of the function is concave upward or concave downward. f(x) x-2 6x + 1
Analyze and sketch a graph of the function. Label any intercepts, relative extrema, points of inflection, and asymptotes. Use a graphing utility to verify your results. y X 1- x
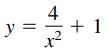
Analyze and sketch a graph of the function. Label any intercepts, relative extrema, points of inflection, and asymptotes. Use a graphing utility to verify your results. y || 12 x² + 1
Determine the open intervals on which the graph of the function is concave upward or concave downward.f(x) = x4 − 3x3
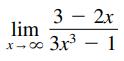
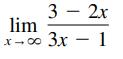
Find each limit, if it exists.(a)(b)(c) 3 - 2x lim x-∞ 3x³ - 1
Analyze and sketch a graph of the function. Label any intercepts, relative extrema, points of inflection, and asymptotes. Use a graphing utility to verify your results. y = x + 1 X x² - 4
Determine the open intervals on which the graph of the function is concave upward or concave downward. 1 I - zx I + zx (x) f
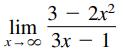
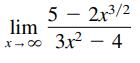
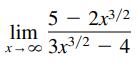
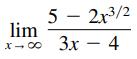
Find each limit, if it exists.(a)(b)(c) lim 5- 2³/2 3x² - 4
Determine the open intervals on which the graph of the function is concave upward or concave downward. f(x) = x + 8 x - 7
Analyze and sketch a graph of the function. Label any intercepts, relative extrema, points of inflection, and asymptotes. Use a graphing utility to verify your results. y = x - 4 3 x -
Determine the open intervals on which the graph of the function is concave upward or concave downward. y = 2x - tan x, II II 2' 2
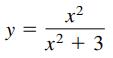
Analyze and sketch a graph of the function. Label any intercepts, relative extrema, points of inflection, and asymptotes. Use a graphing utility to verify your results. y = 2 x² X -2 x² + 3
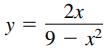
Analyze and sketch a graph of the function. Label any intercepts, relative extrema, points of inflection, and asymptotes. Use a graphing utility to verify your results. y || 2x 9-1²
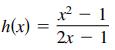
Determine the open intervals on which the graph of the function is concave upward or concave downward. h(x) f-1 2x - 1
Find lim x→∞ h(x), if it exists.f(x) = 5x3 − 3 (a) h(x) = f(x)/x2(b) h(x) = f(x)/x3(c) h(x) = f(x)/x4
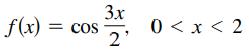
Find the open intervals on which the function is increasing or decreasing. f(x): = COS 3x 2' 0 < x < 2
Find lim x→∞ h(x), if it exists.f(x) = −4x2 + 2x − 5(a) h(x) = f(x)/x(b) h(x) = f(x)/x2(c) h(x) = f(x)/x3
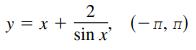
Determine the open intervals on which the graph of the function is concave upward or concave downward. y = x + 7:/N sin x (-n, n)
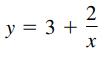
Analyze and sketch a graph of the function. Label any intercepts, relative extrema, points of inflection, and asymptotes. Use a graphing utility to verify your results. y = 3 + 2 X
Find the open intervals on which the function is increasing or decreasing.y = x√16 − x2
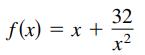
Analyze and sketch a graph of the function. Label any intercepts, relative extrema, points of inflection, and asymptotes. Use a graphing utility to verify your results. f(x) = x + 32 X
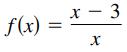
Analyze and sketch a graph of the function. Label any intercepts, relative extrema, points of inflection, and asymptotes. Use a graphing utility to verify your results. f(x) = x-3 Xx
Analyze and sketch a graph of the function. Label any intercepts, relative extrema, points of inflection, and asymptotes. Use a graphing utility to verify your results. y 4 X² + 1
Find the open intervals on which the function is increasing or decreasing.y = x − 2 cos x, 0 < x < 2
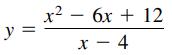
Analyze and sketch a graph of the function. Label any intercepts, relative extrema, points of inflection, and asymptotes. Use a graphing utility to verify your results. y = x² - 6x + 12 -2 x - 4 X
Find the points of inflection and discuss the concavity of the graph of the function.f(x) = x3 − 9x2 + 24x − 18
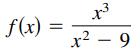
Analyze and sketch a graph of the function. Label any intercepts, relative extrema, points of inflection, and asymptotes. Use a graphing utility to verify your results. f(x) x³ x² - 9
Find the open intervals on which the function is increasing or decreasing.f(x) = sin2 x + sin x, 0 < x < 2
Analyze and sketch a graph of the function. Label any intercepts, relative extrema, points of inflection, and asymptotes. Use a graphing utility to verify your results. y || 13 x² - 4
Find the points of inflection and discuss the concavity of the graph of the function.f(x) = 2 − 7x4
(a) Find the critical numbers of f, if any,(b) Find the open intervals on which the function is increasing or decreasing,(c) Apply the First Derivative Test to identify all relative extrema f(x) = x2 − 8x
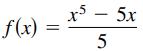
(a) Find the critical numbers of f, if any,(b) Find the open intervals on which the function is increasing or decreasing,(c) Apply the First Derivative Test to identify all relative extrema f(x) = x5 - 5x 5
(a) Find the critical numbers of f, if any,(b) Find the open intervals on which the function is increasing or decreasing,(c) Apply the First Derivative Test to identify all relative extrema.(d) Use a graphing utility to confirm your results.f(x) = x2 + 6x + 10
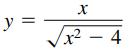
Analyze and sketch a graph of the function. Label any intercepts, relative extrema, points of inflection, and asymptotes. Use a graphing utility to verify your results. y X x² - 4
(a) Find the critical numbers of f, if any,(b) Find the open intervals on which the function is increasing or decreasing,(c) Apply the First Derivative Test to identify all relative extrema f(x) = −2x2 + 4x + 3
(a) Find the critical numbers of f, if any,(b) Find the open intervals on which the function is increasing or decreasing,(c) Apply the First Derivative Test to identify all relative extrema.(d) Use a graphing utility to confirm your results.f(x) = −3x2 − 4x − 2
(a) Find the critical numbers of f, if any,(b) Find the open intervals on which the function is increasing or decreasing,(c) Apply the First Derivative Test to identify all relative extremaf (x) = −7x3 + 21x + 3
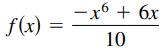
(a) Find the critical numbers of f, if any,(b) Find the open intervals on which the function is increasing or decreasing,(c) Apply the First Derivative Test to identify all relative extrema, and(d) Use a graphing utility to confirm your results. f(x) = -x6 + 6x 10
(a) Find the critical numbers of f, if any,(b) Find the open intervals on which the function is increasing or decreasing,(c) Apply the First Derivative Test to identify all relative extrema, and(d) Use a graphing utility to confirm your results.f(x) = x3 − 6x2 + 15
Find the points of inflection and discuss the concavity of the graph of the function.f(x) = 6 − x /√x
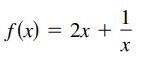
(a) Find the critical numbers of f, if any,(b) Find the open intervals on which the function is increasing or decreasing,(c) Apply the First Derivative Test to identify all relative extrema f(x) = 2x + 1 X
Analyze and sketch a graph of the function. Label any intercepts, relative extrema, points of inflection, and asymptotes. Use a graphing utility to verify your results.y = x√4 − x
(a) Find the critical numbers of f, if any,(b) Find the open intervals on which the function is increasing or decreasing,(c) Apply the First Derivative Test to identify all relative extremaf(x) = (x − 1)2 (x + 3)
(a) Find the critical numbers of f, if any,(b) Find the open intervals on which the function is increasing or decreasing,(c) Apply the First Derivative Test to identify all relative extrema, and(d) Use a graphing utility to confirm your results.f(x) = (8 − x)(x + 1)2
Analyze and sketch a graph of the function. Label any intercepts, relative extrema, points of inflection, and asymptotes. Use a graphing utility to verify your results.g(x) = x√9 − x2
Analyze and sketch a graph of the function. Label any intercepts, relative extrema, points of inflection, and asymptotes. Use a graphing utility to verify your results.y = 2 − x − x3
(a) Find the critical numbers of f, if any,(b) Find the open intervals on which the function is increasing or decreasing,(c) Apply the First Derivative Test to identify all relative extrema f(x) = x1/3 + 1
(a) Find the critical numbers of f, if any,(b) Find the open intervals on which the function is increasing or decreasing,(c) Apply the First Derivative Test to identify all relative extrema, and(d) Use a graphing utility to confirm your results.f(x) = x2/3 − 4
(a) Find the critical numbers of f, if any,(b) Find the open intervals on which the function is increasing or decreasing,(c) Apply the First Derivative Test to identify all relative extrema f(x) = (x + 2)2/3
(a) Find the critical numbers of f, if any,(b) Find the open intervals on which the function is increasing or decreasing,(c) Apply the First Derivative Test to identify all relative extrema, and(d) Use a graphing utility to confirm your results. f(x) = X x-5
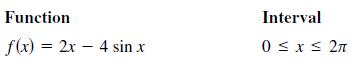
Analyze and sketch a graph of the function over the given interval. Label any intercepts, relative extrema, points of inflection, and asymptotes. Use a graphing utility to verify your results. Function f(x) = 2x - 4 sin x Interval 0 ≤ x ≤ 2π
(a) Find the critical numbers of f, if any,(b) Find the open intervals on which the function is increasing or decreasing,(c) Apply the First Derivative Test to identify all relative extremaf(x) = 5 − ∣x − 5∣
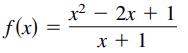
(a) Find the critical numbers of f, if any,(b) Find the open intervals on which the function is increasing or decreasing,(c) Apply the First Derivative Test to identify all relative extrema, and(d) Use a graphing utility to confirm your results. f(x) = 1² 2x + 1 x + 1
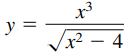
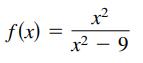
(a) Find the critical numbers of f, if any,(b) Find the open intervals on which the function is increasing or decreasing,(c) Apply the First Derivative Test to identify all relative extrema f(x) || x² x² - 9
Analyze and sketch a graph of the function. Label any intercepts, relative extrema, points of inflection, and asymptotes. Use a graphing utility to verify your results.xy2 = 9
(a) Use a computer algebra system to differentiate the function,(b) Sketch the graphs of f and f′ on the same set of coordinate axes over the given interval,(c) Find the critical numbers of f in the open interval, and(d) Find the interval(s) on which f′ is positive and the interval(s) on which
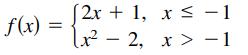
(a) Find the critical numbers of f, if any,(b) Find the open intervals on which the function is increasing or decreasing,(c) Apply the First Derivative Test to identify all relative extrema, and(d) Use a graphing utility to confirm your results. f(x) = [2x + 1, x ≤ −1 1x² - 2, x>-1
(a) Find the critical numbers of f, if any,(b) Find the open intervals on which the function is increasing or decreasing,(c) Apply the First Derivative Test to identify all relative extrema, and(d) Use a graphing utility to confirm your results.f(x) = (x − 3)1/3
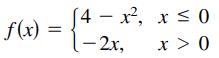
(a) Find the critical numbers of f, if any,(b) Find the open intervals on which the function is increasing or decreasing,(c) Apply the First Derivative Test to identify all relative extrema f(x) = [4x², -2x, x ≤ 0 x > 0
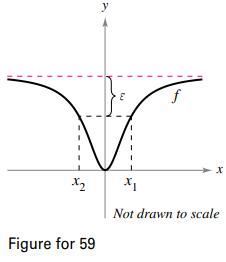
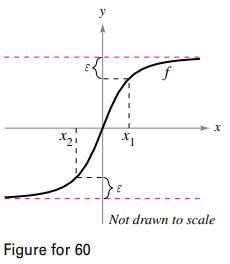
The graph ofis shown (see figure).(a) Find L = lim x→∞ f(x).(b) Determine x1 and x2 in terms of ε.(c) Determine M, where M > 0, such that ∣ f(x) − L∣ M.(d) Determine N, where N f(x) = 21² x² + 2
(a) Find the critical numbers of f, if any,(b) Find the open intervals on which the function is increasing or decreasing,(c) Apply the First Derivative Test to identify all relative extrema, and(d) Use a graphing utility to confirm your results.f(x) = ∣x + 3∣ − 1
The graph of f is shown. Graph f, f′, and f ″ on the same set of coordinate axes. To print an enlarged copy of the graph, go to MathGraphs.com. 3 12 -1 y 1 2 3
Consider the function on the interval (0, 2π).(a) Find the open intervals on which the function is increasing or decreasing.(b) Apply the First Derivative Test to identify all relative extrema.f(x) = x − 2 sin x
Analyze and sketch a graph of the function. Label any intercepts, relative extrema, points of inflection, and asymptotes. Use a graphing utility to verify your results.x2 y = 9
Find all relative extrema of the function. Use the Second Derivative Test where applicable. f(x) 9x - 1 x + 5
Find all relative extrema of the function. Use the Second Derivative Test where applicable.f(x) = −x4 + 2x3 + 8x
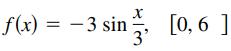
Find the absolute extrema of the function on the closed interval.y = 3 cos x, [0, 2 ]
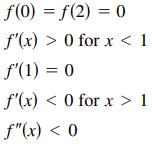
Sketch the graph of a function f having the given characteristics. f(0) = f(2) = 0 f'(x) > 0 for x < 1 f'(1) = 0 f'(x) < 0 for x > 1 f"(x) < 0
Consider a function f such that f′ is increasing. Sketch graphs of f for(a) f′ < 0 and(b) f′ > 0.
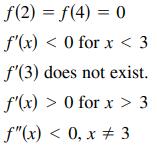
Sketch the graph of a function f having the given characteristics. ƒ(2) = f(4) = 0 f'(x) < 0 for x < 3 f'(3) does not exist. f'(x) > 0 for x > 3 f"(x) < 0, x # 3
(a) Use a computer algebra system to differentiate the function,(b) Sketch the graphs of f and f′ on the same set of coordinate axes over the given interval,(c) Find the critical numbers of f in the open interval, and(d) Find the interval(s) on which f′ is positive and the interval(s) on which
The figure shows the graph of f″. Sketch a graph of f. (The answer is not unique.) To print an enlarged copy of the graph, go to MathGraphs.com. 6 543255 1 -1 y f 1 2 3 4 5 X
The graph of f is shown in the figure. Sketch a graph of the derivative of f. To print an enlarged copy of the graph, go to MathGraphs.com. -2 - 1 4 2 1 y f 12 x
Find the limit. Use a graphing utility to verify your result.lim x→−∞ (x + √x2 + 3)
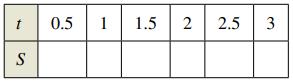
The annual sales S of a new product are given bywhere t is time in years.(a) Complete the table. Then use it to estimate when the annual sales are increasing at the greatest rate.(b) Use a graphing utility to graph the function S. Then use the graph to estimate when the annual sales are increasing
Find the limit. Use a graphing utility to verify your result.lim x→∞ (x − √x2 + x)
Find the limit. Use a graphing utility to verify your result.lim x→−∞ (3x + √9x2 − x)
(a) Use a computer algebra system to differentiate the function,(b) Sketch the graphs of f and f′ on the same set of coordinate axes over the given interval,(c) Find the critical numbers of f in the open interval, and(d) Find the interval(s) on which f′ is positive and the interval(s) on which
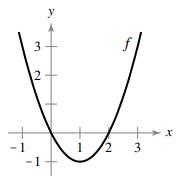
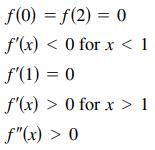
Sketch the graph of a function f having the given characteristics. f(0) = f(2)= 0 f'(x) < 0 for x < 1 f'(1) = 0 f'(x) > 0 for x > 1 f"(x) > 0
Find the limit. Use a graphing utility to verify your result.lim x→∞ (4x − √16x2 − x)
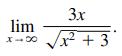
Consider(a) Use the definition of limits at infinity to find the value of M that corresponds to ε = 0.5.(b) Use the definition of limits at infinity to find the value of M that corresponds to ε = 0.1 lim x-00 3x x² + 3
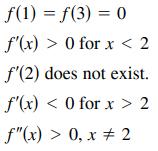
Sketch the graph of a function f having the given characteristics. f(1) = f(3) = 0 f'(x) > 0 for x < 2 f'(2) does not exist. f'(x) < 0 for x > 2 f"(x) > 0, x # 2
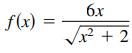
The graph ofis shown (see figure).(a) Find L = lim x→∞ f(x) and K = lim x→−∞ f(x).(b) Determine x1 and x2 in terms of ε.(c) Determine M, where M > 0, such that ∣ f(x) − L∣ M.(d) Determine N, where N f(x) 6х x² + 2
The graph of f is shown in the figure. Sketch a graph of the derivative of f. To print an enlarged copy of the graph, go to MathGraphs.com. -2 -1 2 1 y If 1 23 X
Showing 13700 - 13800
of 29454
First
131
132
133
134
135
136
137
138
139
140
141
142
143
144
145
Last
Step by Step Answers