New Semester
Started
Get
50% OFF
Study Help!
--h --m --s
Claim Now
Question Answers
Textbooks
Find textbooks, questions and answers
Oops, something went wrong!
Change your search query and then try again
S
Books
FREE
Study Help
Expert Questions
Accounting
General Management
Mathematics
Finance
Organizational Behaviour
Law
Physics
Operating System
Management Leadership
Sociology
Programming
Marketing
Database
Computer Network
Economics
Textbooks Solutions
Accounting
Managerial Accounting
Management Leadership
Cost Accounting
Statistics
Business Law
Corporate Finance
Finance
Economics
Auditing
Tutors
Online Tutors
Find a Tutor
Hire a Tutor
Become a Tutor
AI Tutor
AI Study Planner
NEW
Sell Books
Search
Search
Sign In
Register
study help
mathematics
statistics social sciences
Statistics For The Social Sciences A General Linear Model Approach 1st Edition Russell T. Warne - Solutions
What is the pooled standard deviation?
What does the phrase “unpaired data” mean?
Conduct a paired-samples t-test if D = 28.20, sD = 145.91, and nD = 81.a. What is the null hypothesis?b. What would the α value be for this NHST?c. Is a one- or a two-tailed hypothesis appropriate for this scenario? Justify your response.d. What is the alternative hypothesis for this
Audrey also has a sample of fraternal twin pairs. She gives them the same test of extraversion to the fraternal twins and finds that D = 1.34, sD = 2.40, and nD = 15.a. What is the null hypothesis?b. What would the α value be for this NHST?c. Is a one- or a two-tailed hypothesis appropriate for
Audrey is interested in studying twins. Knowing that members of a twin pair would have paired scores, she conducts a paired-samples t-test to determine whether identical twins have different levels of extraversion. For her data, she finds that D = 1.18, sD = 2.04, and nD = 34.a. What is the null
Javier is conducting a paired-samples t-test, and decides that he wants to avoid Type I errors as much as he can. Therefore, he sets his α value at .000001. “This way I will be sure that I won’t make a mistake when I do my t-test,” he says. What is the flaw in his logic?
Describe the relationship between the sample size and the decision to reject or retain the null hypothesis in a paired-samples t-test.
Reyes and Asbrand (2005) also measured unhealthy fantasy behaviors in child abuse victims before and after therapy. They found that D = 2.50, sD = 8.16, and nD = 18. These difference scores were calculated by taking the pre-therapy scores and subtracting the post-therapy scores.a. Explain why these
In their study of children in play therapy (see Guided Practice 9.1), Reyes and Asbrand (2005) also measured the level of depression that the children had before and after therapy. They found that D = 7.89, sD = 11.66, and nD = 18. These difference scores were calculated by taking the pre-therapy
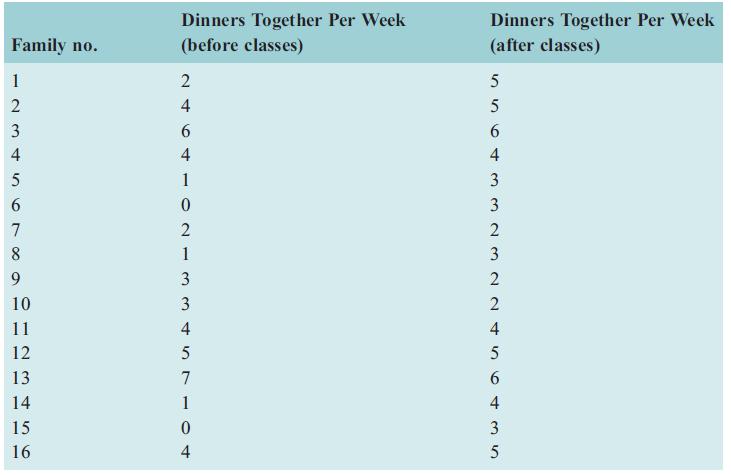
A family science researcher is interested in whether families spend more time together after the parents take a parenting class. To measure the time families spend together, the researcher collects data on how many dinners per week the family eats together. The results for 16 families are below.a.
Calculate the degrees of freedom for the following numbers of score pairs:a. 11b. 28c. 97d. 123e. 412
Both Glass’s Δ and Cohen’s d are effect sizes, but how do the two differ?
How do we determine the range of a p-value for a paired-samples t-test?
In a paired-samples t-test, how do you find the degrees of freedom?
Explain the difference between a natural pairing and an artificial pairing of scores.
How do you calculate difference scores for a paired-samples t-test?
Why do the one-sample t-test and the paired-samples t-test share so many similarities?
On a test called the MMPI-2, a score of 30 on the Anxiety Subscale is considered very low. Felipe participates in a yoga group at his gym and decides to give this subscale to 18 people in his yoga group. The mean of their scores is 35.2, with a standard deviation of 10.4. He wants to determine
The proper interpretation of a CI is that for a set of CIs that are all the same width (i.e., the same x% CI) for samples of the same n drawn from the same population, x% of CIs would include the population parameter μ. Given this interpretation, why is the z* value for a 100% CI ∞?
What is the appropriate z* value for the following CI widths?a. 40% CI?b. 50% CI?c. 62% CI?d. 68% CI?e. 81% CI?f. 93% CI?
Use the formula for CI, CI = X̅ ± z∗ (sx/√n), to answer the following questions.a. What can a researcher do to z* to make a CI narrower?b. What can a researcher do to n to make a CI wider?c. If a researcher wanted to maximize her chances of creating a CI that includes μ, what should
Kathy and Becky are classmates who each conduct their own study. Kathy has a Cohen’s d value of .104. Becky has a Cohen’s d value of .401. If both researchers have the same sample size, which one is more likely to have statistically significant results?
Daniel and Elise each conduct their own study. Daniel’s study has an n of 412, and Elise’s study has an n of 355. If both researchers have the same effect size, which researcher is more likely to reject the null hypothesis in a one-sample t-test? Why?
At a university, the mean grade-point average of all students is 2.84 (on a scale ranging from 0 to 4.0). A random sample of 24 anthropology students has a mean grade point average of 3.14, with a standard deviation of 0.35. Conduct a one-sample t-test with these data.a. What are the groups for
For a dataset, X̅ = 6.8 and sx = 1.2. What is the impact on the mean of a dataset of the following linear transformations:a. Adding 1 to every score?b. Dividing every score by 10?c. Subtracting 3 from every score?d. Adding 10 to every score?e. Subtracting 1.5 from every score?f. Multiplying every
A student using Appendix A2 wants to find their t-observed value for a dataset with 113 degrees of freedom. Unfortunately, there is no row in the table displaying the z-observed value for 113 degrees of freedom.a. What should the student do whenever the exact number of degrees of freedom is not in
Calculate the degrees of freedom for the following sample sizes:a. 3b. 12c. 22d. 100e. 412
What are the three types of significance? How do they differ from one another?
Explain what HARKing is and why it is considered a questionable research practice.
How does the sampling distribution in a one-sample t-test differ from the sampling distribution in a z-test?
Explain the difference between “statistically significant” results and important results.a. Give an example of results that would be “statistically significant” but not important.b. Give an example of results that would be “statistically insignificant” and important.
How do we determine the range of a p-value in a one-sample t-test?
When should you perform a one-sample t-test instead of a z-test?
Why do the z-test and the one-sample t-test share so many similarities?
Conduct a z-test for a dataset where μ = 104.2, σ = 18.2, X = 106.4, and n = 102.a. What are the groups for this z-test?b. What is the null hypothesis for this z-test?c. What is the value of α?d. Is a one-tailed test or a two-tailed test appropriate for this situation?e. What is the alternative
Austin and Charlotte are classmates who each conduct their own study on the same topic. Austin has a sample size of 350. Charlotte has a sample size of 210. Which student is more likely to reject the null hypothesis? Why?
Malisa calculates her Cohen’s d as +.40. How should she interpret this effect size?
If z-observed is equal to 0, what will the Cohen’s d value be?
If z-observed is equal to 0, will the researcher reject or retain the null hypothesis?
Conduct a z-test for a dataset where μ = 114.6, σ = 13.2, X̅ = 109.4, and n = 88.a. What are the groups for this z-test?b. What is the null hypothesis for this z-test?c. What is the value of α?d. Is a one-tailed test or a two-tailed test appropriate for this situation?e. What is the alternative
A student conducting a z-test rejects the null hypothesis because his z observed is 2.02 and his z-critical is ± 1.96.a. What is his p-value?b. The student interprets this small p-value to be the probability that he was wrong to reject the null hypothesis. What is wrong with this interpretation?c.
Stephanie and Rosie are classmates who each conduct their own study on the same topic. Stephanie has a sample size of 150. Rosie has a sample size of 285. Which student is more likely to retain the null hypothesis? Why?
Two researchers each conduct their own study. Researcher no. 1 has a Cohen’s d of .25, and researcher no. 2 has a Cohen’s d of .40. If both researchers have the same sample size, which researcher is more likely to reject the null hypothesis? Why?
A small dataset consists of the following values, which come from a population with μ = 7 and σ = 3.5. Conduct a z-test on these data to answer the questions below.a. What are the groups for this z-test?b. What is the null hypothesis for this z-test?c. What is the value of α?d. Is a one-tailed
In a study of social media habits, a company finds that their population of users write μ = 9.2 messages per week (σ = 4.4). A researcher finds that a sample of teenagers (n = 55) send X̅ = 10.3 messages per week. Because this social media company markets itself to young people, the researcher
Conduct a z-test for a dataset where μ = 4.1, σ = 0.8, X̅ = 3.7, n = 20.a. What are the groups for this z-test?b. What is the null hypothesis for this z-test?c. What is the value of α?d. Should the researcher conduct a one- or two-tailed test?e. What is the alternative hypothesis?f. What is the
Kevin thinks that his sample of patients who have experienced therapy have fewer symptoms of depression (X) than the average person with depression (μ). He conducts a z-test and rejects the null hypothesis. He states that this is proof that his patients get better after experiencing his therapy.
A student using Appendix A1 is looking for the z-observed value (3.02) in column A in order to find the p-value. Unfortunately, the exact z observed value is not available in the table. What should the student do?
List the similarities between the z-score formula and the z-observed formula.
Explain why there are two z-critical values in the guided practice examples in this chapter.
What are the two methods that a researcher could use to make it easier to reject the null hypothesis? What could a researcher do to make it harder to reject the null hypothesis?
Why is it impossible to obtain a p-value of 0?
What are the three possible alternative hypotheses in a z-test? When is it appropriate to use each alternative hypothesis?
A group of friends are about to play a game of basketball. To choose teams, two team captains take turns choosing players one at a time until the last person is chosen. As Carlos waits to be chosen, he realizes that each selection that a team captain makes is a trial. Carlos also realizes that the
Calculate the standard error when:a. σ = 9.8 and n = 12.b. σ = 9.8 and n = 25.c. σ = 9.8 and n = 180.d. σ = 4.2 and n = 12.e. σ = 12.9 and n = 25.f. σ = 1.3 and n = 180.g. Compare the standard errors in 16a–16f. What happens to the standard error as σ increases?h. Compare the standard
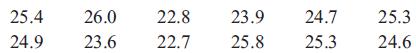
Below are the means of 15 samples (n = 55 for each sample) drawn at random from a population.a. Based on these sample means, calculate the best estimate for the population mean.b. Calculate the standard error for the sampling distribution made from the 15 sample means above.c. Calculate the best
Below are the means of 12 samples (n = 40 for each sample) drawn at random from a population.a. Based on these sample means, calculate the best estimate for the population mean.b. Calculate the standard error for the sampling distribution made from the 12 sample means above.c. Calculate the best
Camryn has five cards, numbered 1–5. She repeatedly draws two of them randomly from a hat, adds the numbers together, and uses the information to build a histogram. After 50 draws, her histogram doesn’t resemble a normal distribution. Why not? What would she need to do in order for her data to
Claudia found a quarter (US coin) on the ground three days in a row. She feels that she has been lucky and will therefore find a quarter on the ground tomorrow. Which fallacy is she engaging in?
Every month a street with 10 houses on it has a neighborhood party. The host is drawn randomly each month, and each house has an equal chance of being selected.a. What is the probability that any family will be selected twice in a row?b. In February and March two different families were hosts for
A student is taking a standardized test to apply to college. The test is multiple choice with four options (A, B, C, and D) for each question.a. The student notices that he hasn’t selected option D for the past eight questions. What is the probability of this sequence of independent random
Using the data in Guided Practice 6.1, answer the following questions:a. What is the probability of an outcome of either A or C?b. What is the probability of an outcome of either B or C?c. What is the probability of an outcome of either A or B?d. What is the probability that the outcome of two
A person has two standard packs of playing cards and draws one card from each pack. (Having two separate packs ensures that the draws are independent events.) What is the joint probability of drawing the following combination of cards?a. A heart and a spade?b. A three and an ace?c. A jack and a
A standard pack of playing cards (without the jokers) has 52 cards. There are four suits: clubs, hearts, spades, and diamonds. Each suit consists of 13 cards, with values from 2 to 10, plus an ace, a jack, a queen, and a king. As each card value appears the same number of times (4) and each suit
Based on the principle of the CLT, what are the two things that researchers can do to make their estimate of the population mean or standard deviation more exact?
Define the standard error and explain its importance in the CLT.
Explain the purpose of generalization and why it is so important for researchers in the social sciences.
What is the interpretation of a probability value ofa. .00?b. .20?c. .50?d. .75?e. 1.00?
Explain the difference between how theoretical probability distributions and empirical probability distributions are created.
A small dataset has 10 numbers: –4, –2, –1, 0, 0, 5, 6, 7, 7, and 8.a. Find the mean and standard deviation for this dataset. When calculating the standard deviation, use n – 1 in the formula.b. Convert all the scores to z-scores.c. Does the rank order of the subjects change when you
A student wants to convert a set of six z-scores (–4.2, –1.6, +0.1, +0.6, +1.4, +2.1) to a scale that has a mean of 80 and a standard deviation of 20.a. What is the new score for each of these six individuals?b. What would the new score be for an individual with a z-score of 0? Why?c. What
If Ann has a z-score of –0.30, what is the z-score of someone who scored one standard deviation higher on the original scale?
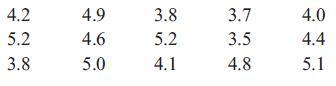
A small dataset has 12 values: 4.5, 5.2, 5.3, 5.4, 5.5, 5.7, 5.7, 5.8, 5.9, 6.1, 6.2, and 12.4.a. Find the mean and standard deviation for this dataset. When calculating the standard deviation, use n – 1 in the formula.b. Convert all the scores to z-scores.c. What is the mean and standard
Four people were randomly selected from a population. Mark’s z-score was –0.04, Tammy’s was +1.21, Maren’s was –0.68, and Phillip’s was +3.52.a. Which person’s original score will be closest to the original mean?b. Which two people had a score in the original data that was greater
In a normal distribution, what percentage of individuals have a z-score:a. Below 0?b. Above 0?c. Below –1?d. Above +2?e. Above +3?f. Between –1 and 0?g. Between –1 and +1?h. Between –2 and +1?i. Between –2 and +2?j. Above –3?k. Between 0 and –1.3?
A small dataset has 10 numbers: 10, 12, 13, 13, 14, 15, 15, 17, 18, and 19.a. Find the mean and standard deviation for this dataset. When calculating the standard deviation, use n – 1 in the formula.b. Convert all the score to z-scores.c. Does the rank order of the subjects change when you
A sample of 171 men and 198 women had a mean reaction time of 260.9 milliseconds and standard deviation of 35.3 milliseconds (Reed, Vernon, & Johnson, 2004, p. 1711). Converting these values to seconds requires dividing by 1,000.a. What would the mean for the data be if it were converted to
A social worker finds that his clients require a mean of 65.1 days to find employment (standard deviation = 12.6 days). Because he meets with the clients weekly, he thinks it makes more sense to convert the data from days to weeks. Doing this would require dividing every person’s datum by 7.a.
What are the mean and standard deviation of a set of standardized scores?
What does it mean when an individual’s z-score is negative?
What are the mean and standard deviation of a set of z-scores?
Why would someone want to perform a linear transformation?
How are linear transformations performed?
Justin works for a company that sells clothes online. He finds that 30% of website visitors view his company’s site for less than 30 seconds. His boss doesn’t think that these people are viewing the merchandise, or are likely customers.a. Why would the median probably be a better measure of
Create your own dataset where n = 20, sx > 2.5, and X̅ = 35.a. What is the mean, median, mode, trimmed mean, range, interquartile range, standard deviation, and variance of your data?b. What is the average of the deviation scores for the scores? Why?
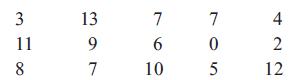
Jill counted how many pages of reading she must do for her anthropology class each day, which produced the following data:a. Calculate the mode of the scores.b. Calculate the median of the scores.c. Calculate the mean of the scores.d. Calculate the 8.3% trimmed mean of the scores.e. Calculate the
Twelve students were comparing test scores in their statistics course. Their scores were as follows:a. Calculate the mode of the scores.b. Calculate the median of the scores.c. Calculate the mean of the scores.d. Calculate the 8.3% trimmed mean of the scores.e. Compare your models of central
In the Waite et al. (2015) dataset, the ages of the subjects’ siblings with autism were as follows:a. Calculate the mode of the scores.b. Calculate the median of the scores.c. Calculate the mean of the scores.d. Calculate the 7.7% trimmed mean of the scores.e. Compare your models of central
Why is it important to examine models of central tendency and models of variability when trying to understand your data?
Which two models of central tendency are susceptible to the influence of outliers?
Which two models of central tendency are not susceptible to the influence of outliers?
Answer the following questions about Bessel’s correction:a. What is Bessel’s correction?b. Which statistics can Bessel’s correction be applied to?c. When is it appropriate to use Bessel’s correction?
Explain why deviation scores always add up to 0.
Identify which model of variability will always be larger and explain why:a. The range and the interquartile rangeb. The range and the standard deviationc. sx and σ̂x.
Find some data online and use them to create a visual model. I recommend using the Statistics Canada, US Census Bureau, or the UK Office for National Statistics websites, all of which provide high-quality, accurate data for free.
The skewness value for a distribution is 0.10, and the kurtosis value is –0.60. How would you describe this distribution?
The data below show the average price of a US movie ticket for the past several years (data from Box Office Mojo).a. Create a line graph using the trend data.b. What can you learn about ticket prices over time from the visual model? 2006: $6.55 2007: $6.88 2008: $7.18 2009: $7.50 2010: $7.89 2011:
What are two ways that people can create misleading visual models?
Karen is examining data from her company’s website. In a random sample of 300 visitors to the website, 114 left the website immediately (within 1 minute), 120 left the website later but did not buy anything, and 66 bought an item on the website.a. Create a bar graph using this information.b.
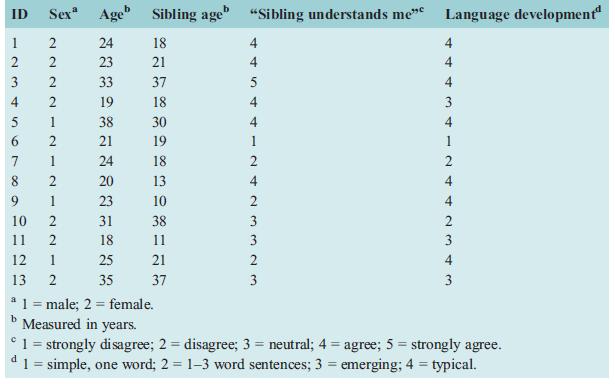
Create a scatterplot for the last two variables in Table 3.1 (i.e., “Sibling understands me” and “Language development”). Note that some subjects’ dots will be on top of each other in this scatterplot.a. What does this scatterplot tell you about your subjects?b. What does this scatterplot
Showing 100 - 200
of 240
1
2
3
Step by Step Answers