New Semester
Started
Get
50% OFF
Study Help!
--h --m --s
Claim Now
Question Answers
Textbooks
Find textbooks, questions and answers
Oops, something went wrong!
Change your search query and then try again
S
Books
FREE
Study Help
Expert Questions
Accounting
General Management
Mathematics
Finance
Organizational Behaviour
Law
Physics
Operating System
Management Leadership
Sociology
Programming
Marketing
Database
Computer Network
Economics
Textbooks Solutions
Accounting
Managerial Accounting
Management Leadership
Cost Accounting
Statistics
Business Law
Corporate Finance
Finance
Economics
Auditing
Tutors
Online Tutors
Find a Tutor
Hire a Tutor
Become a Tutor
AI Tutor
AI Study Planner
NEW
Sell Books
Search
Search
Sign In
Register
study help
mathematics
statistics social sciences
Statistics For The Social Sciences A General Linear Model Approach 1st Edition Russell T. Warne - Solutions
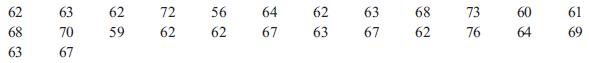
The following data represent the height of 26 statistics students as measured in inches:a. Create a frequency table for these data.b. Create a histogram for these data with an interval width of 1 unit.c. Create a frequency polygon for these data with an interval width of 1 unit.d. Create a
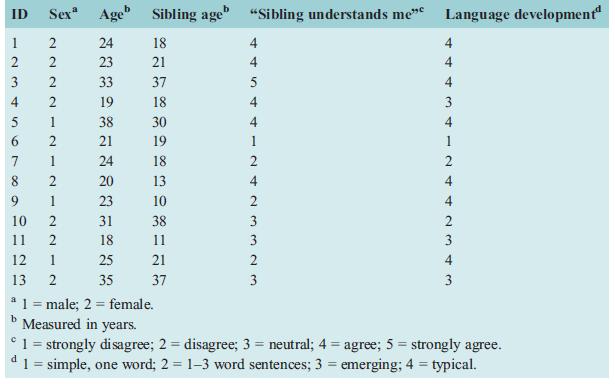
Create a pie chart showing the percentage of subjects in Table 3.1 who gave each response for the language development data in the Waite et al. (2015) study.Table 3.1
Build a stem-and-leaf plot for the sibling age data in Table 3.1.Table 3.1
A distribution has a skewness of –0.14 and a kurtosis of +0.09.a. Draw approximately what this distribution should look like.b. What terms would you use to describe this distribution?
A distribution has a skewness of +4.1 and a kurtosis of –1.1.a. Draw approximately what this distribution should look like.b. What terms would you use to describe this distribution?
A distribution has skewness of –2.5 and a kurtosis of +1.8.a. Draw approximately what this distribution should look like.b. What terms would you use to describe this distribution?
Using the data in Table 3.1, make a frequency table and a histogram for the language development variable data in the Waite et al. (2015) study.Table 3.1
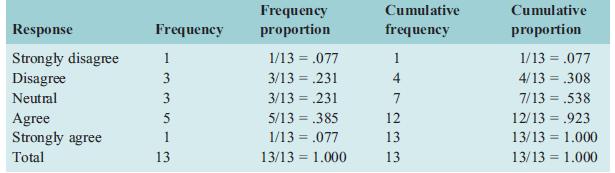
When comparing the frequency tables in this chapter (Table 3.3 and the frequency table in the guided practice section), Myeongsun noticed that the proportions in the bottom row of each table (labeled “Total”) were exactly 1.000.a. Why did both of these tables – which were built from different
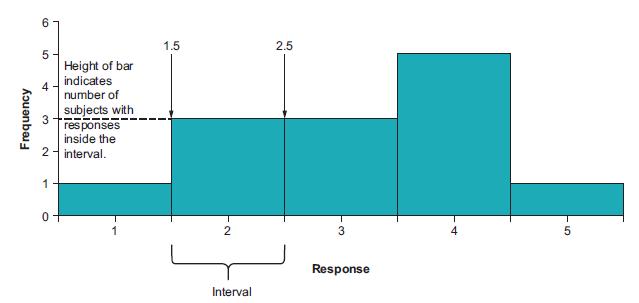
In Figure 3.2, why do the intervals span from 0.5 to 1.5, from 1.5 to 2.5, etc., when all of the numbers in the dataset are whole numbers?Figure 3.2 1.5 2.5 5- Height of bar indicates 4 number of subjects with responses inside the 2- interval. 1 1 2 4 Response Interval kouanbai
What is an advantage of scatterplots over other visual models described in this chapter?
What are the skewness and kurtosis values of the normal distribution?
Explain the difference between a platykurtic distribution and a leptokurtic distribution.
Skewness is a measurement of what aspect of a shape of a distribution?
Is the normal distribution unimodal or bimodal?
Explain the similarities and differences between a histogram and a bar graph. When is it appropriate to use each one?
What is the minimal level of data students must collect if they want toa. classify subjects?b. add scores together?c. create proportions?d. create ratios?e. subtract scores?f. form averages?
At most universities the faculty are – in ascending seniority – adjunct (i.e., part-time) faculty, lecturers, assistant professors, associate professors, and full professors.a. What level of data would this information be?b. If a researcher instead collected the number of years that a faculty
Kevin has collected data about the weight of people in his study. He couldn’t obtain their exact weight, and so he merely asked people to indicate whether they were “skinny” (labeled group 1) “average” (group 2), or “heavy” (group 3).a. What level of data has Kevin collected?b. Could
A different researcher wants to count the number of subjects who obtain each score on a variable. What is the lowest level of data that the researcher should collect in order to perform this mathematical function?
Label each of the examples in question 6 (a–o) as continuous or discrete data.Question 6a. Number of Facebook friendsb. Height, measured in centimetersc. Reaction timed. Kelvin temperature scalee. Race/ethnicityf. Native languageg. Military rankh. Celsius temperature scalei. College majorj. Movie
Classify the following variables into the correct level of data (nominal, ordinal, interval, or ratio):a. Number of Facebook friendsb. Height, measured in centimetersc. Reaction timed. Kelvin temperature scalee. Race/ethnicityf. Native languageg. Military rankh. Celsius temperature scalei. College
Knowing that it is only possible to convert data down to simpler levels, what would you suggest to researchers who want their data to be as flexible as possible?
A researcher wishes to add together the scores from different subjects. Which level(s) of data should the researcher collect in order to perform this mathematical function?
Explain why most researchers do not actually measure the phenomena they are interested in, but rather choose variables that they believe are related to the phenomena of interest.
Explain why scores on many tests and surveys can be ordinal, interval, or ratio data.
A family science professor wants to study the impact of frequent quizzes on her students’ study habits. In one of her classes she does not offer quizzes. In another class, she offers a quiz once per week. In her last class she offers a quiz in every class session. In each class she asks her
A political science student is interested in the votes that legislators in different countries cast when considering different bills. The student decides that it is impractical to study every vote by every politician in every country. So, he decides to study only a selection of votes.a. What is the
Some cultural anthropologists study “rites of passage,” which are certain rituals where people transition from one stage of their life to another. The idea of “rites of passage” is very broad and can be applied to rituals in many cultures and in all stages of life from birth to death. An
Teresa wants to know if people who post more messages about themselves on social media are more selfish than people who do not.a. She decides to count the number of Facebook status updates that her subjects post in a week that include the word “I.” She also administers a psychological test that
A social worker wants to study the impact of the instability of a child’s home life on the child’s academic performance. She defines “instability” as the number of homes that the child lives in during a year and “academic performance” as the child’s grades that the teacher assigns on
A researcher wishes to study stress, and so she records the heart rate of each of her subjects as they are exposed to a distressful situation. Is “heart rate” an independent or dependent variable? Justify your response.
What would be an example of a theory in your major? Can you give an example of how that theory has given rise to a theoretical model? What would be a possible situation that would disprove the theory?
Carl believes in the power of magnets in relieving physical pain, and he wears magnets on his body for this purpose. However, his magnetic bracelet doesn’t help with his arthritis pain. He consulted a website about healing magnets, and found that he needs to periodically change the location of
What are the four main ways that social science practitioners use statistics in their work?
Explain:a. Why every model is wrong in some way.b. Why practitioners and researchers in the social sciences should use models if they are all wrong.c. How researchers and practitioners judge whether they should use a particular model.
What is a model? How does the scientific usage of the word “model” differ from the everyday definition of a model? How is it similar?
What trait do theoretical models, statistical models, and visual models all have in common?
What trait do theoretical models, statistical models, and visual models all have in common?
Why is it important to have the ability to independently evaluate researchers’ interpretation of their data?
Why do researchers in the social sciences rarely have data from the entire population of subjects that they are interested in?
Showing 200 - 300
of 240
1
2
3
Step by Step Answers