

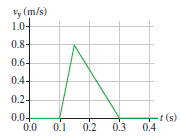
FIGURE EX2.7 showed the velocity graph of blood in the aorta. What is the bloods acceleration during
Question:
Figure Ex 2.7
Fantastic news! We've Found the answer you've been seeking!
Step by Step Answer:
Visualize The graph is a graph of velocity vs time so ...View the full answer

Answered By
Anu Philip
I am Paramedical graduate. I have done my graduation in Perfusion Technology. I am working as Cardiac Perfusionist, in which we assist the cardiac surgeons in Open heart surgeries by a machine called Heart lung Machine. II am interested to share my knowledge, specially in Biology science and thereby I can improves my tutoring experience.
0 Reviews
10+ Question Solved
Related Book For 

Physics for Scientists and Engineers A Strategic Approach with Modern Physics
ISBN: 978-0133942651
4th edition
Authors: Randall D. Knight
Question Posted:
