

Question: Consider the titration in Figure 10-2, for which the pH at the equivalence point is calculated to be 9.25. If thymol blue is used as
Consider the titration in Figure 10-2, for which the pH at the equivalence point is calculated to be 9.25. If thymol blue is used as an indicator, what color will be observed through most of the titration prior to the equivalence point? At the equivalence point? After the equivalence point?
Figure 10-2
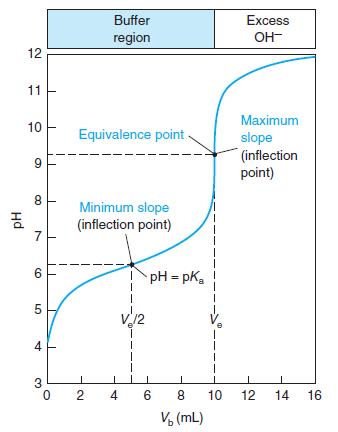
Buffer Excess region OH- 12 11 Maximum 10 Equivalence point slope (inflection point) 9 Minimum slope (inflection point) 7 6 pH = pK, 12 3 2 4 8. 10 12 14 16 V, (mL) 4. Hd
Step by Step Solution
3.40 Rating (162 Votes )
There are 3 Steps involved in it
First lets see the pH transition range for thymol blue 12red 28yellow 80yellow 96blu... View full answer

Get step-by-step solutions from verified subject matter experts