

Question: The rectangles in the graph below illustrate a left endpoint Riemann sum for at) = (15 / as) on the interval [2, 6]. The value

![sum for at) = (15 / as) on the interval [2, 6].](https://s3.amazonaws.com/si.experts.images/answers/2024/06/667b4db71e5c3_854667b4db6ed88a.jpg)
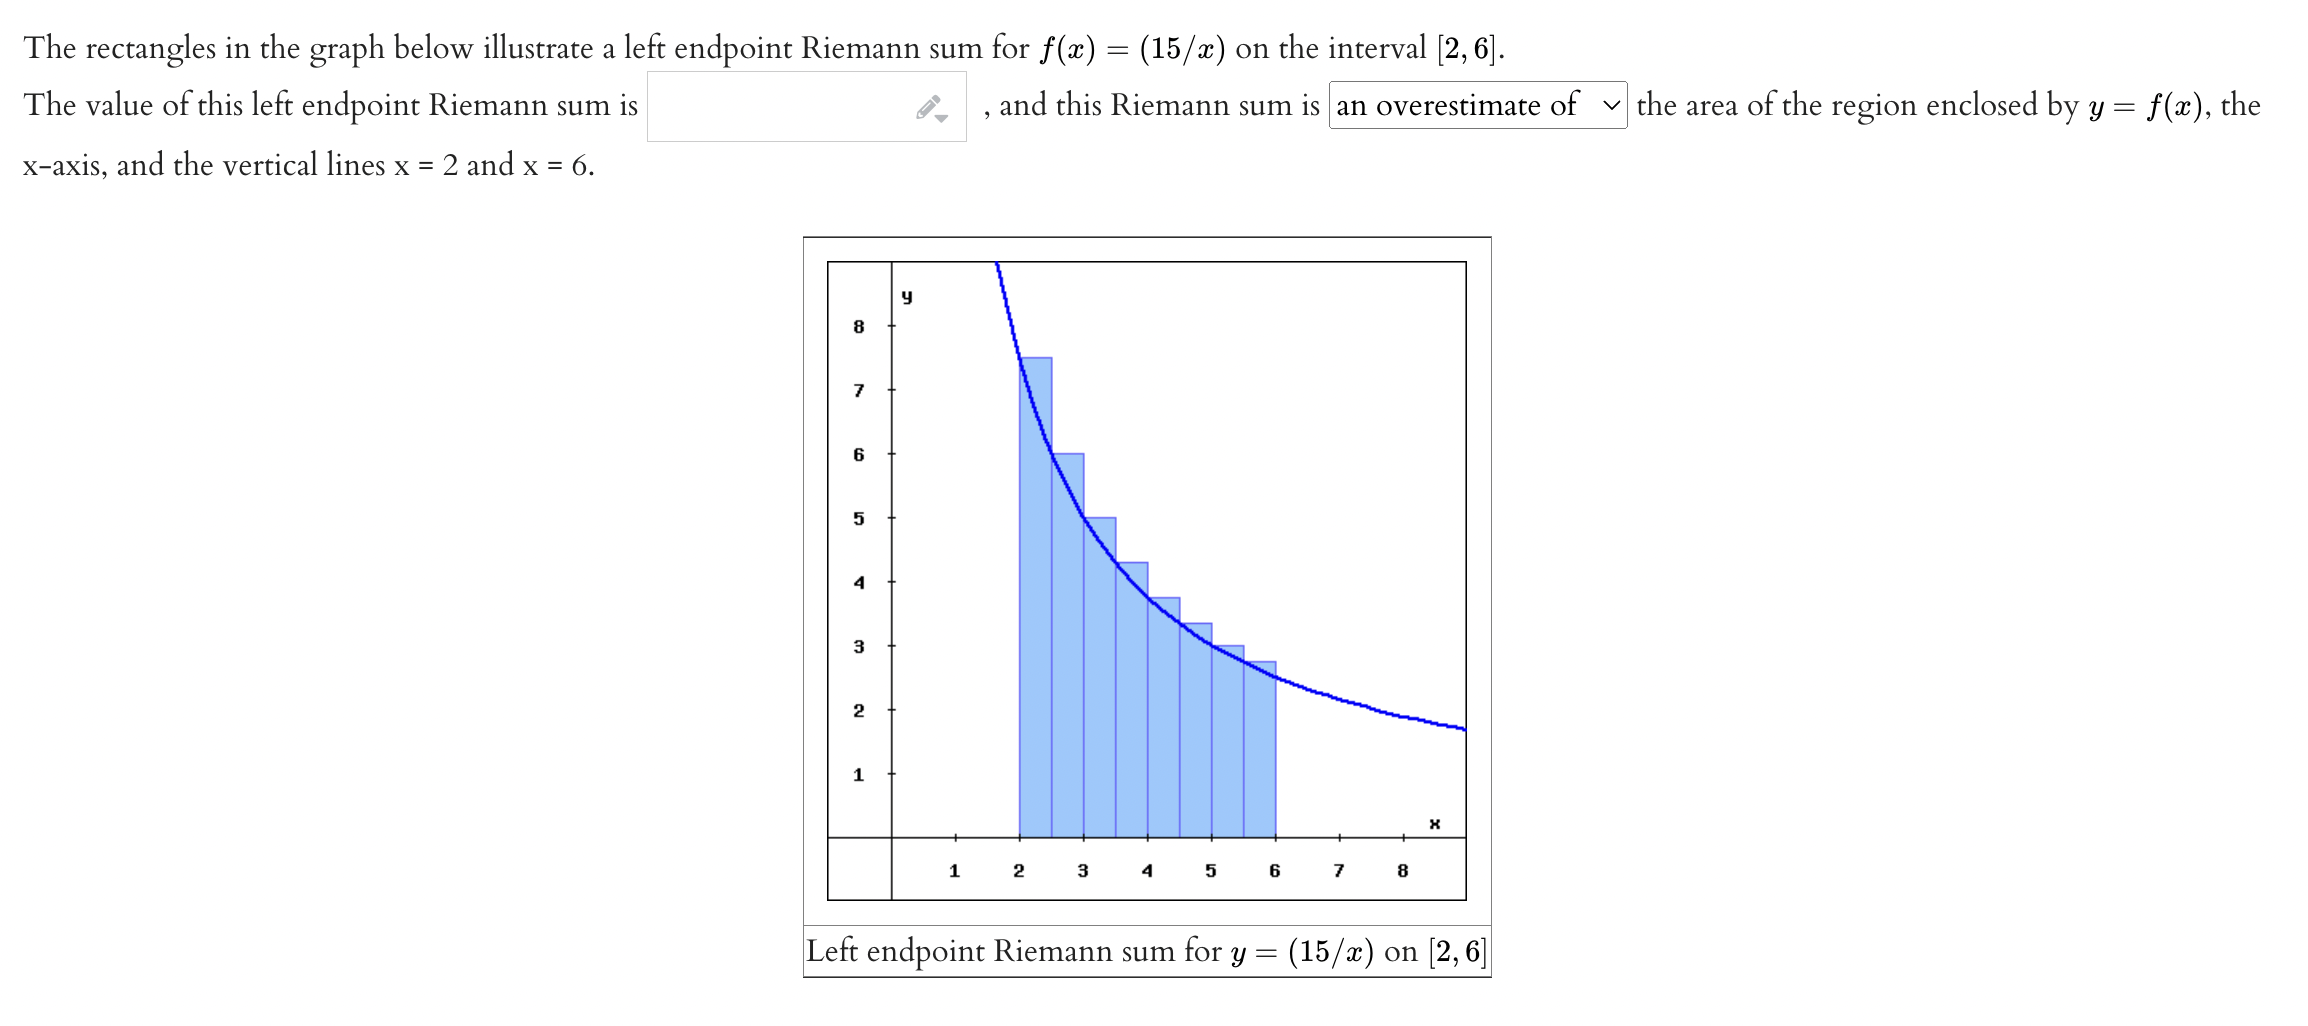
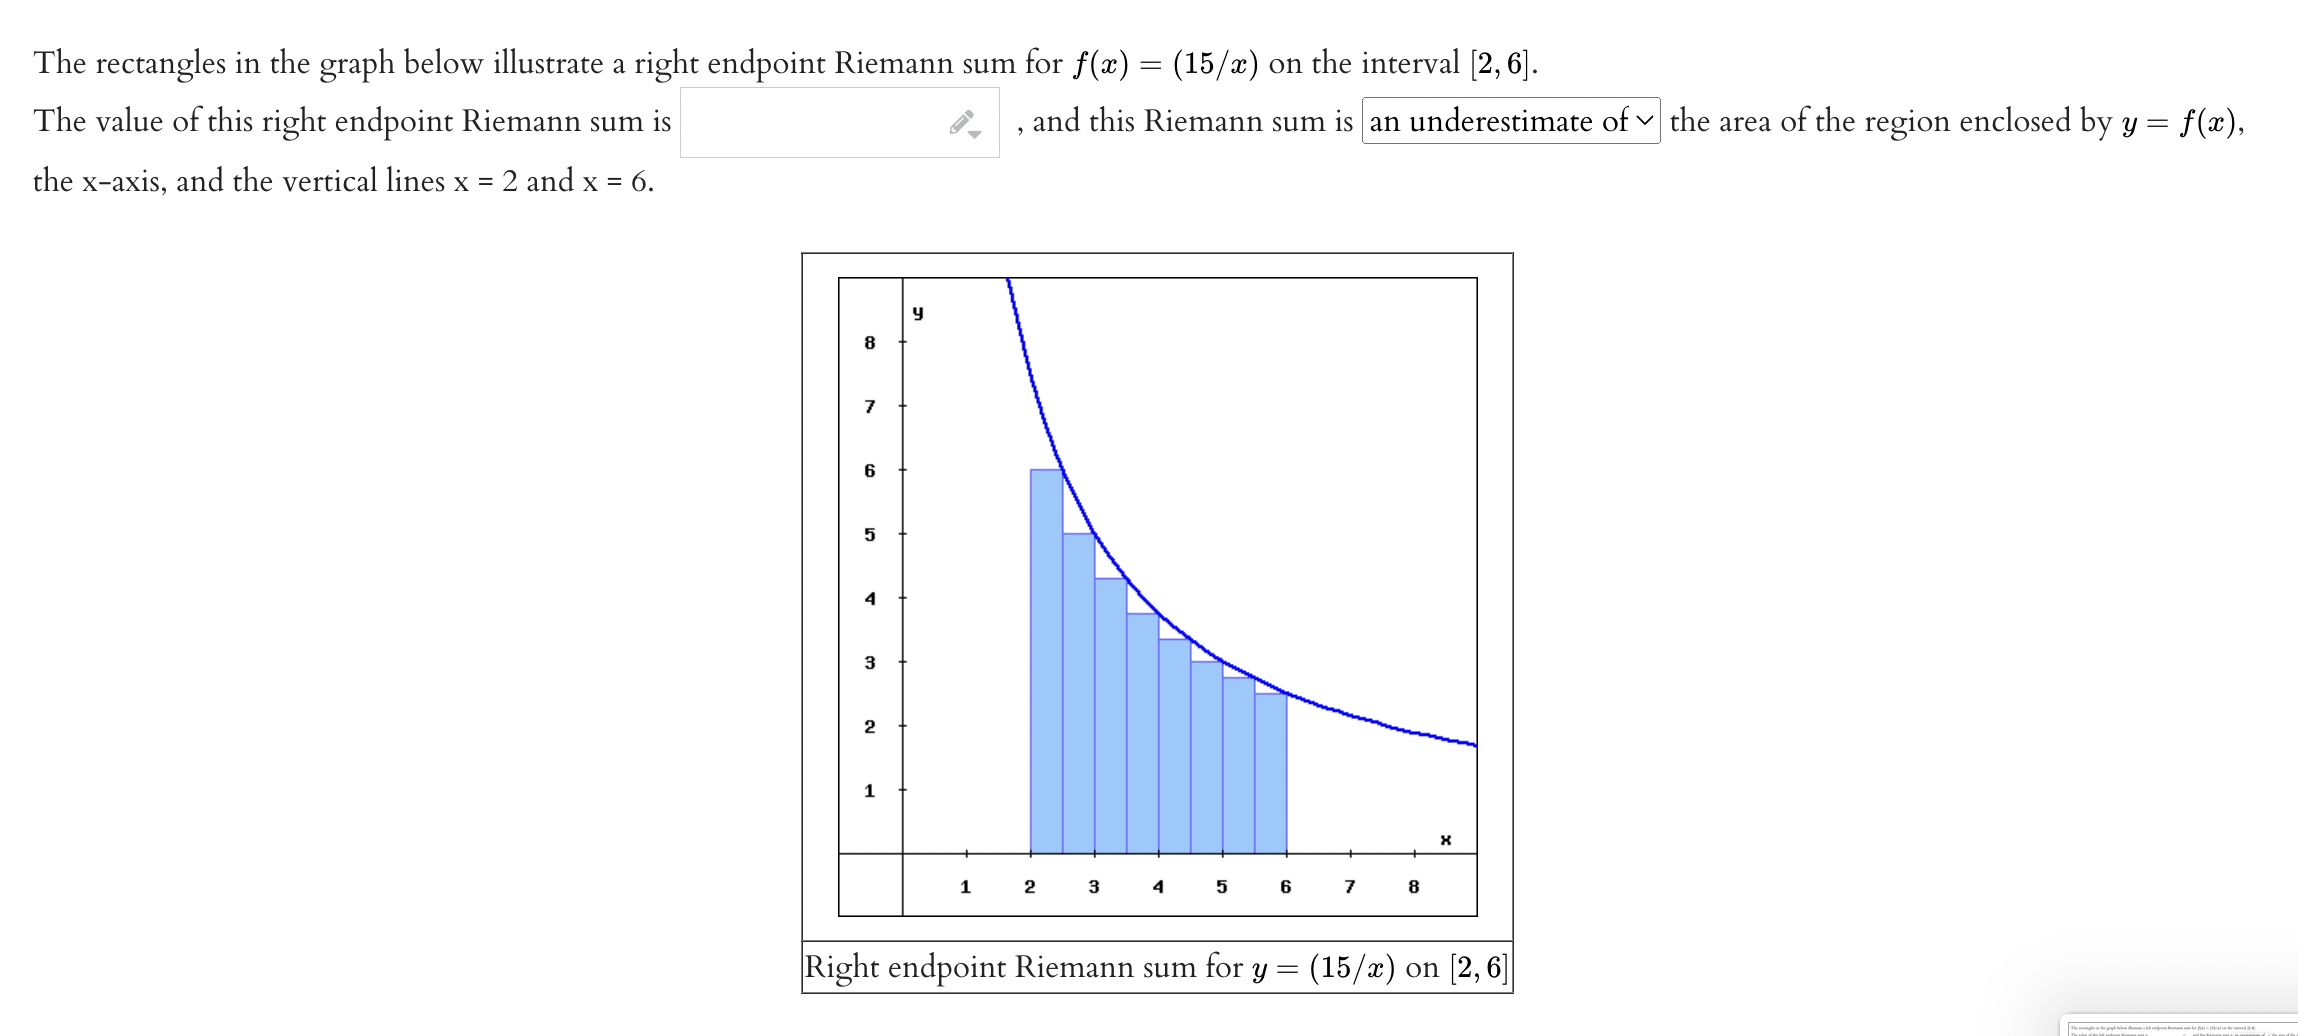
The rectangles in the graph below illustrate a left endpoint Riemann sum for at) = (15 / as) on the interval [2, 6]. The value of this left endpoint Riemann sum is f. , and this Riemann sum is the area of the region enclosed by y = at), the xaxis, and the vertical lines X = 2 and x = 6. Left endpoint Riemann sum for y = (15 / w) on [2, 6] The rectangles in the graph below illustrate a right endpoint Riemann sum for f(x) = (15 / an) on the interval [2, 6]. The value of this right endpoint Riemann sum is I; , and this Riemann sum is an underestimate of V the area of the region enclosed by y = f(1t), the Xaxis, and the vertical lines x = 2 and x = 6. Right endpoint Riemann sum for y = (15/11:) on [2, 6]
Step by Step Solution
There are 3 Steps involved in it

Get step-by-step solutions from verified subject matter experts