

Answered step by step
Verified Expert Solution
Question
1 Approved Answer
18. Label the graph below using the measurements of central tendency (mean, median and mode). Arrival after the scheduled class hour Histogram Count 45
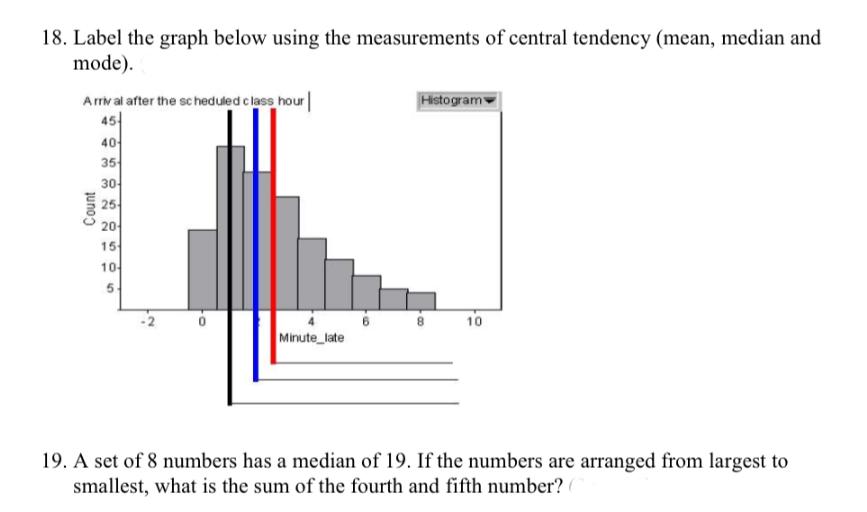
18. Label the graph below using the measurements of central tendency (mean, median and mode). Arrival after the scheduled class hour Histogram Count 45 40 35 30- 25 20 15 10- 5 10 8 10 Minute_late 19. A set of 8 numbers has a median of 19. If the numbers are arranged from largest to smallest, what is the sum of the fourth and fifth number?
Step by Step Solution
There are 3 Steps involved in it
Step: 1
Solutions This is ...
Get Instant Access to Expert-Tailored Solutions
See step-by-step solutions with expert insights and AI powered tools for academic success
Step: 2

Step: 3
Ace Your Homework with AI
Get the answers you need in no time with our AI-driven, step-by-step assistance
Get Started
Transportation A Global Supply Chain Perspective
Authors: John J. Coyle, Robert A. Novak, Brian Gibson, Edward J. Bard
8th edition
9781305445352, 1133592961, 130544535X, 978-1133592969