

Question: A design engineer wants to construct a sample mean chart for controlling the service life of a halogen headlamp his company produces. He knows from
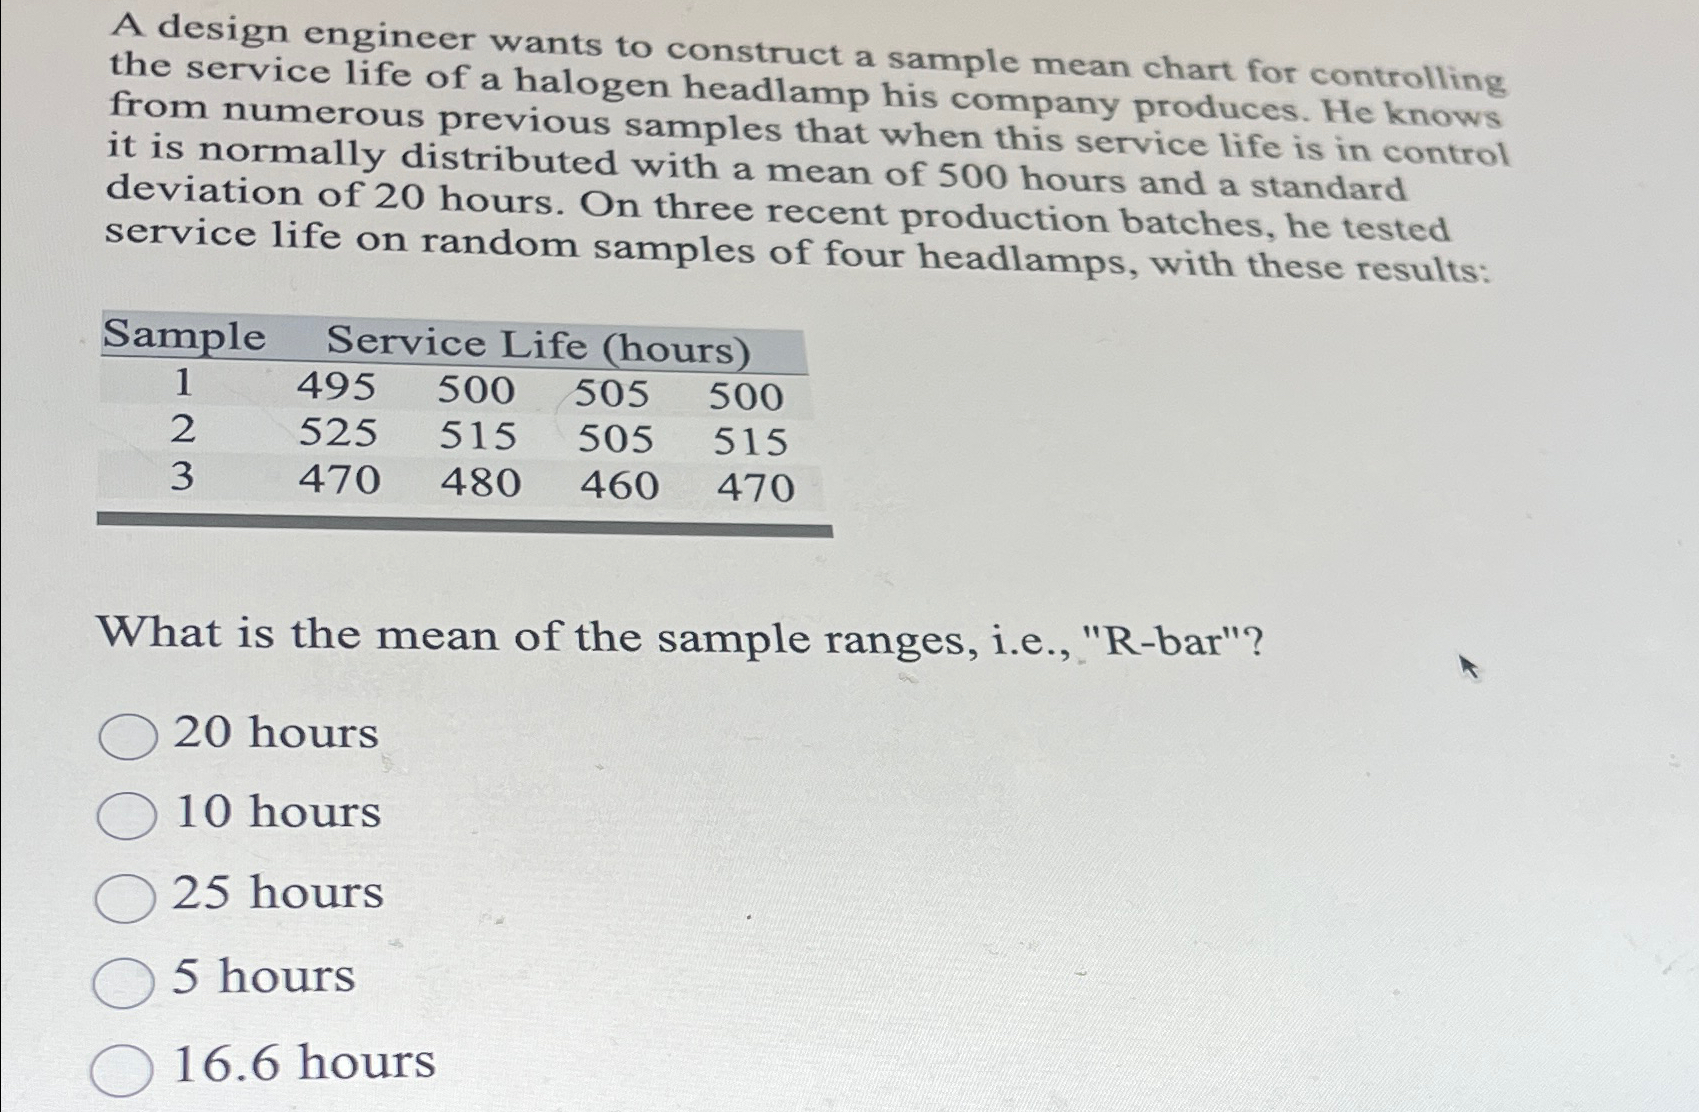
A design engineer wants to construct a sample mean chart for controlling the service life of a halogen headlamp his company produces. He knows from numerous previous samples that when this service life is in control it is normally distributed with a mean of hours and a standard deviation of hours. On three recent production batches, he tested service life on random samples of four headlamps, with these results:
tableSampleService Life hours
What is the mean of the sample ranges, ieRbar"?
hours
hours
hours
hours
hours
Step by Step Solution
There are 3 Steps involved in it
1 Expert Approved Answer
Step: 1 Unlock

Question Has Been Solved by an Expert!
Get step-by-step solutions from verified subject matter experts
Step: 2 Unlock
Step: 3 Unlock