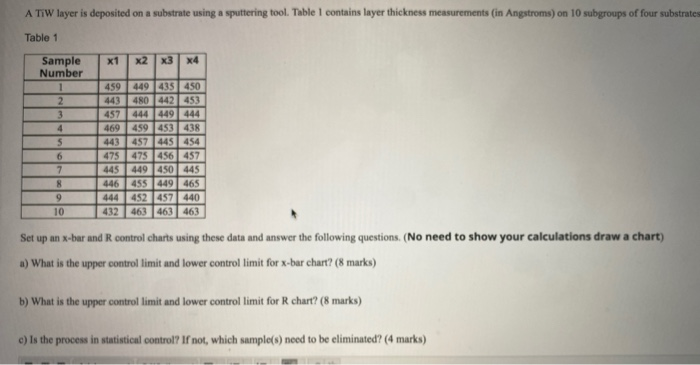
Question: A TIW layer is deposited on a substrate using a sputtering tool. Table I contains layer thickness measurements (in Angstroms) on 10 subgroups of four

A TIW layer is deposited on a substrate using a
A TIW layer is deposited on a substrate using a sputtering tool. Table I contains layer thickness measurements (in Angstroms) on 10 subgroups of four substrates Table 1 Sample Number x1 X2 x3 X4 2 4 5 6 7 8 9 10 459 449 435 450 480 442 453 457 444 449 444 469 459 453 438 443 457 445 454 475 475 456 457 445 449 450 445 446 455 449 465 444 452 457 440 432 463 463 463 Set up an x-bar and R control charts using these data and answer the following questions. (No need to show your calculations draw a chart) a) What is the upper controllimit and lower controllimit for x-bar chart? (8 marks) b) What is the upper controllimit and lower controllimit for R chart? (8 marks) c) Is the process in statistical control? If not, which sample(s) need to be eliminated? (4 marks)

Step by Step Solution

There are 3 Steps involved in it

1 Expert Approved Answer
Step: 1 Unlock blur-text-image
Question Has Been Solved by an Expert!

Get step-by-step solutions from verified subject matter experts

Step: 2 Unlock
Step: 3 Unlock

Students Have Also Explored These Related General Management Questions!