

Question: B) AND FIND THE MAD (mean absolute deviation) Data collected on the yearly registrations for a Six Sigma seminar at the Quality College are shown
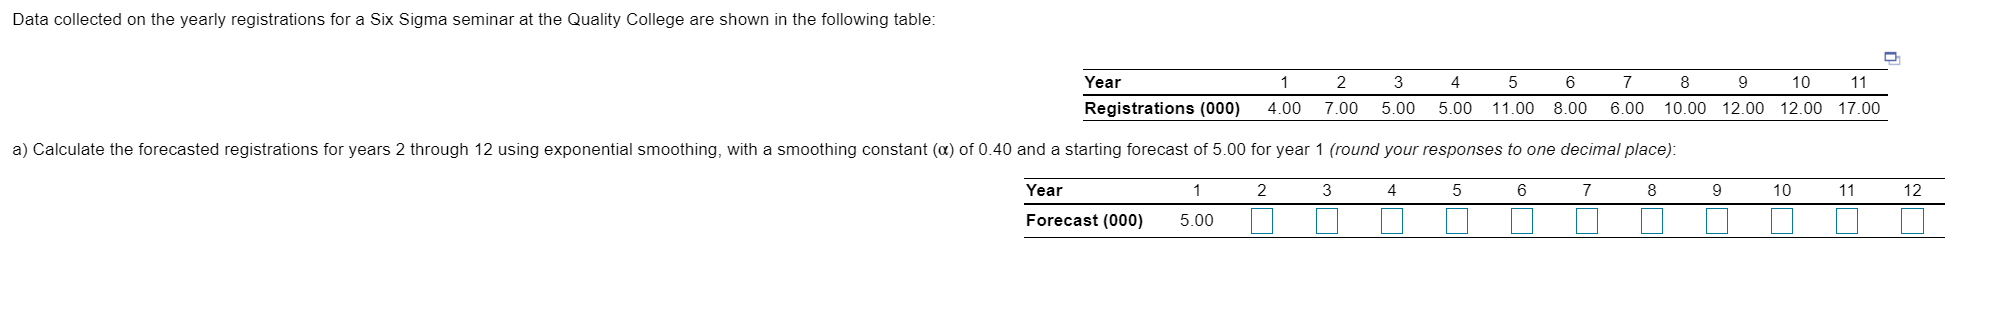 B) AND FIND THE MAD (mean absolute deviation)
Step by Step Solution
There are 3 Steps involved in it
1 Expert Approved Answer
Step: 1 Unlock

Question Has Been Solved by an Expert!
Get step-by-step solutions from verified subject matter experts
Step: 2 Unlock
Step: 3 Unlock